Tracking Down and Fixing Performance Bottlenecks with N|Solid and Deoptigate

Image © Thorsten Lorenz
A while ago I benchmarked two XML parsing libraries, xml2js and htmlparser. The main goal was to determine if using the streaming interface will result in better performance and lower memory footprint.
The results were a bit surprising, as they clearly showed that streaming resulted in greater memory and garbage collection overhead if more than 30 parse requests were handled concurrently. This turned out to be due to the fact that all those parsers had to maintain state for each request being processed while waiting for more chunks to come in.
Therefore, collecting the incoming chunks into a buffer (buffering), stringifying it at the very last moment and parsing it all in one step, then immediately releasing the buffer, turned out to be the superior solution in this case.
Given that discovery and the fact that xml2js is a very widely used library (with about 3 million weekly downloads), I thought it might be worthwhile to improve the performance of its buffering parser.
Finding out What's Slow
The first step in this endeavour was to use NodeSource's N|Solid CPU Profiling Features in order to find out which parts of xml2js were taking most of the time during parses.
I won't go into too much detail on how to easily obtain a CPU profile with N|Solid, but please refer to Understanding CPU flame graphs to learn more.
In order to load the parser with different kinds of XML payloads, I created a small script. I also increased the iterations to about 500 in order to have ample time to take a CPU profile with N|Solid.
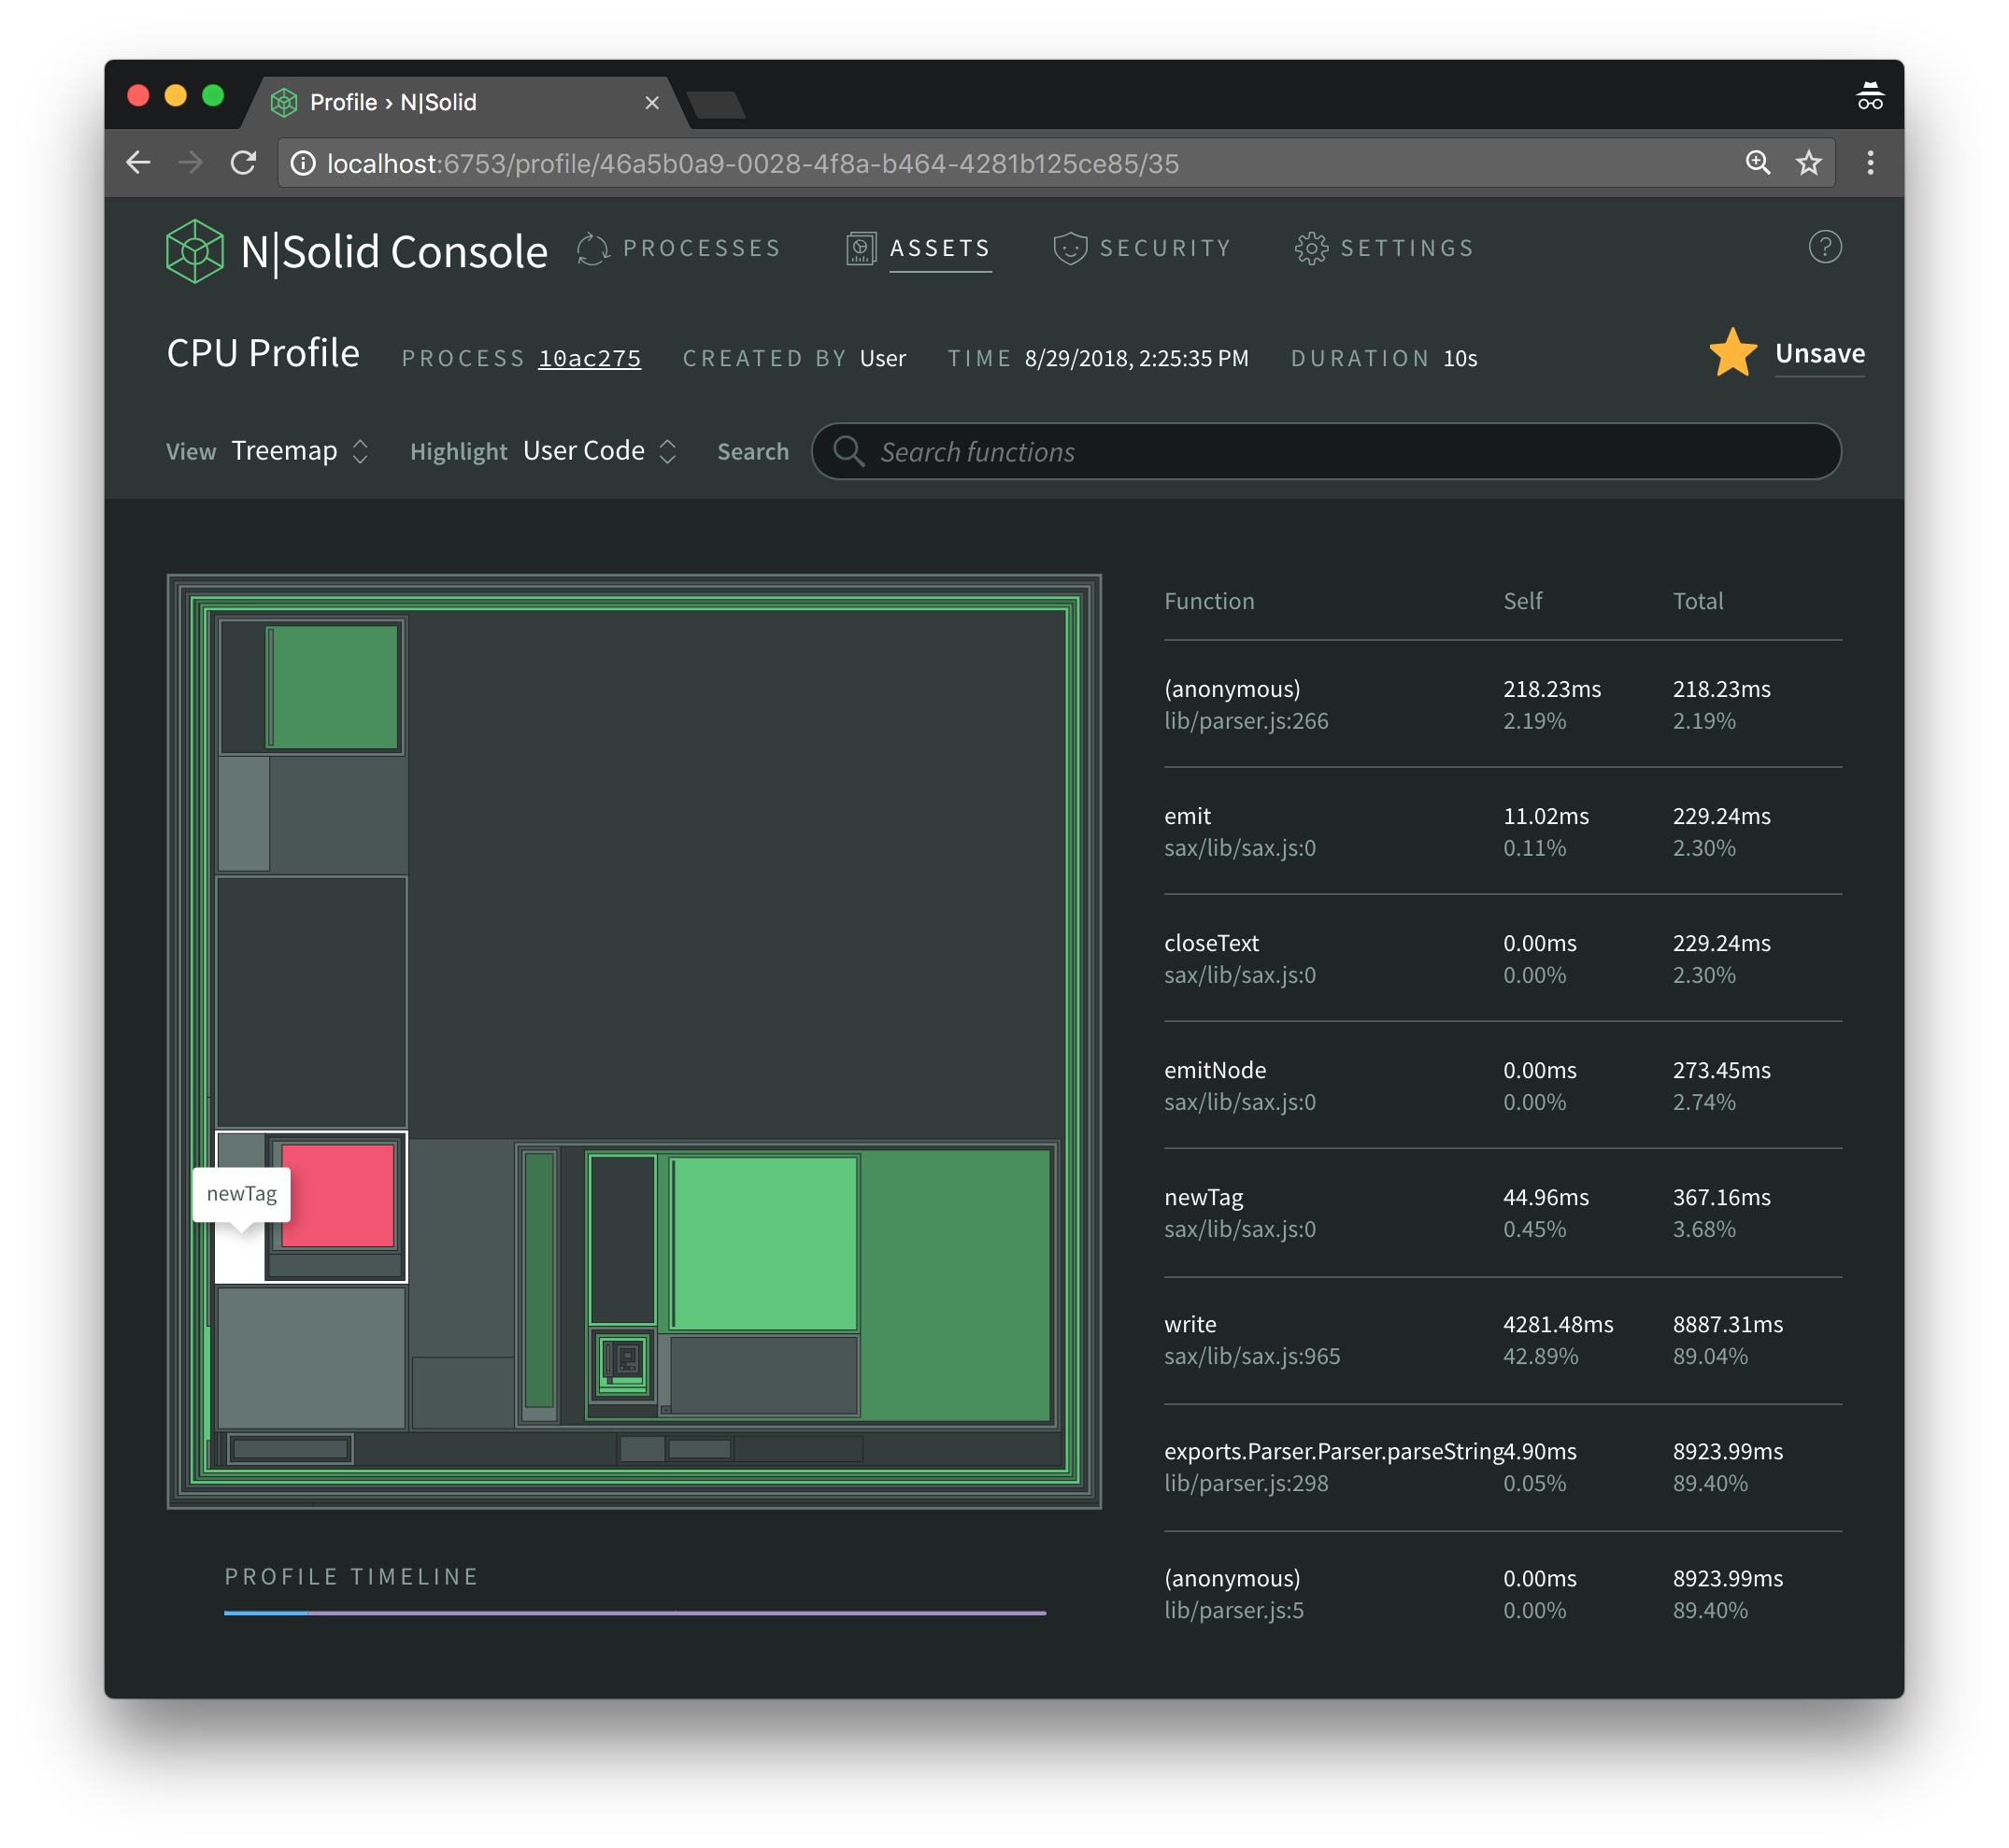
I decided to visualize the CPU profile information using N|Solid’s Treemap view, but Sunburst and Flamegraph views are available as well.
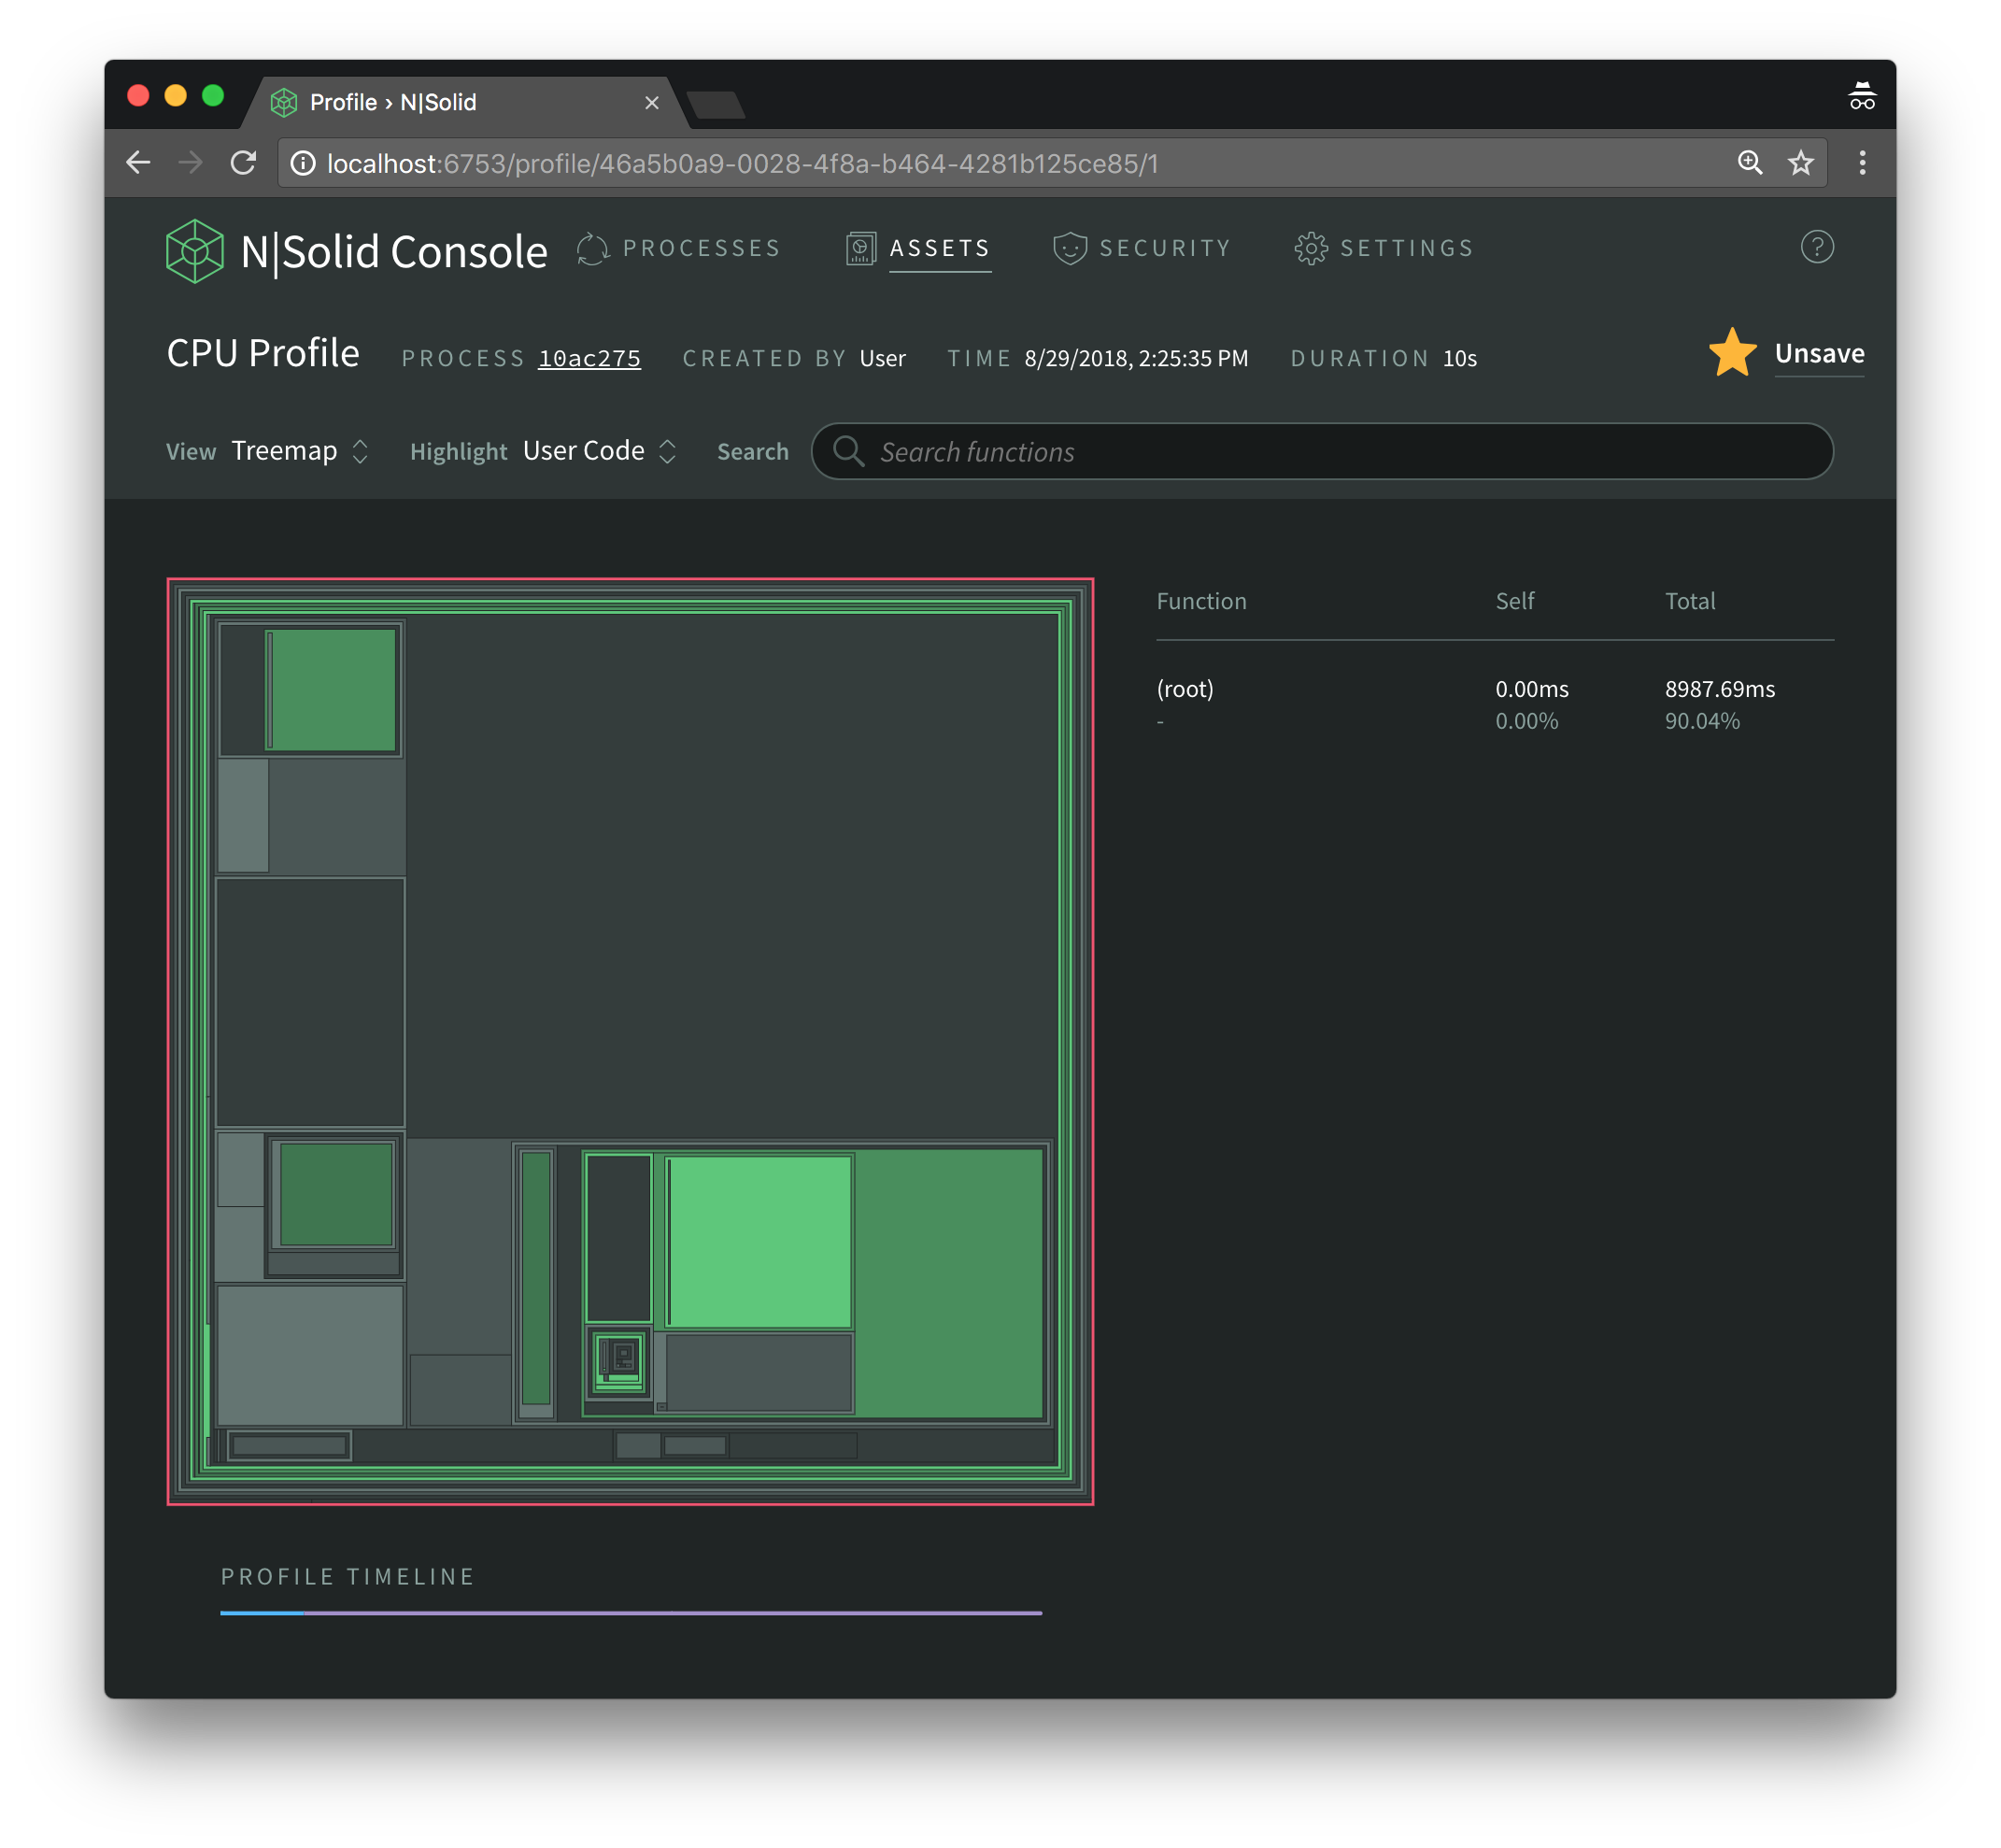
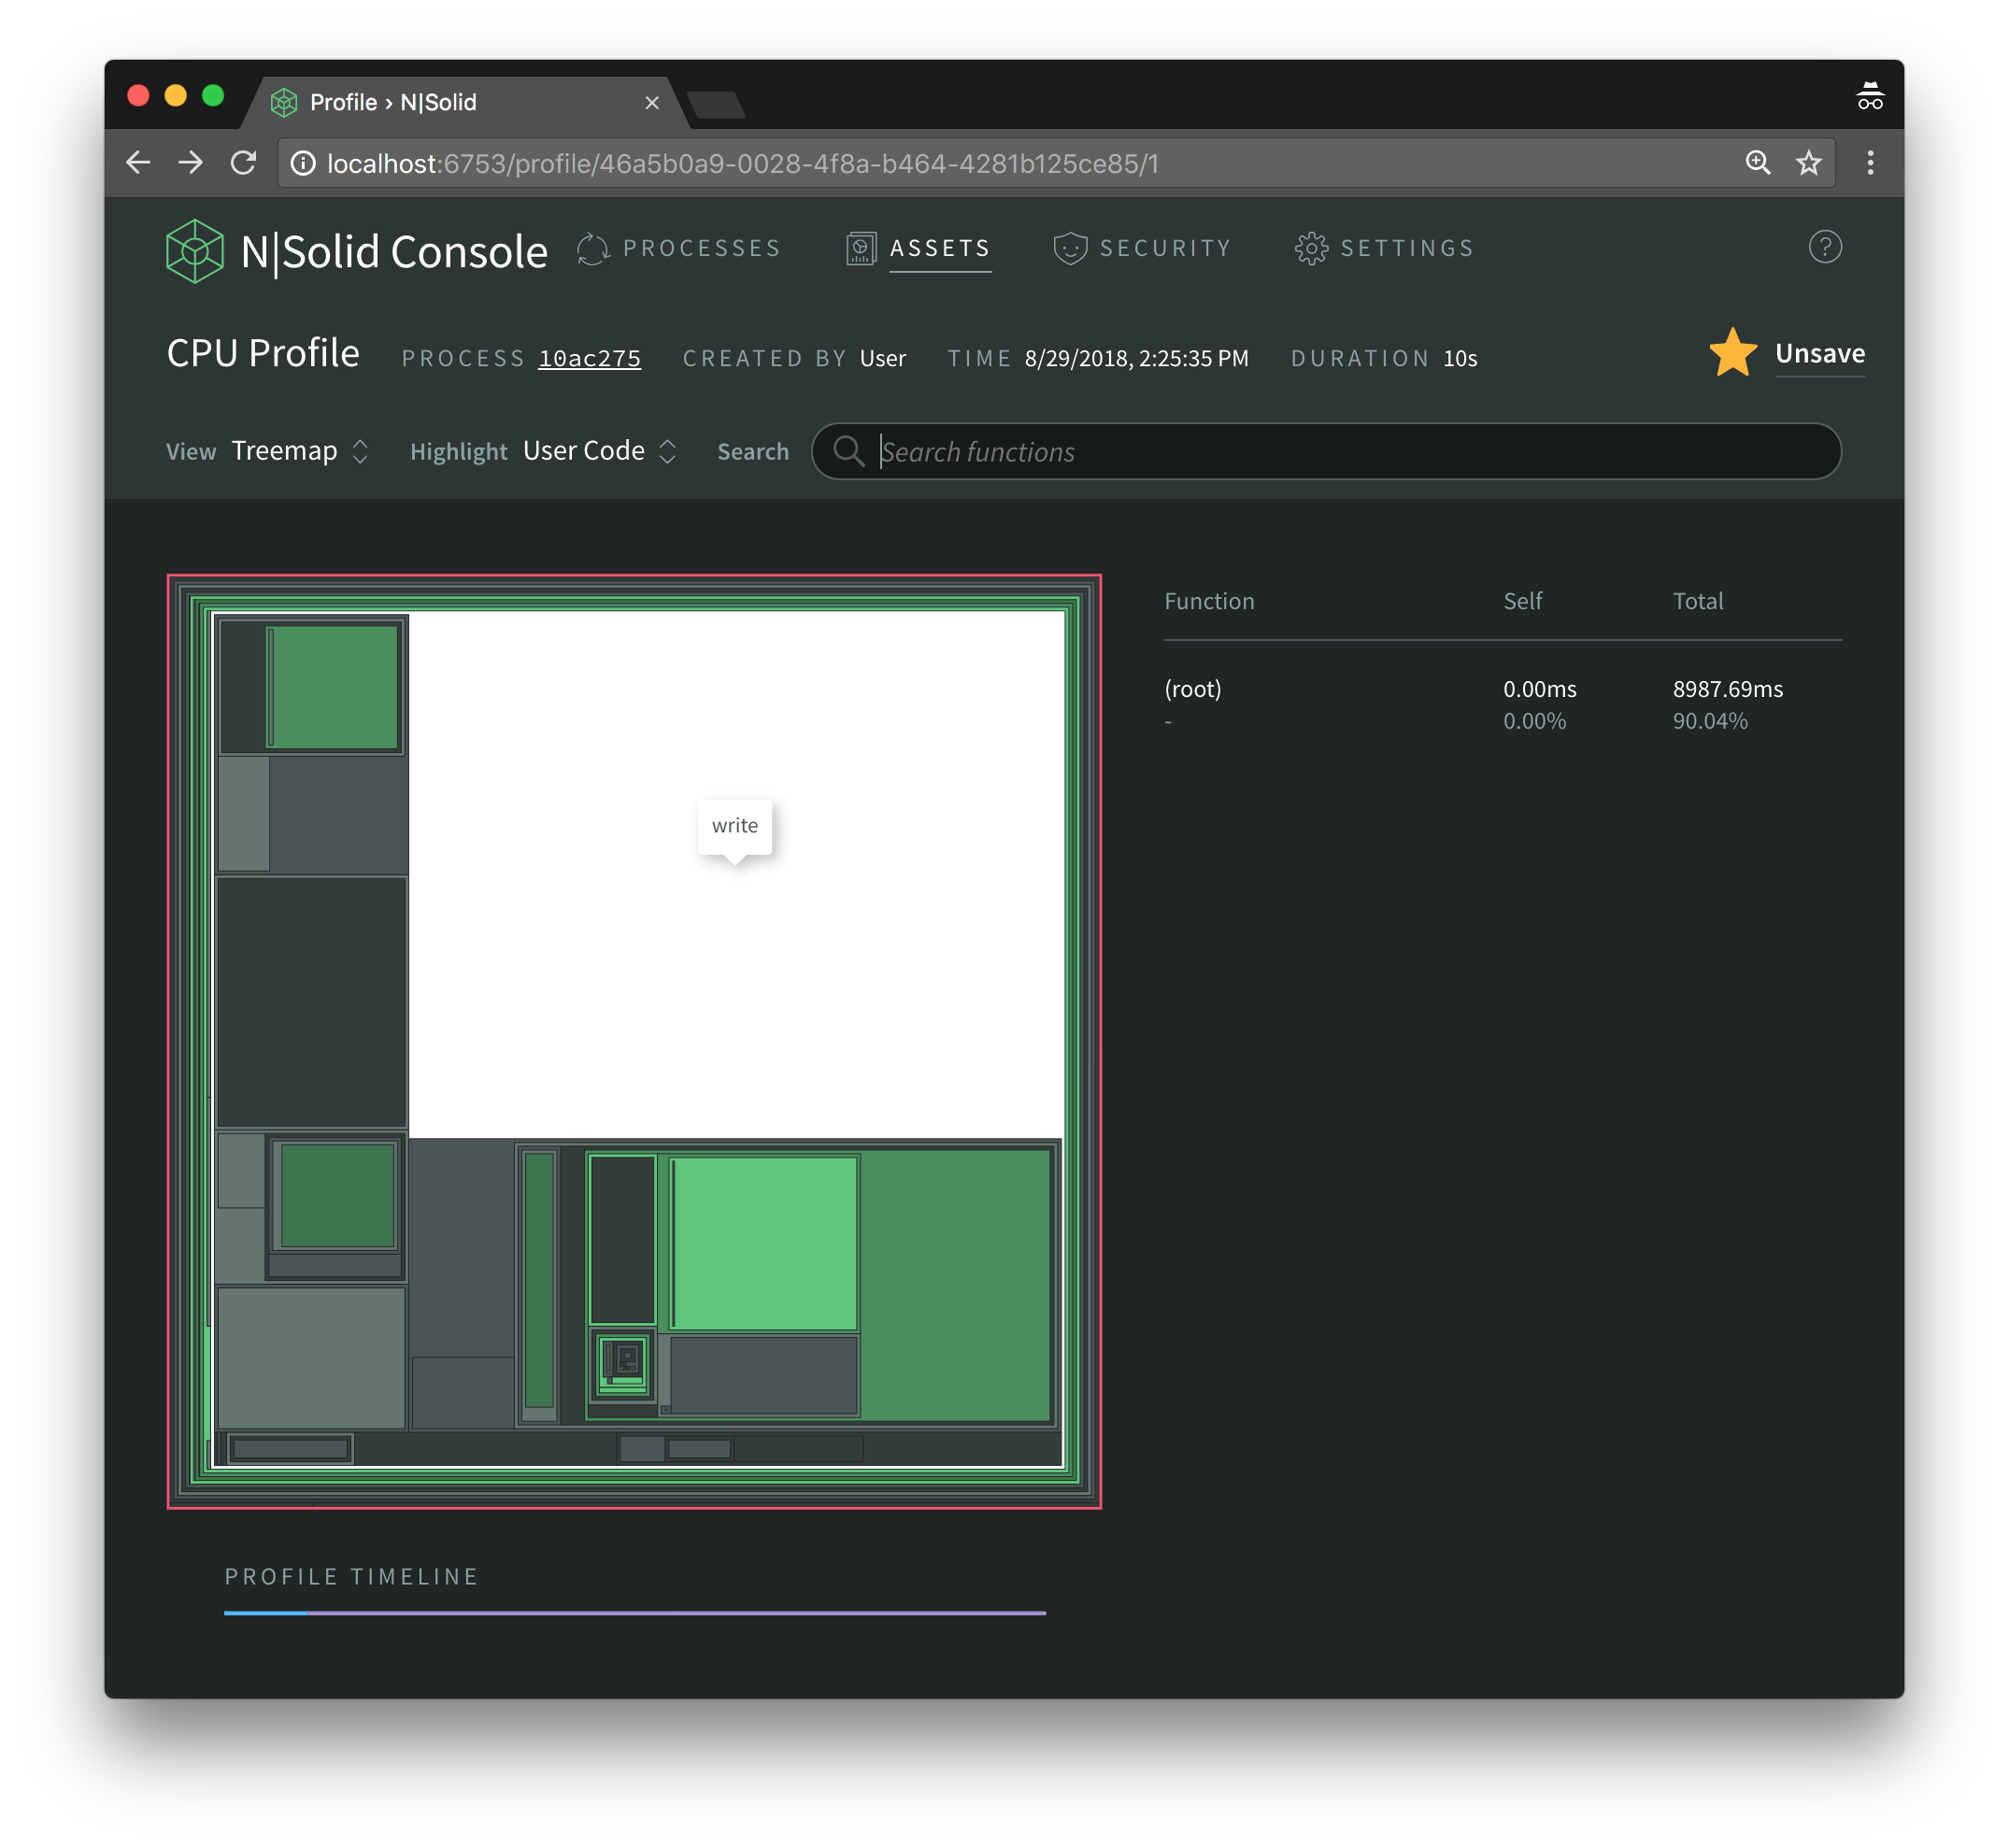
By hovering we can quickly identify that the write function itself is taking up the largest amount of time, and that most of the remaining time is taken up by functions invoked by write.
When we click on it we realize that it took up about 43% of the execution time while the functions it invoked took about 46% (89% - 43%).
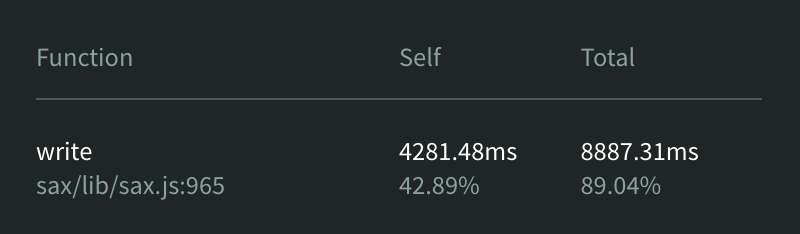
Since write itself is defined in the sax library which is a dependency of xml2js, we will focus on the functions it invokes instead as we are trying to improve xml2js and not sax.
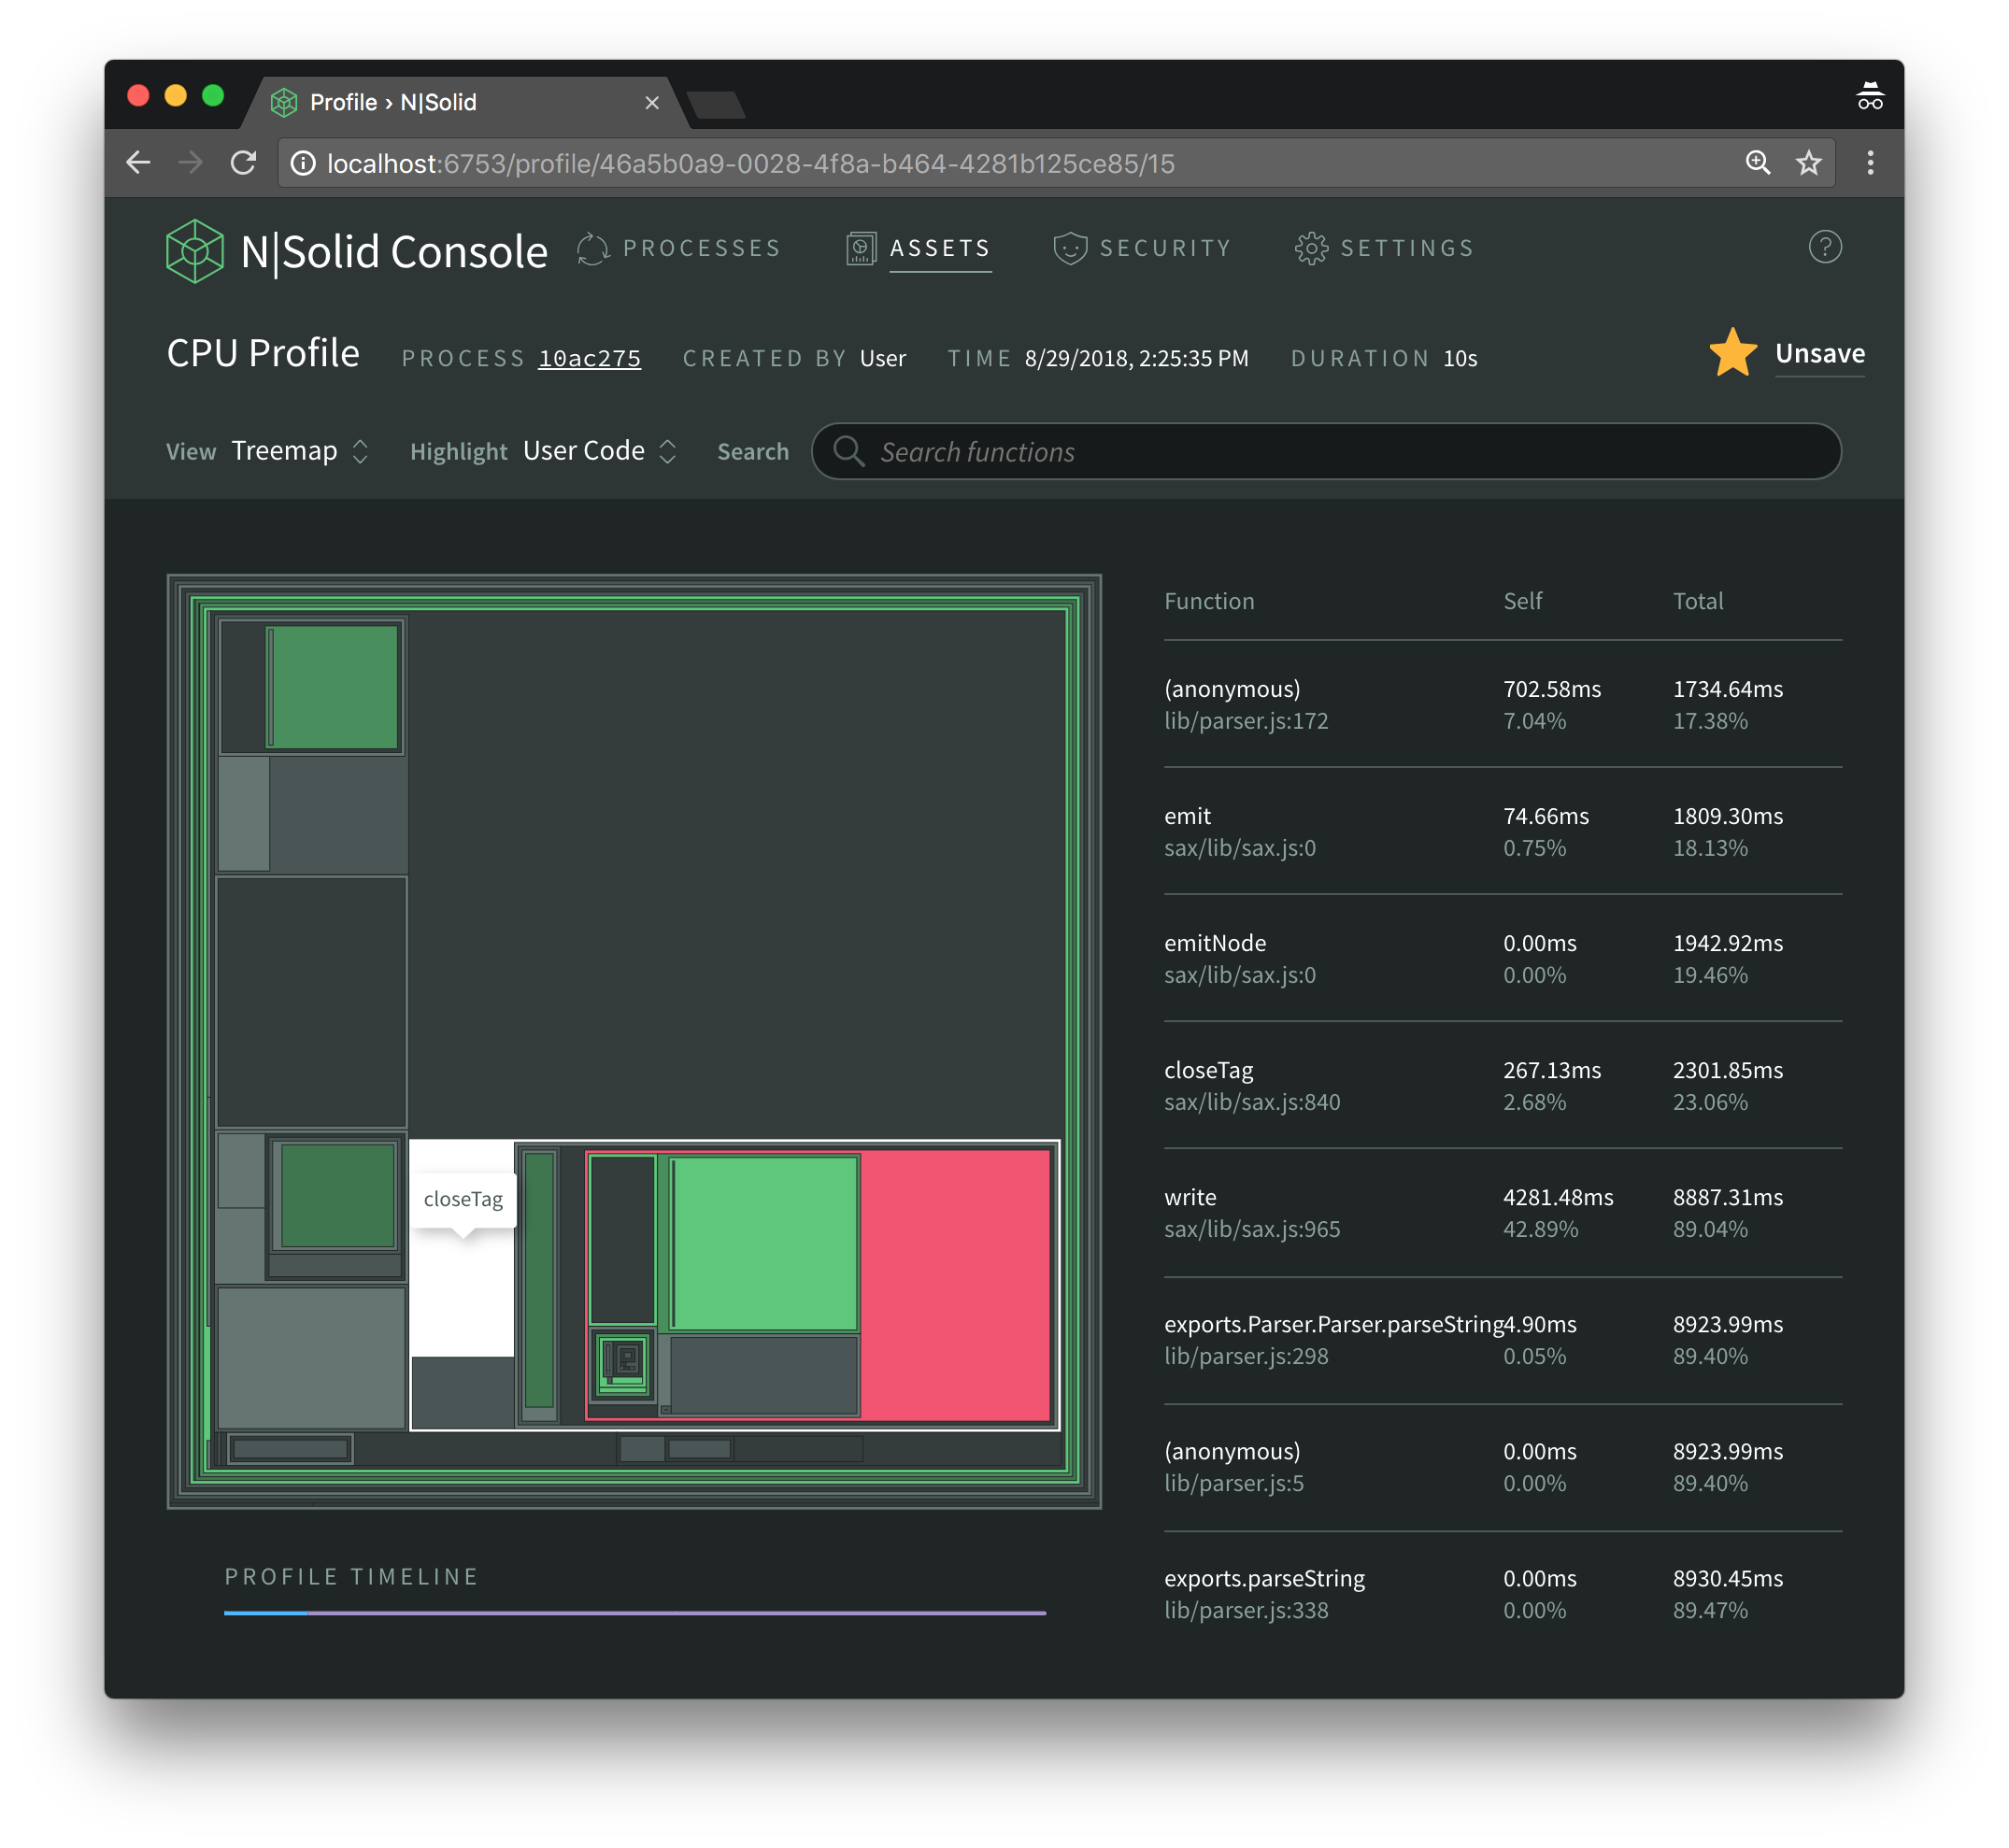
Let's have a closer look at the remaining rectangles in the treemap.
In the upper left we have the openTag function which is also defined inside sax but ends up invoking an anonymous function, which is where most of its execution time is spent.
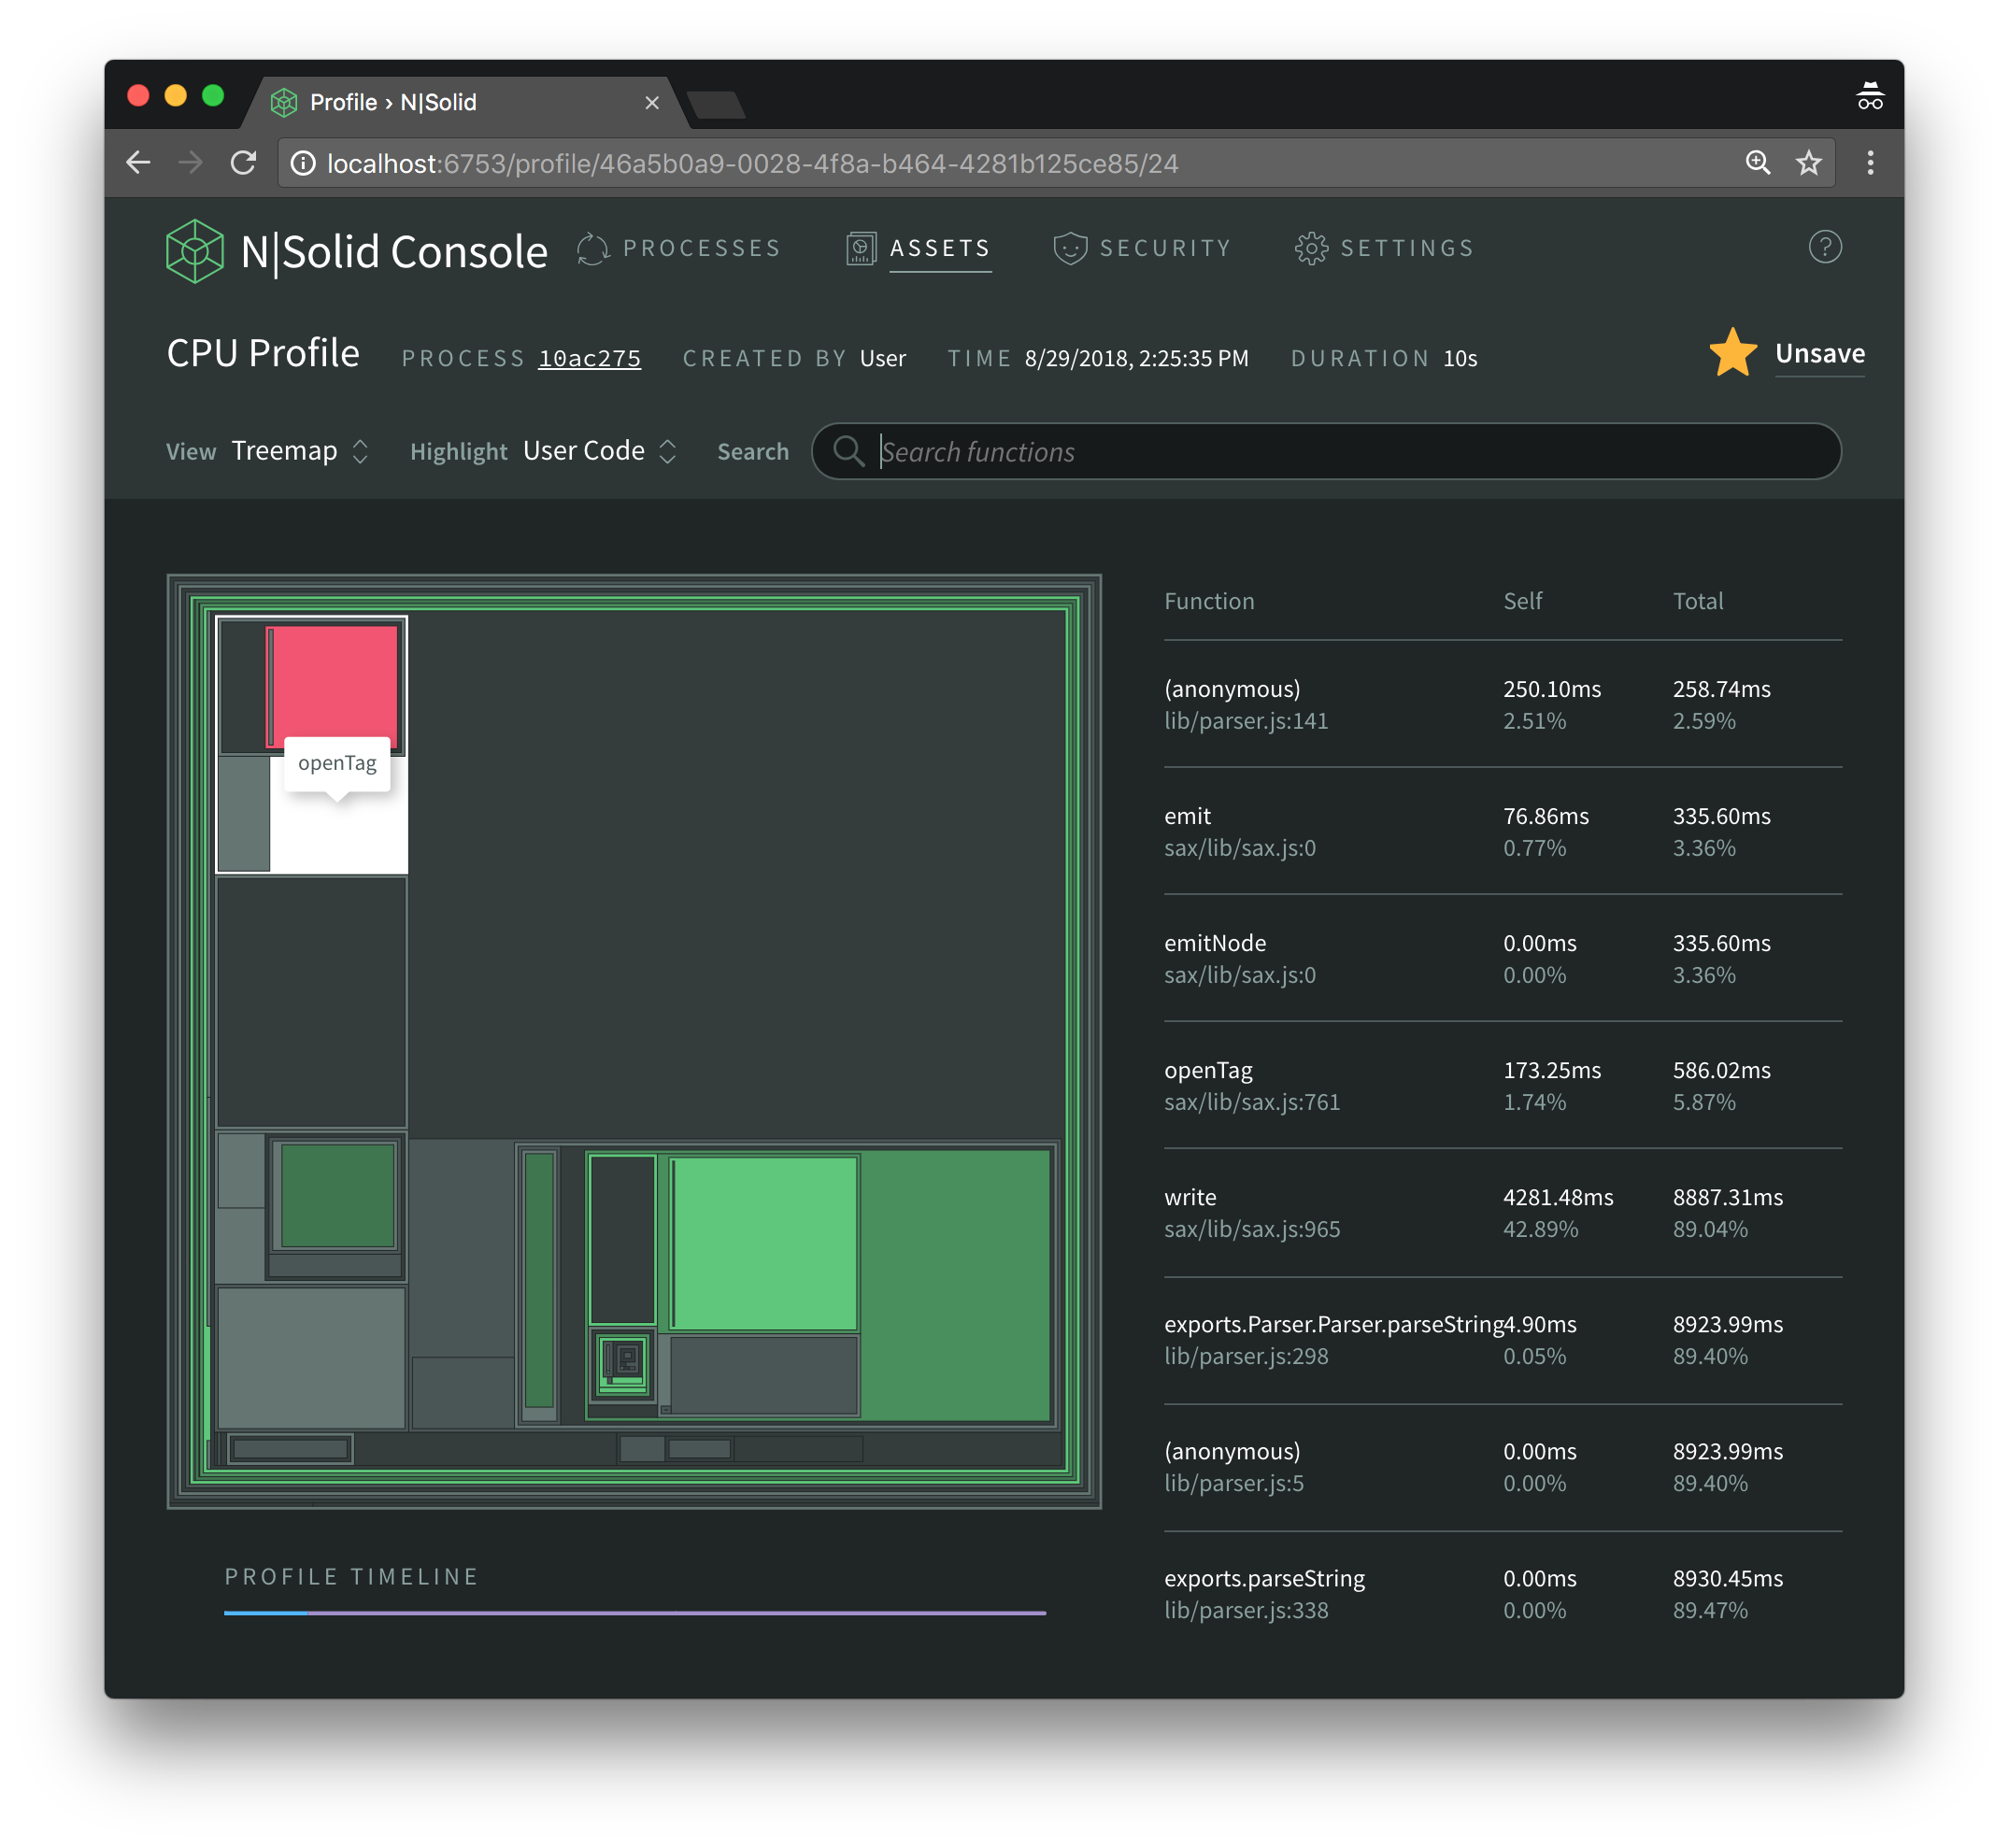
As we can see, that anonymous function is defined in the xml2js parser. The fact that it is anonymous makes our detective work a little harder, on top of the fact that xml2js is authored in CoffeeScript and we thus are looking at generated JavaScript.
Let's see what's on line 141 of lib/parser.js inside the xml2js library.
140:       this.saxParser.onopentag = (function(_this) {
141:         return function(node) {
142:           var key, newValue, obj, processedKey, ref;
[ ... ]
169:         };
170:       })(this);
As we can see the code creates an anonymous function on line 141 which is passed the this context via a self-invoking wrapper function. That function is then assigned to the saxParser's onopentag callback. onopentag is invoked whenever the parser encounters an XML tag opening.
Right below we find the rectangle showing the execution time of the test function, which is the built-in to test strings against regular expressions and directly invoked by the sax library; and thus is also out of scope for us at this point.
The same is the case for the charAt rectangle at the very bottom left.
However, right below the test rectangle we find another anonymous function that is defined inside the xml2js parser and invoked by sax's newTag function via closeText.
265:       ontext = (function(_this) {
266:         return function(text) {
267:           var charChild, s;
[ ... ]
284:         };
285:       })(this);
286:       this.saxParser.ontext = ontext;
It's created as before and then assigned to saxParser.ontext.
Finally, in the bottom right we find closeTag most of whose time is spent inside another anonymous function.
171:       this.saxParser.onclosetag = (function(_this) {
172:         return function() {
173:           var cdata, emptyStr, key, node, nodeName, obj, objClone, old, s, xpath;
[ ... ]
263:         };
264:       })(this);
The pattern here is the same as before; it is clear by now that if we can somehow speed up one or more of those three anonymous functions we will improve the overall performance of the xml2js library. But first, we have to understand if and why they are running slower than they could be.
Finding out Why it's Slow
There are many reasons why a library can be slow. In most cases, algorithms should be examined first, as well as I/O interactions, like requests over the network, if they take place.
In this case we are dealing with a parser into which we pass a string, so there’s no I/O occuring inside xml2js and the algorithm is fairly straightforward, as it just aggregates information passed to it by the sax library via callbacks.
Let's focus on some improvements we can make in order to allow V8 to generate highly optimized code. Basically, we will look for code snippets that get in V8's way when trying to do so.
In order to track those issues down we will use deoptigate, a tool that I introduced in my last post.
After installing the deoptigate tool via npm install -g deoptigate, we can simply rerun the benchmark with deoptigate, like this:
deoptigate ./scripts/multi-files.xml2js-buffering.js
As we are using the official master branch of xml2js, our results reflect its current state.
You can investigate the results from this example yourself; alternately, all screenshots below are clickable and take you right to the specific issue we are inspecting.
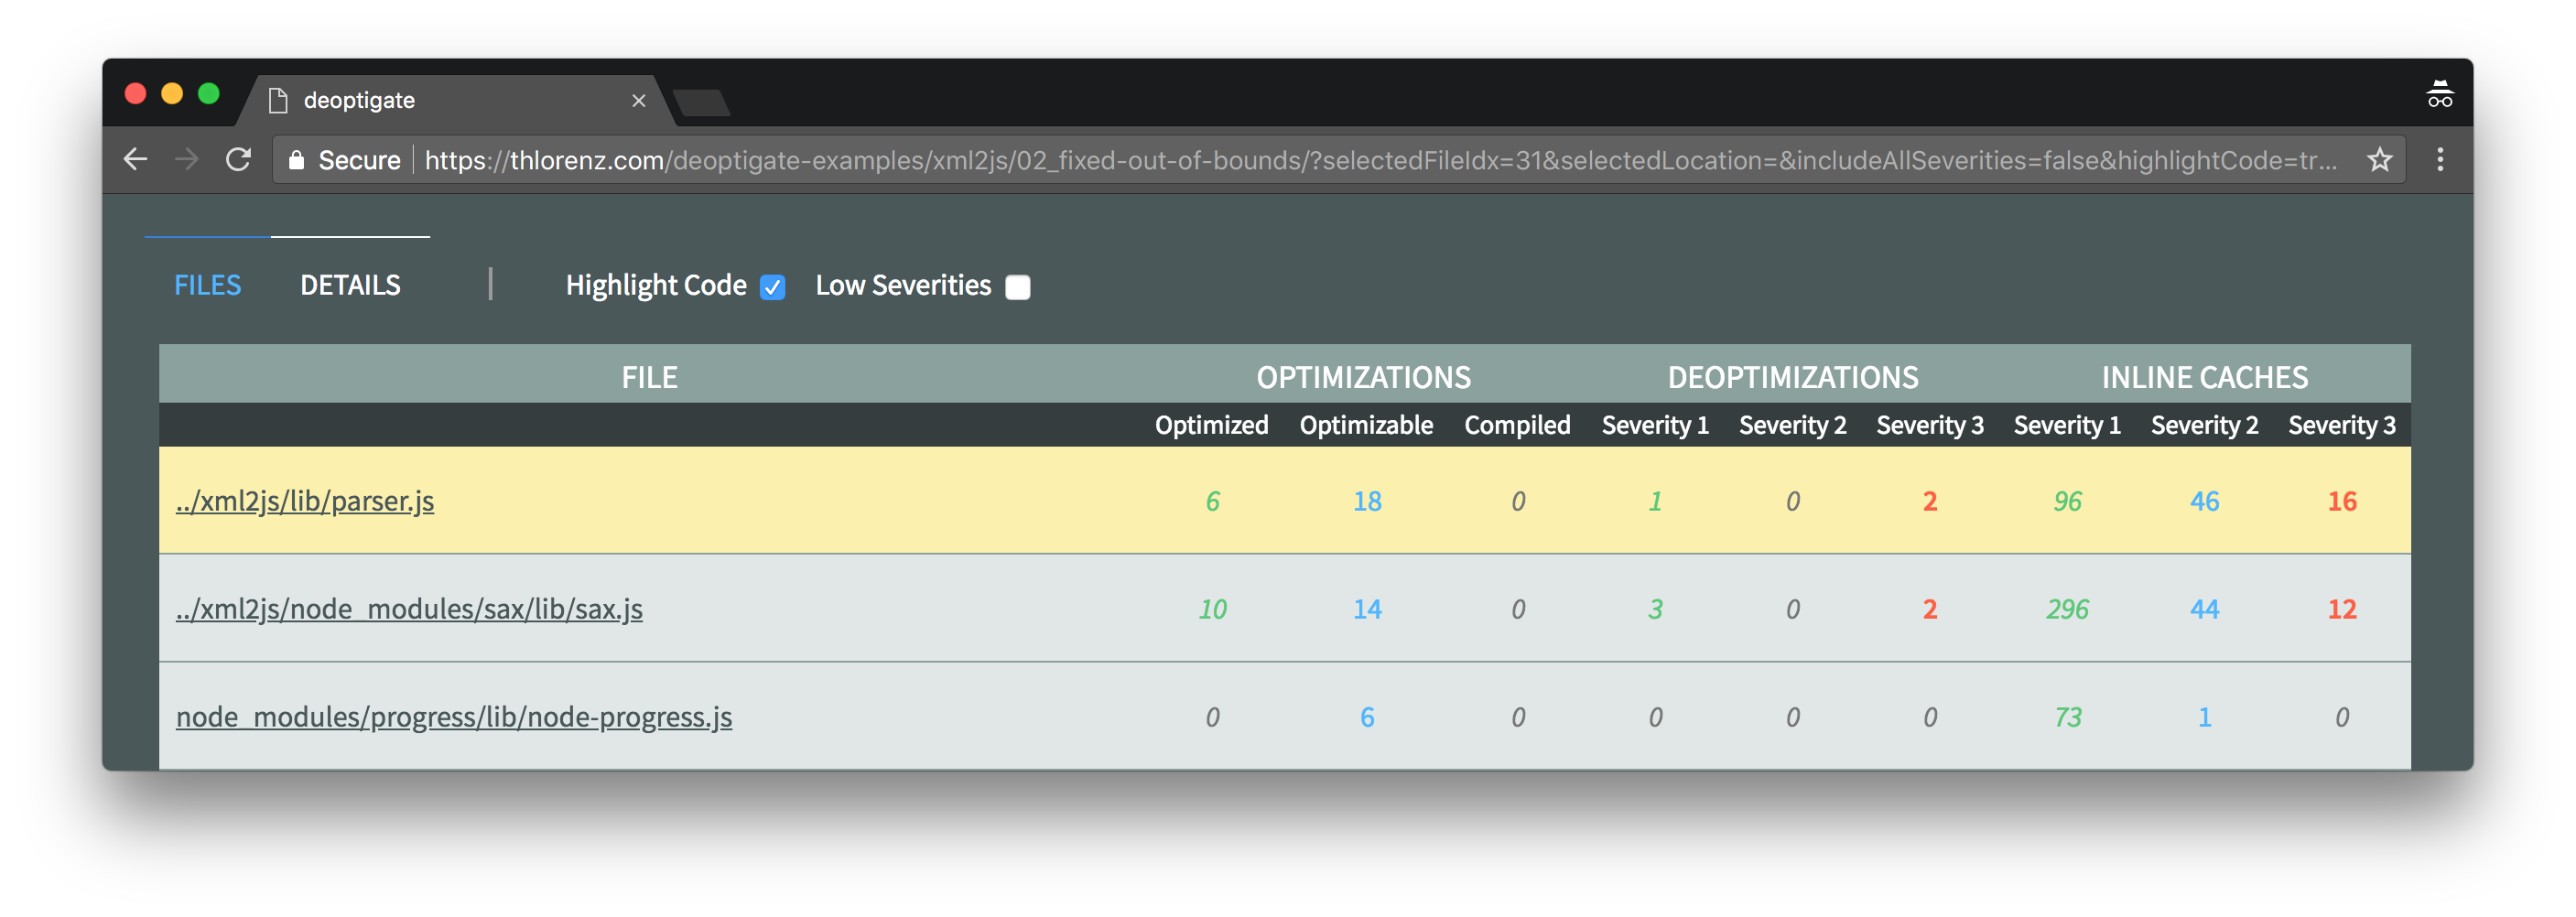
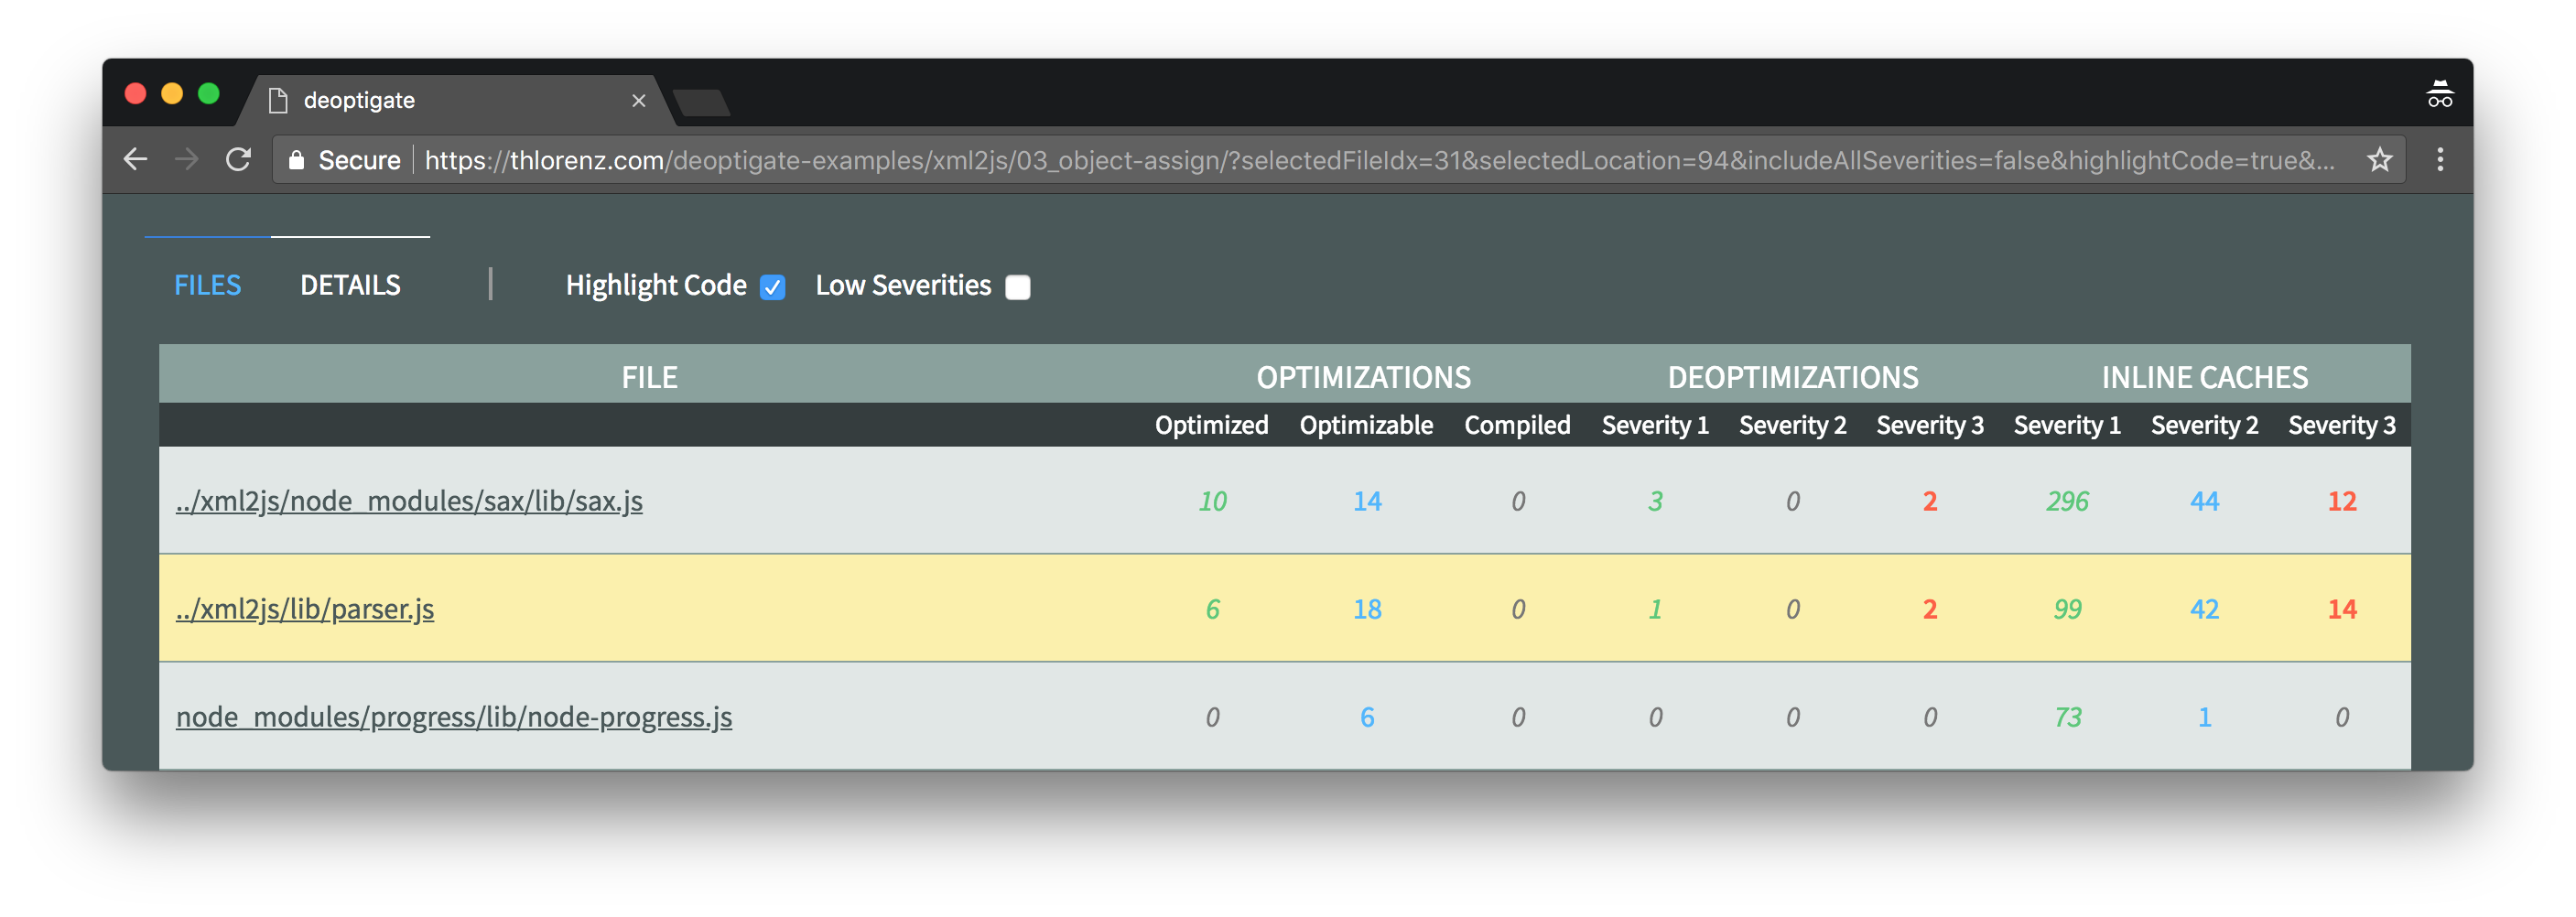
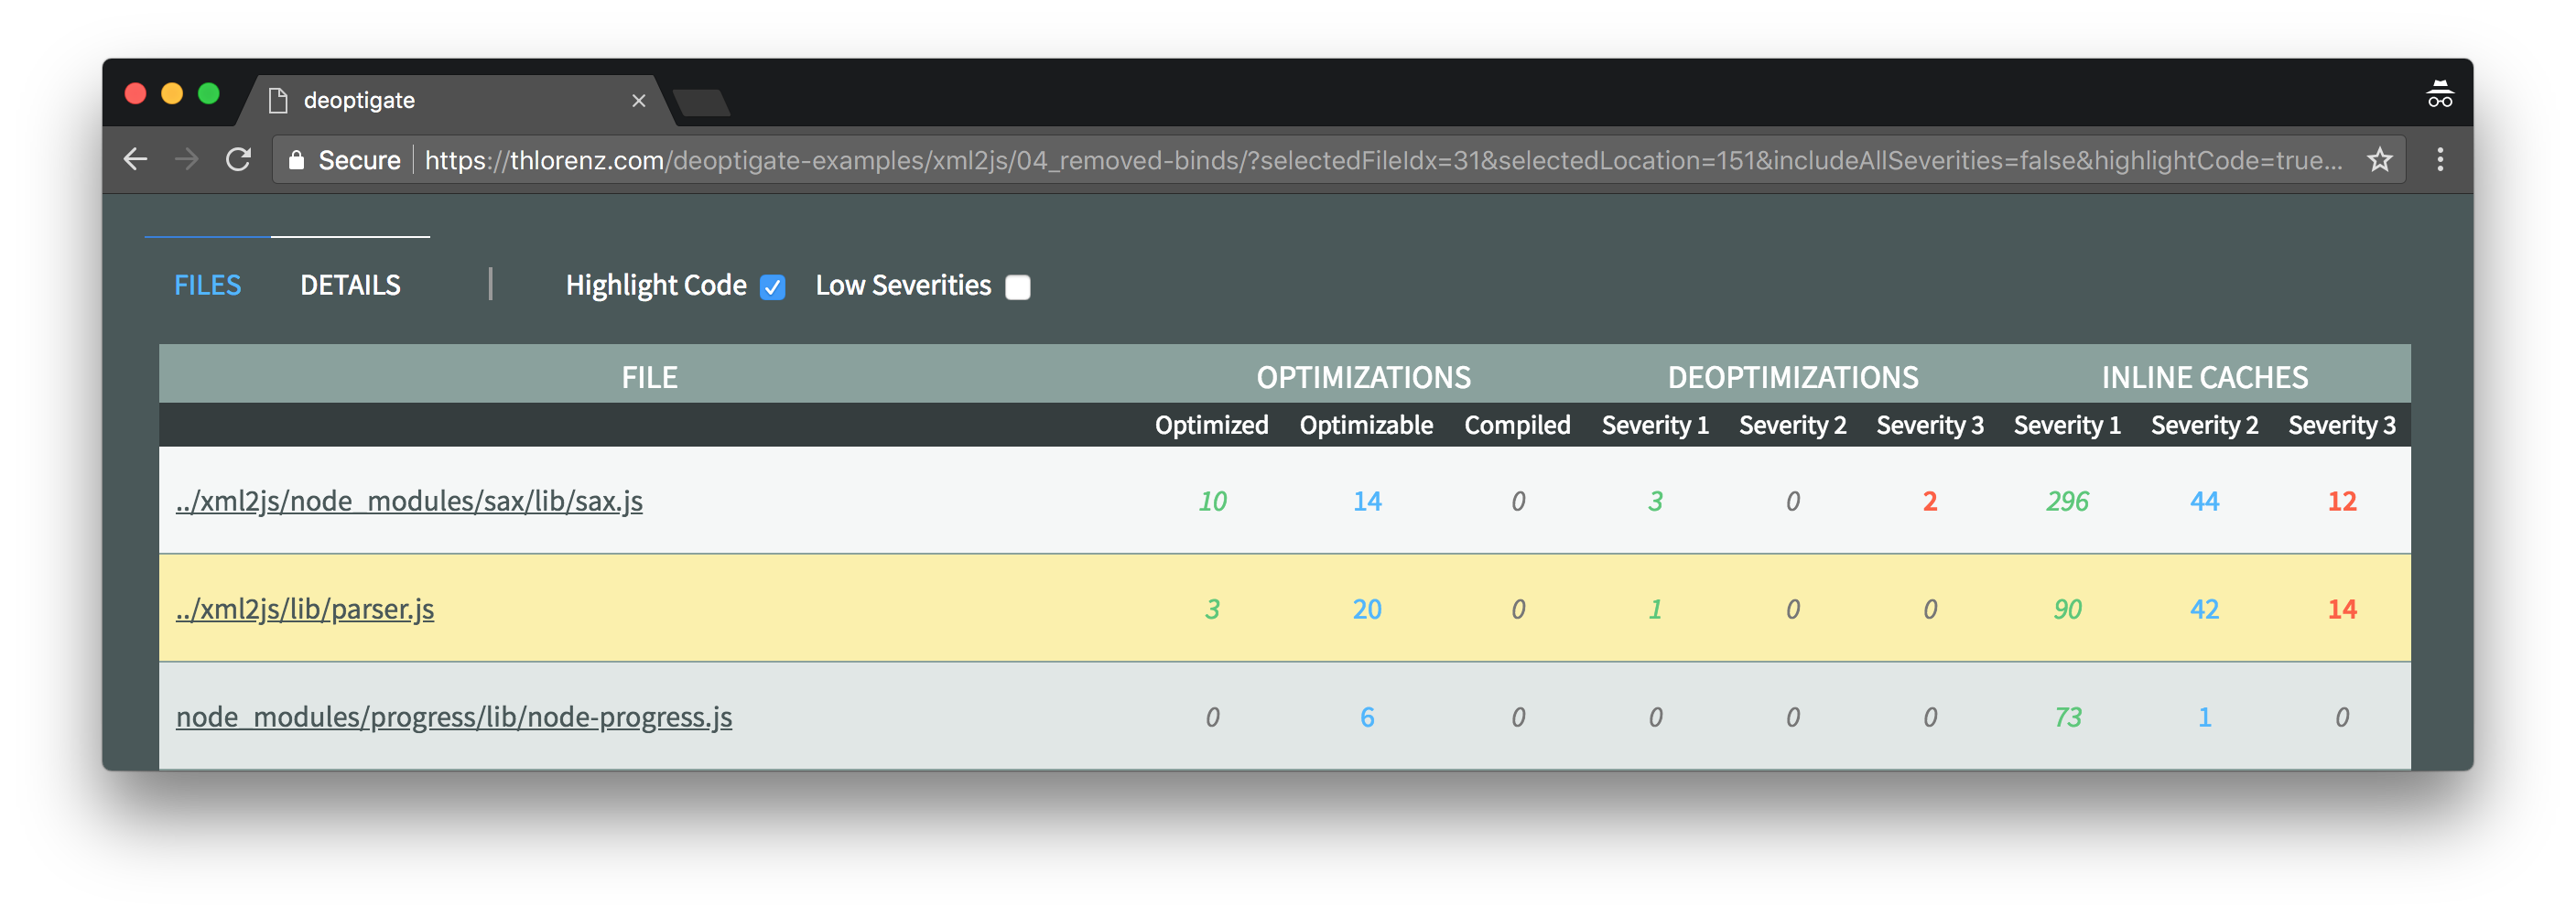
As we can see in the below screenshot, the xml2js/lib/parser.js module is right on top of the list of files sorted by number and severity of potential performance issues.
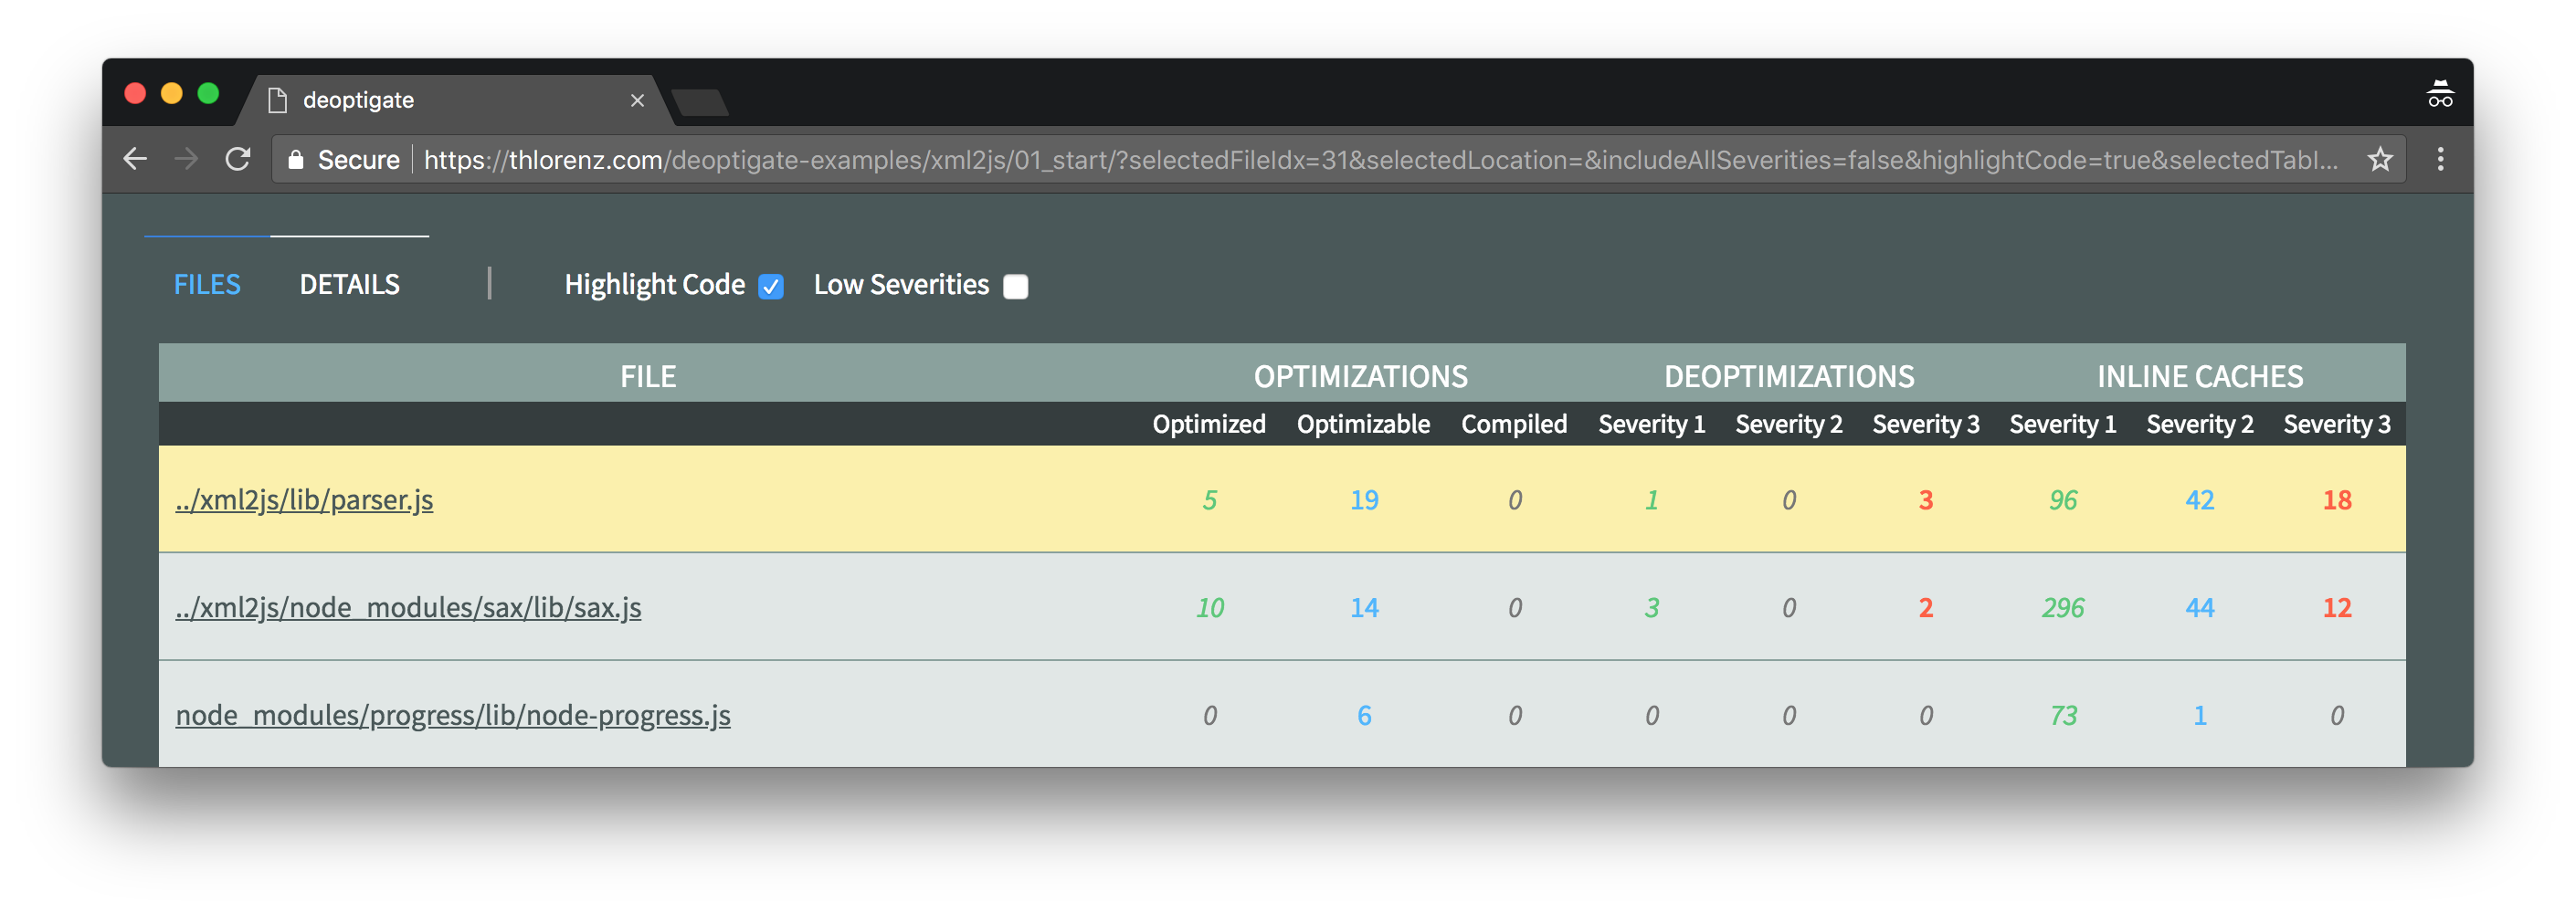
Three deoptimizations were found inside this file. Let's inspect them a little closer by clicking xml2js/lib/parser.js and then selecting the Deoptimizations tab on the right.
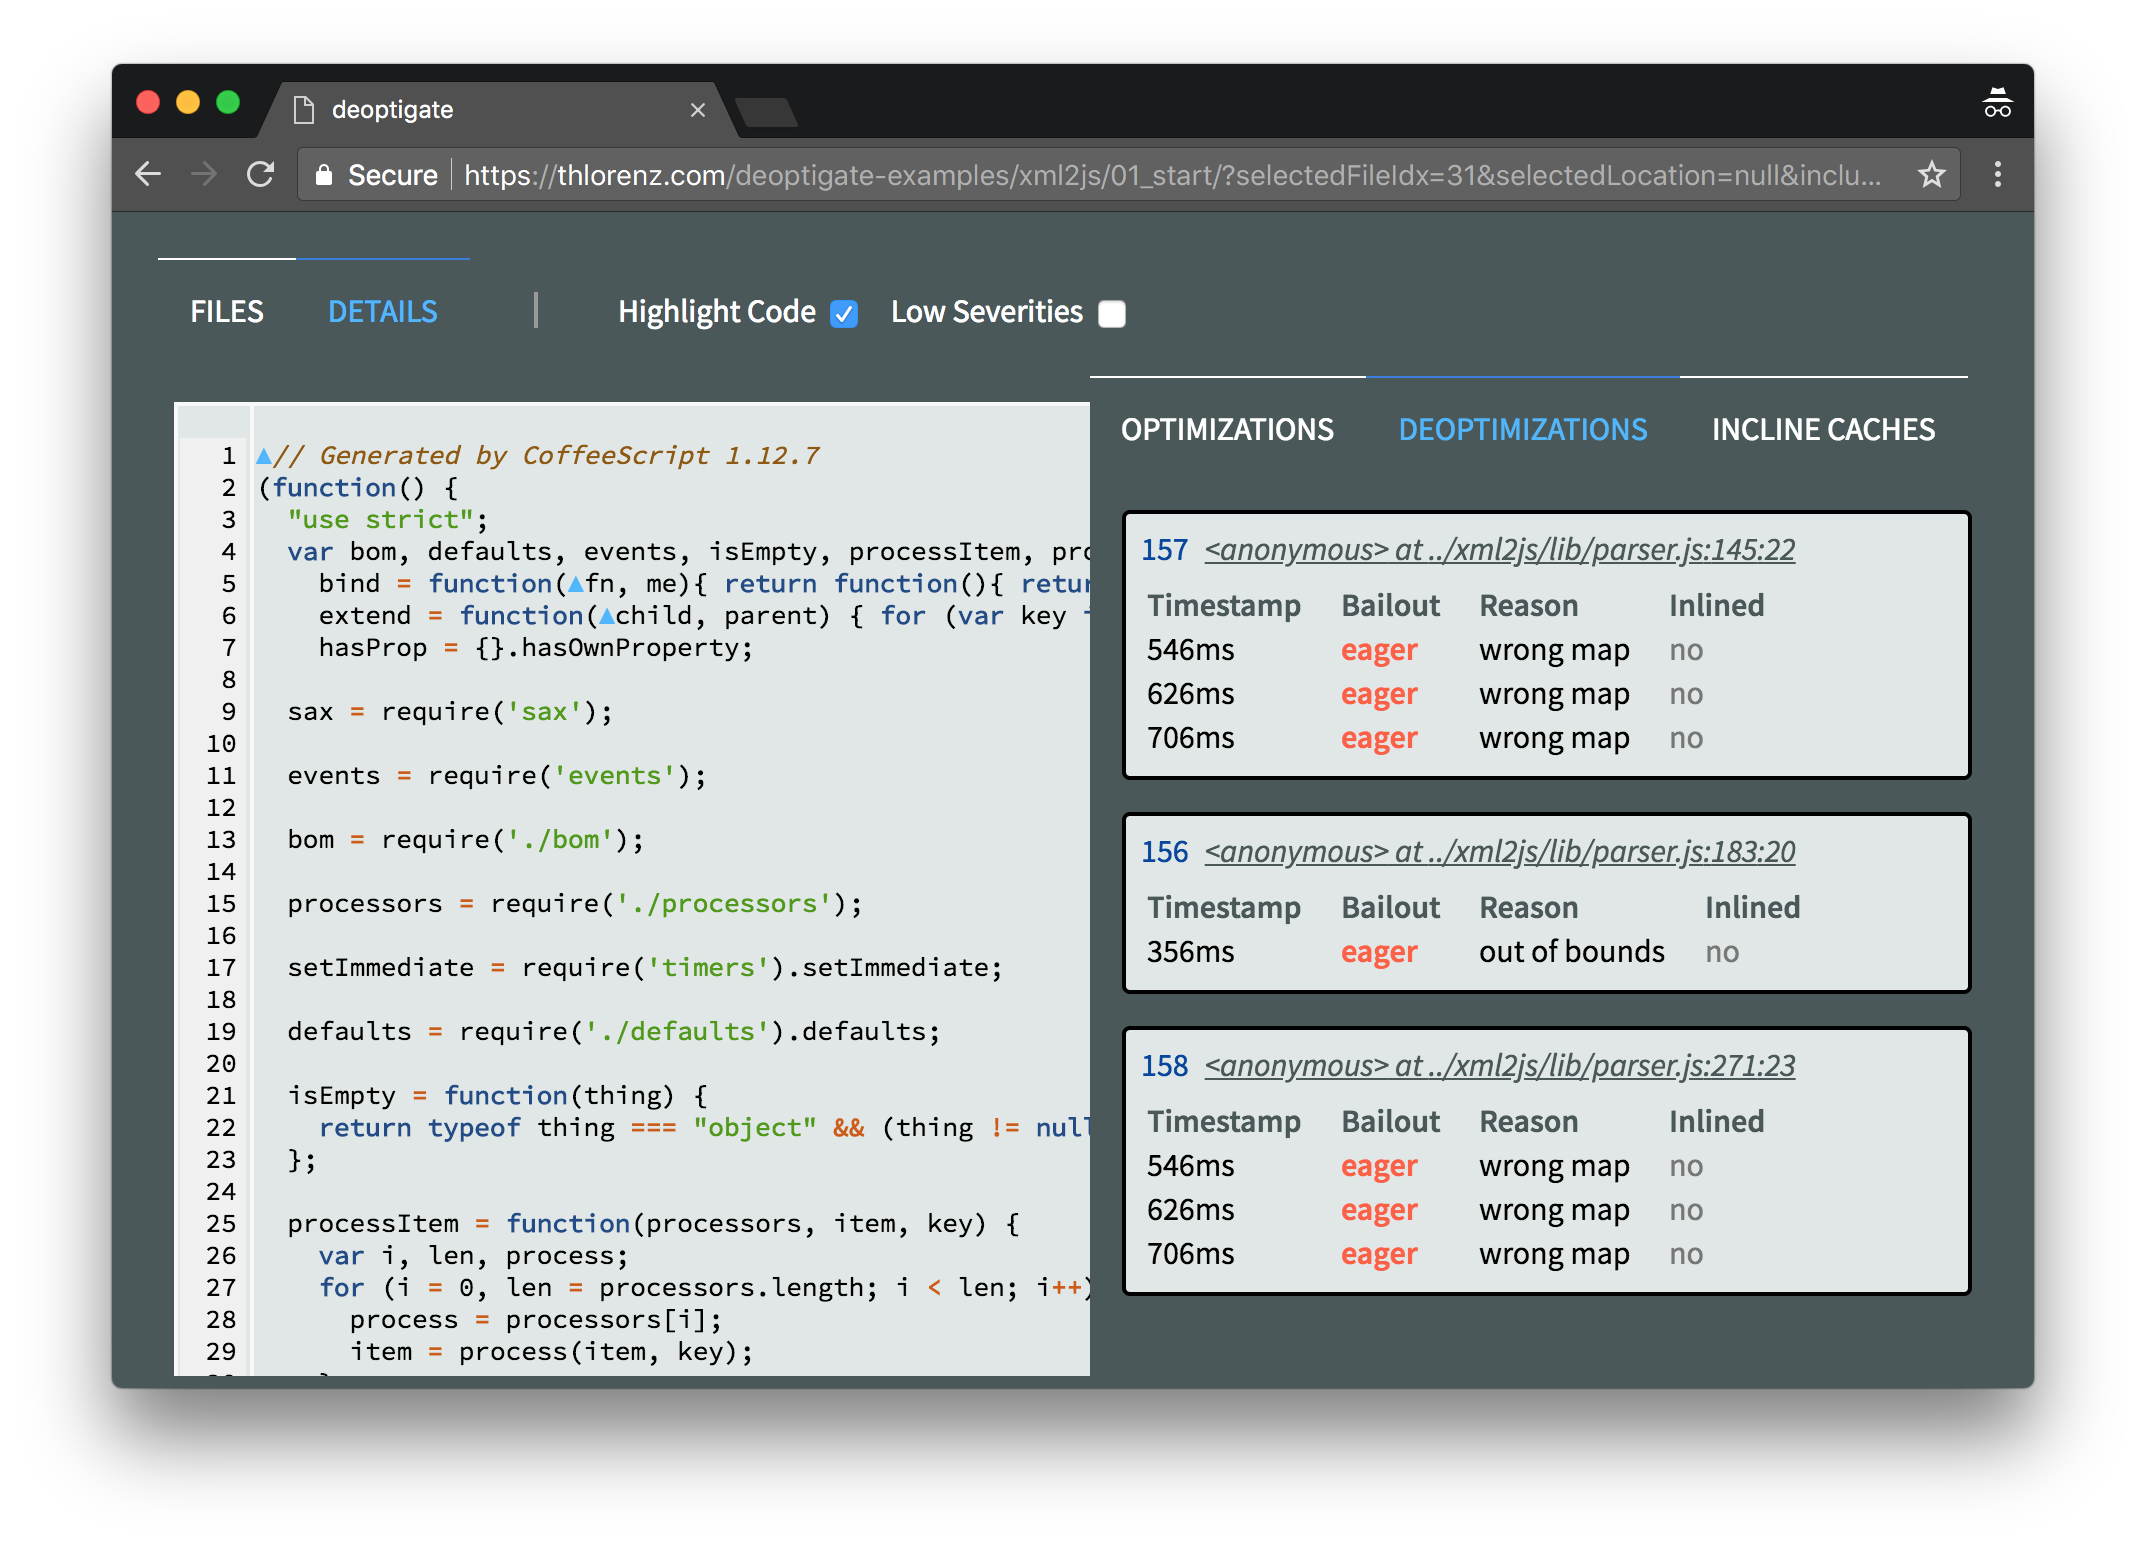
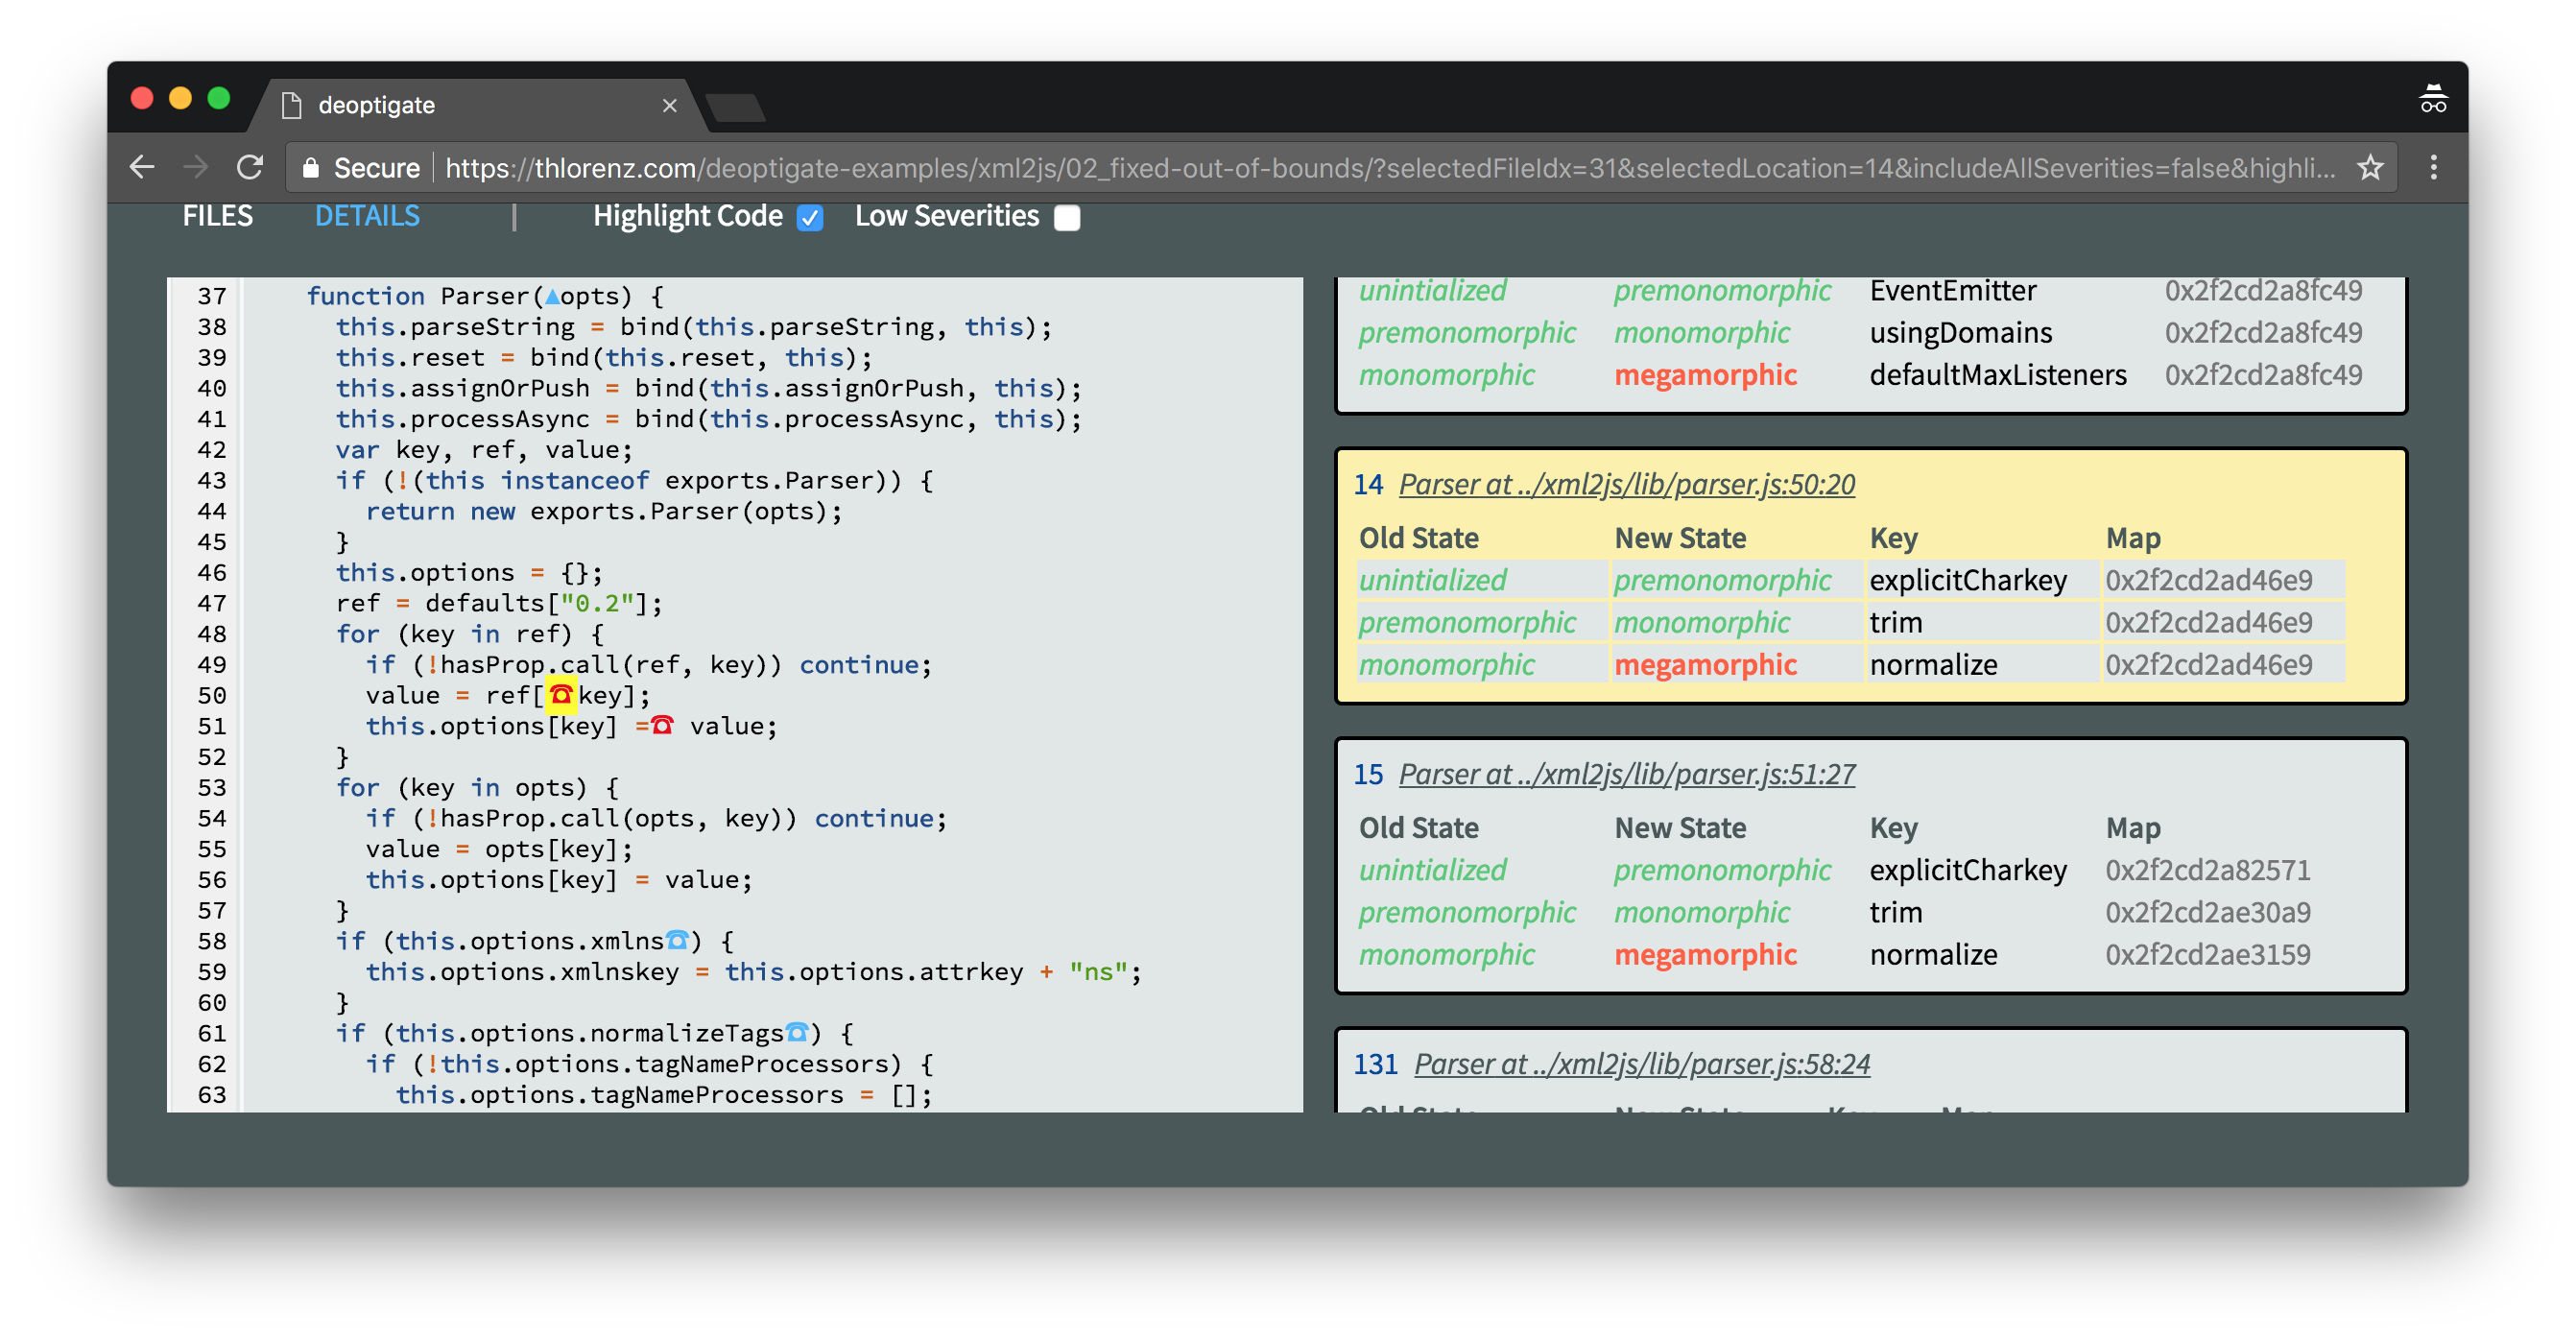
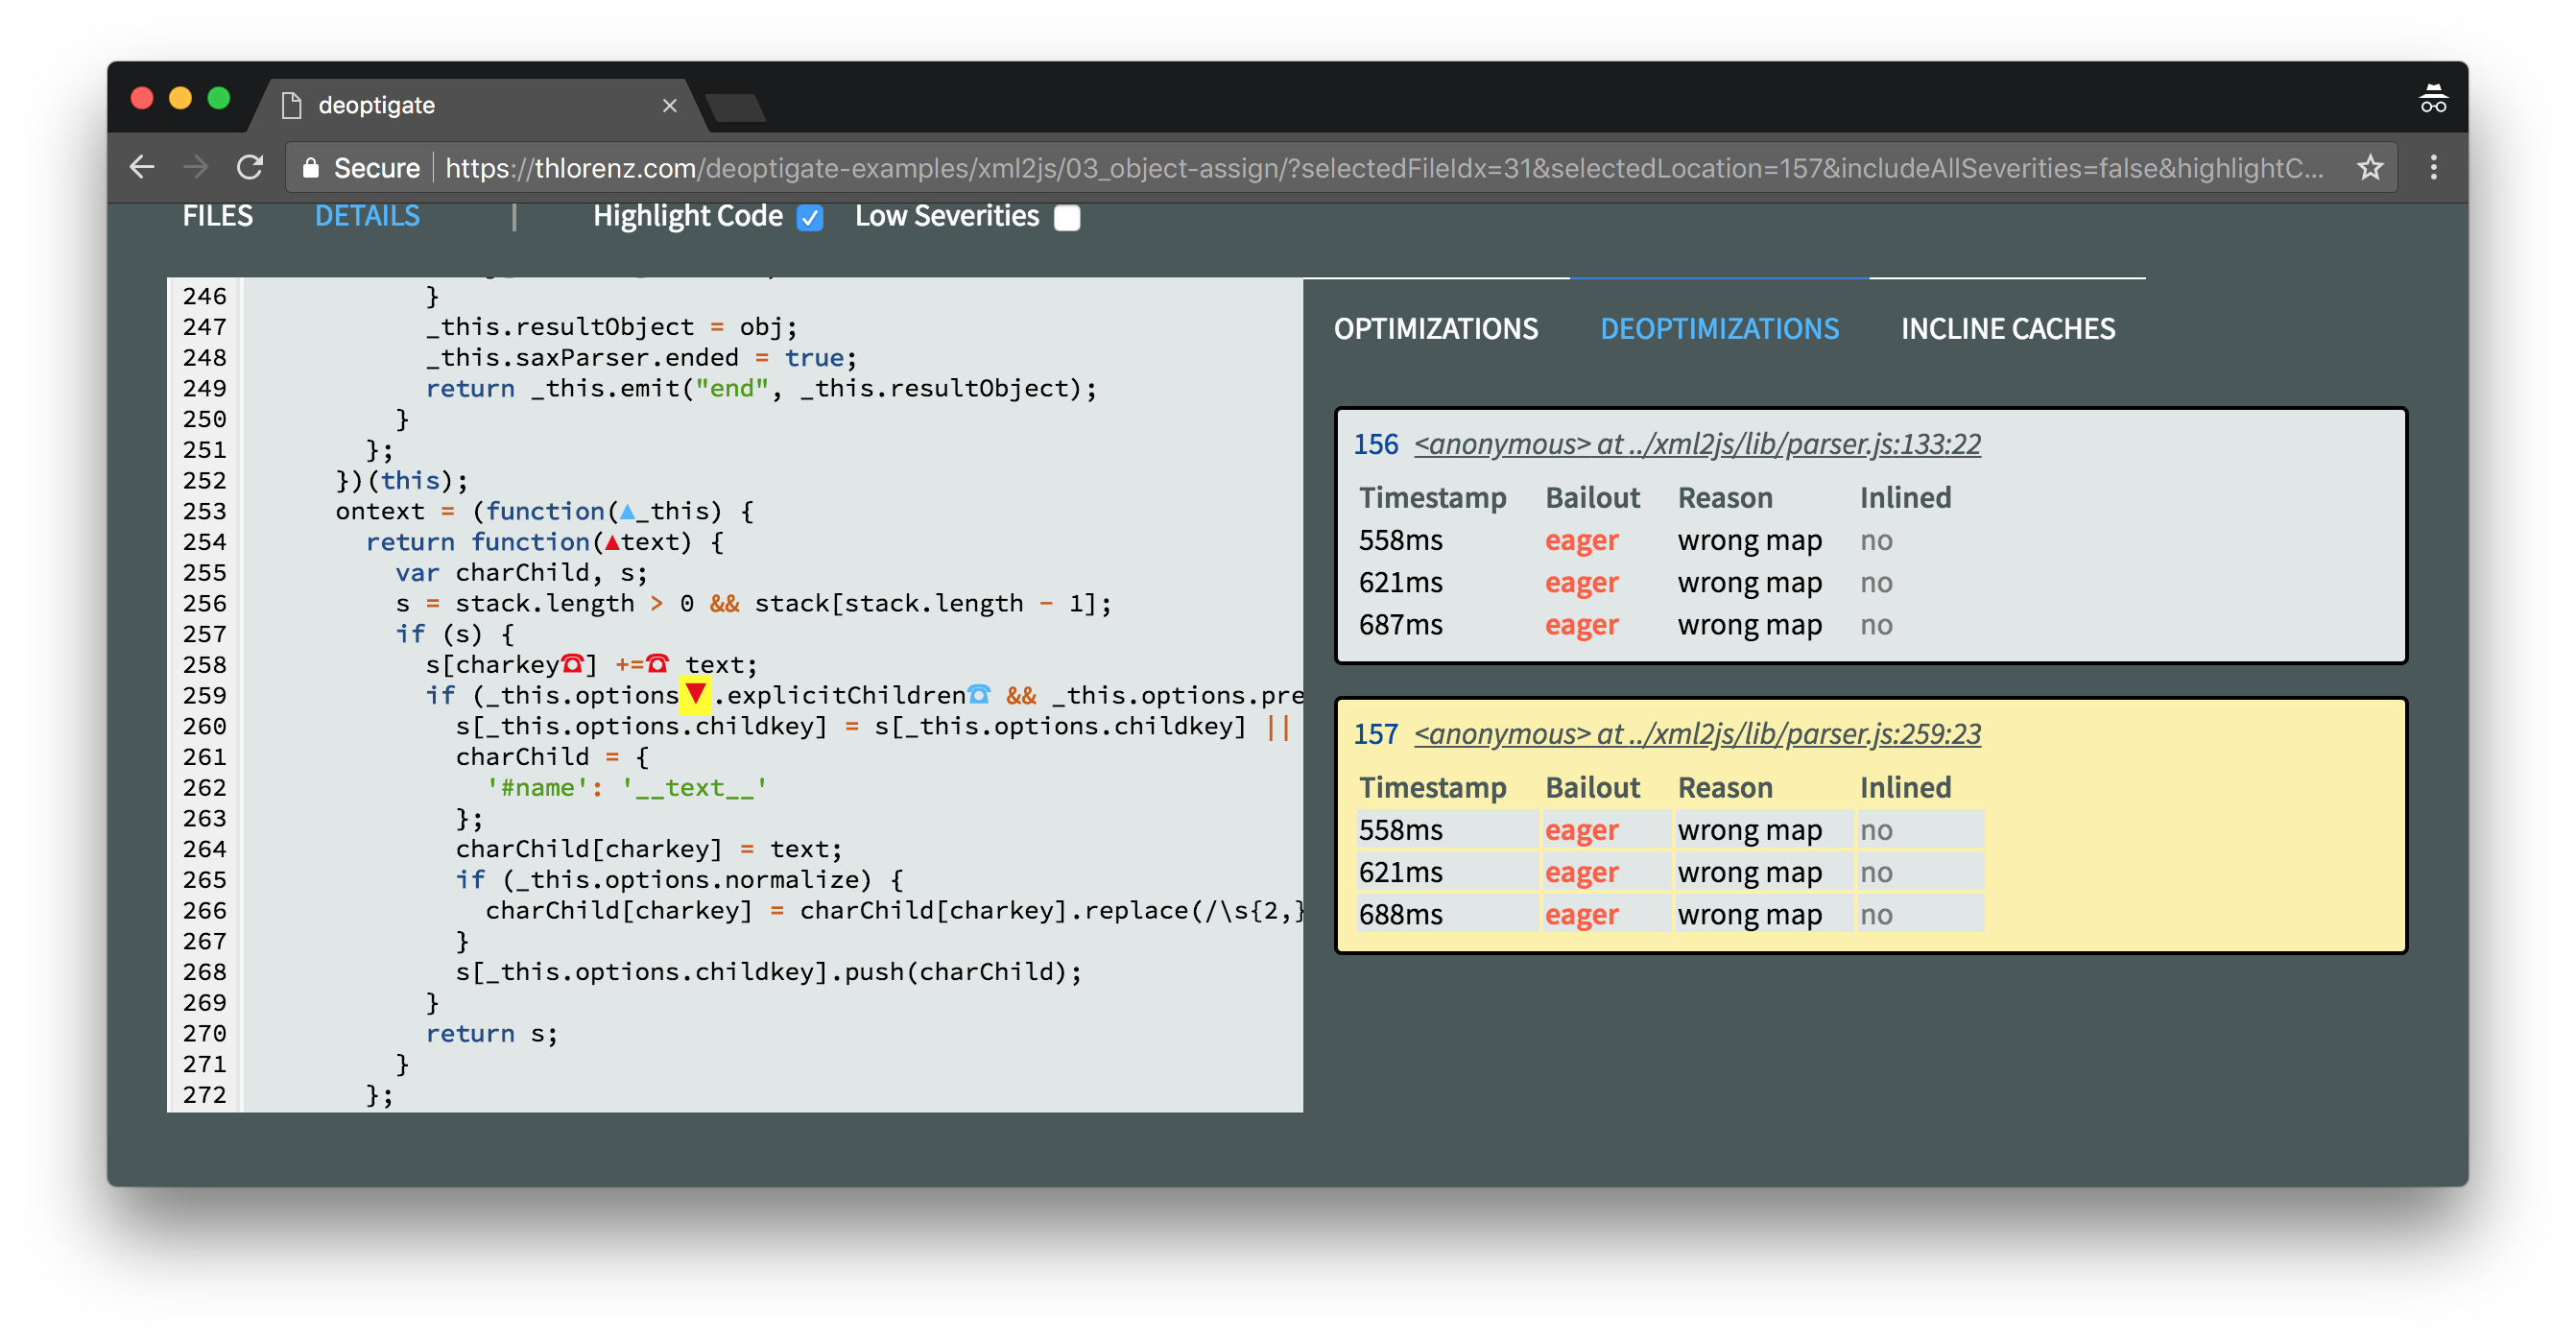
We see that two of the three deoptimizations are due to Map mismatches. Fixing those may involve more inspection, but the deoptimization due to out of bounds should be easy to fix.
Clicking this deoptimization on the right will scroll the relevant code into view on the left. It looks like we are accessing an element inside the stack array which is out of its bounds.
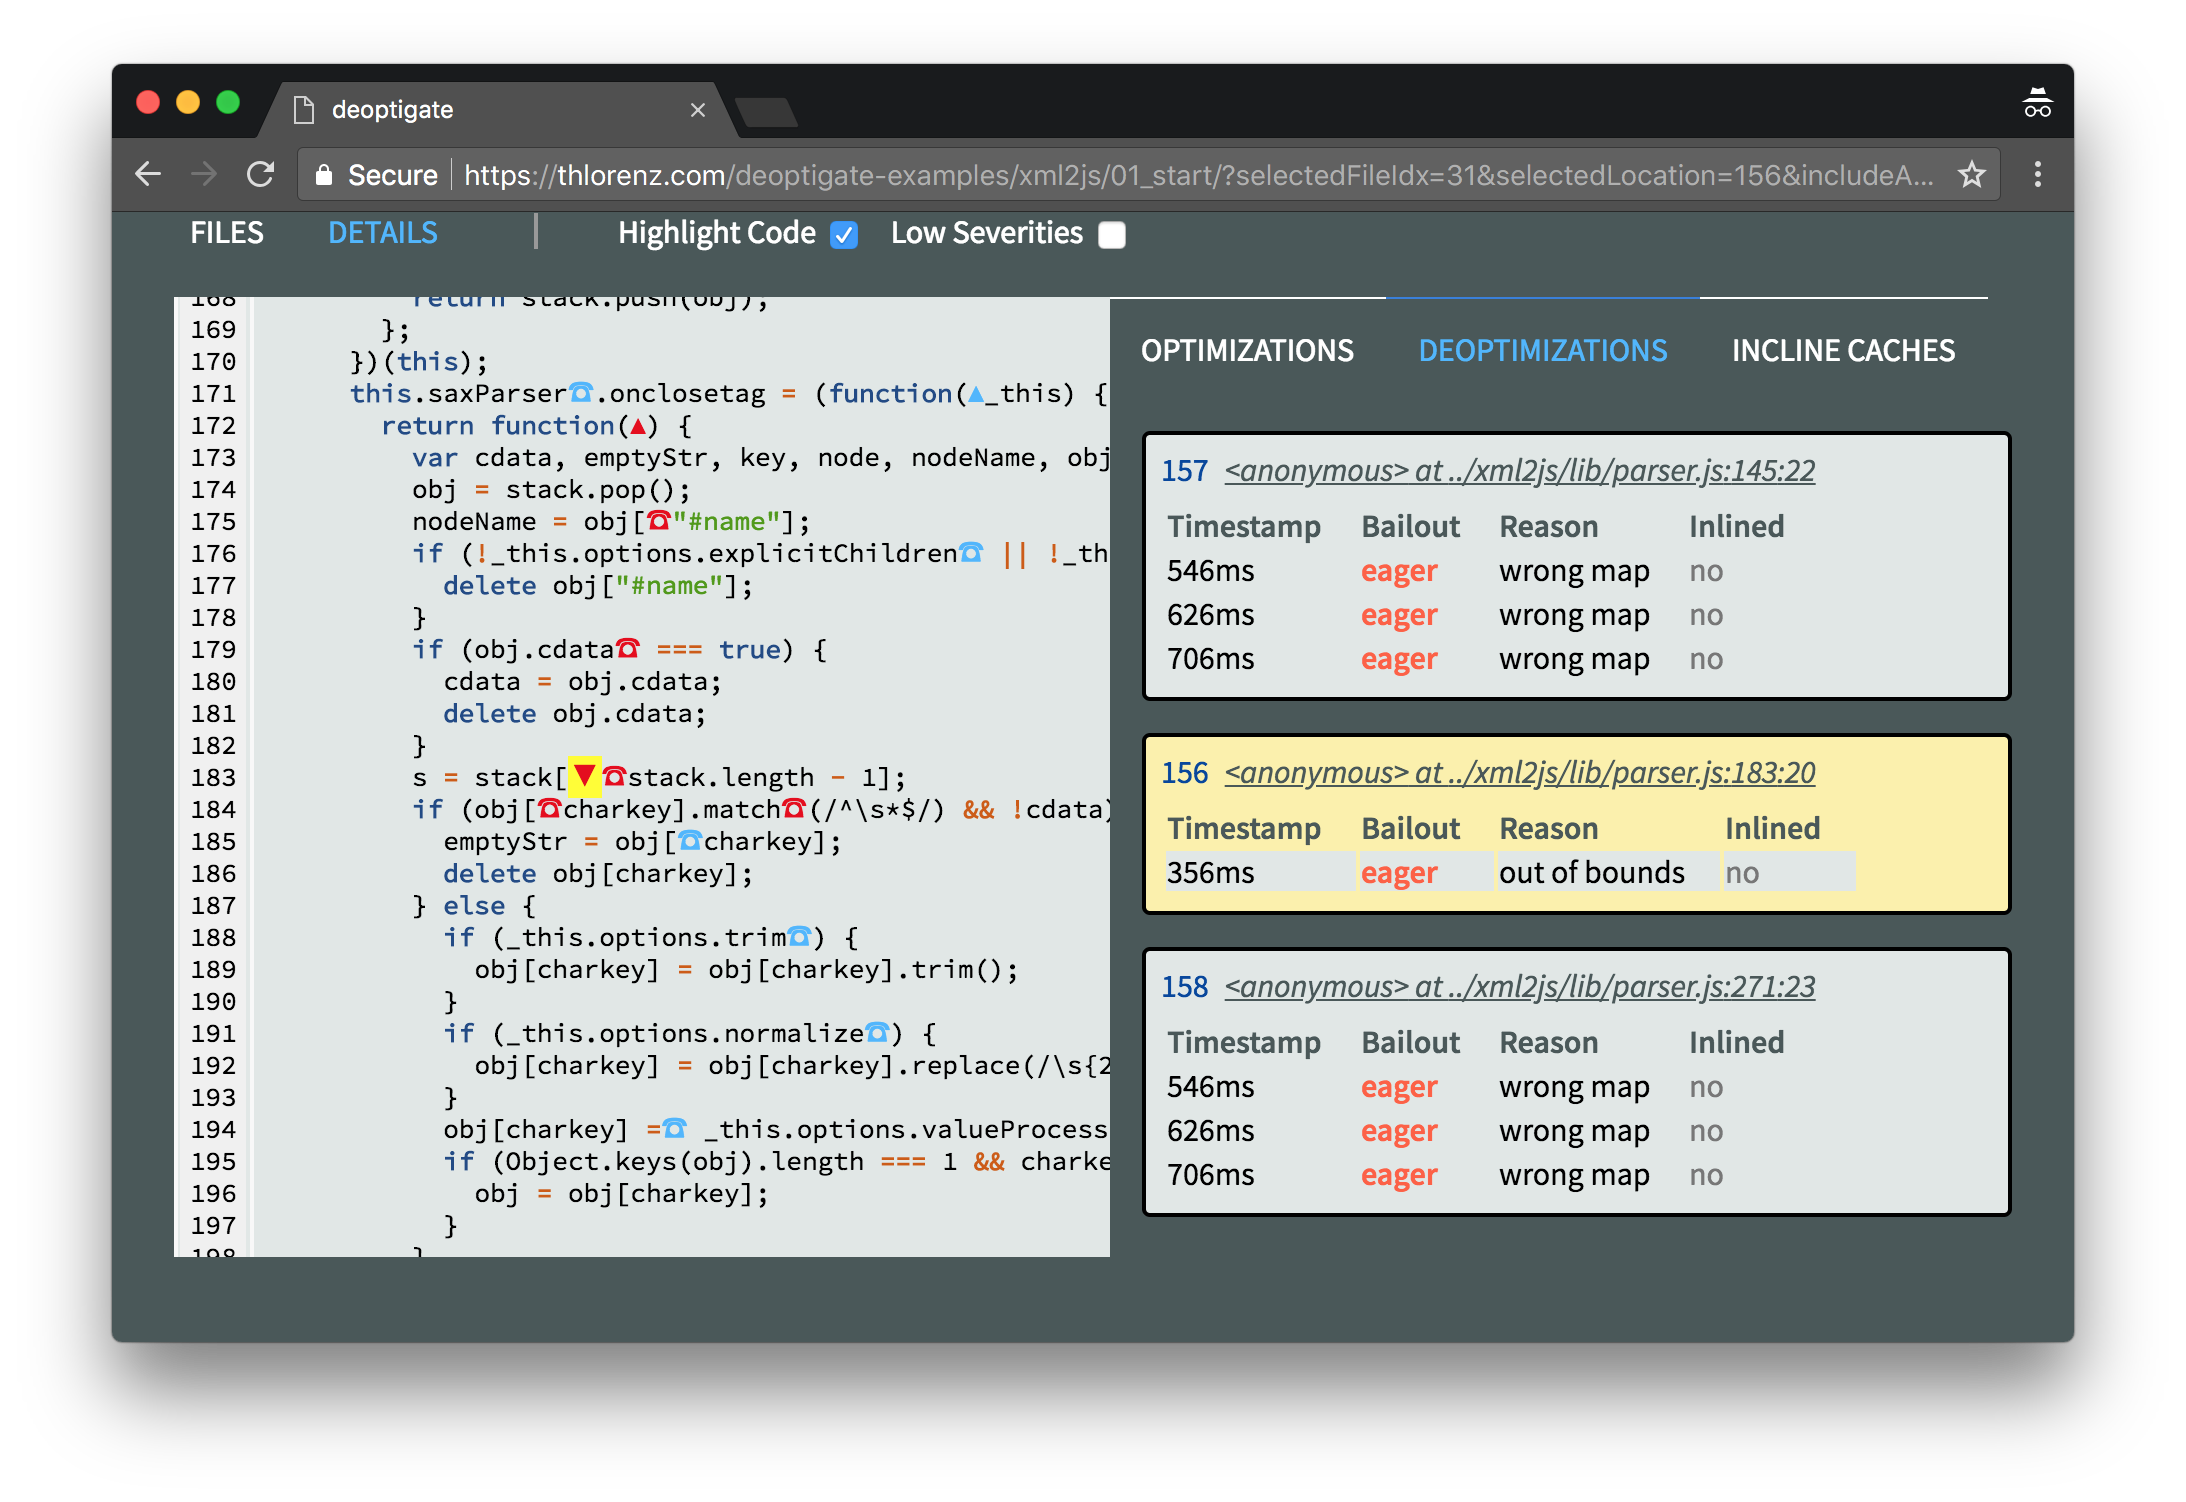
Clicking the red ☎ symbol right next to it will give us some more information of what went wrong here by displaying details about the related inline caches that were collected at this position.
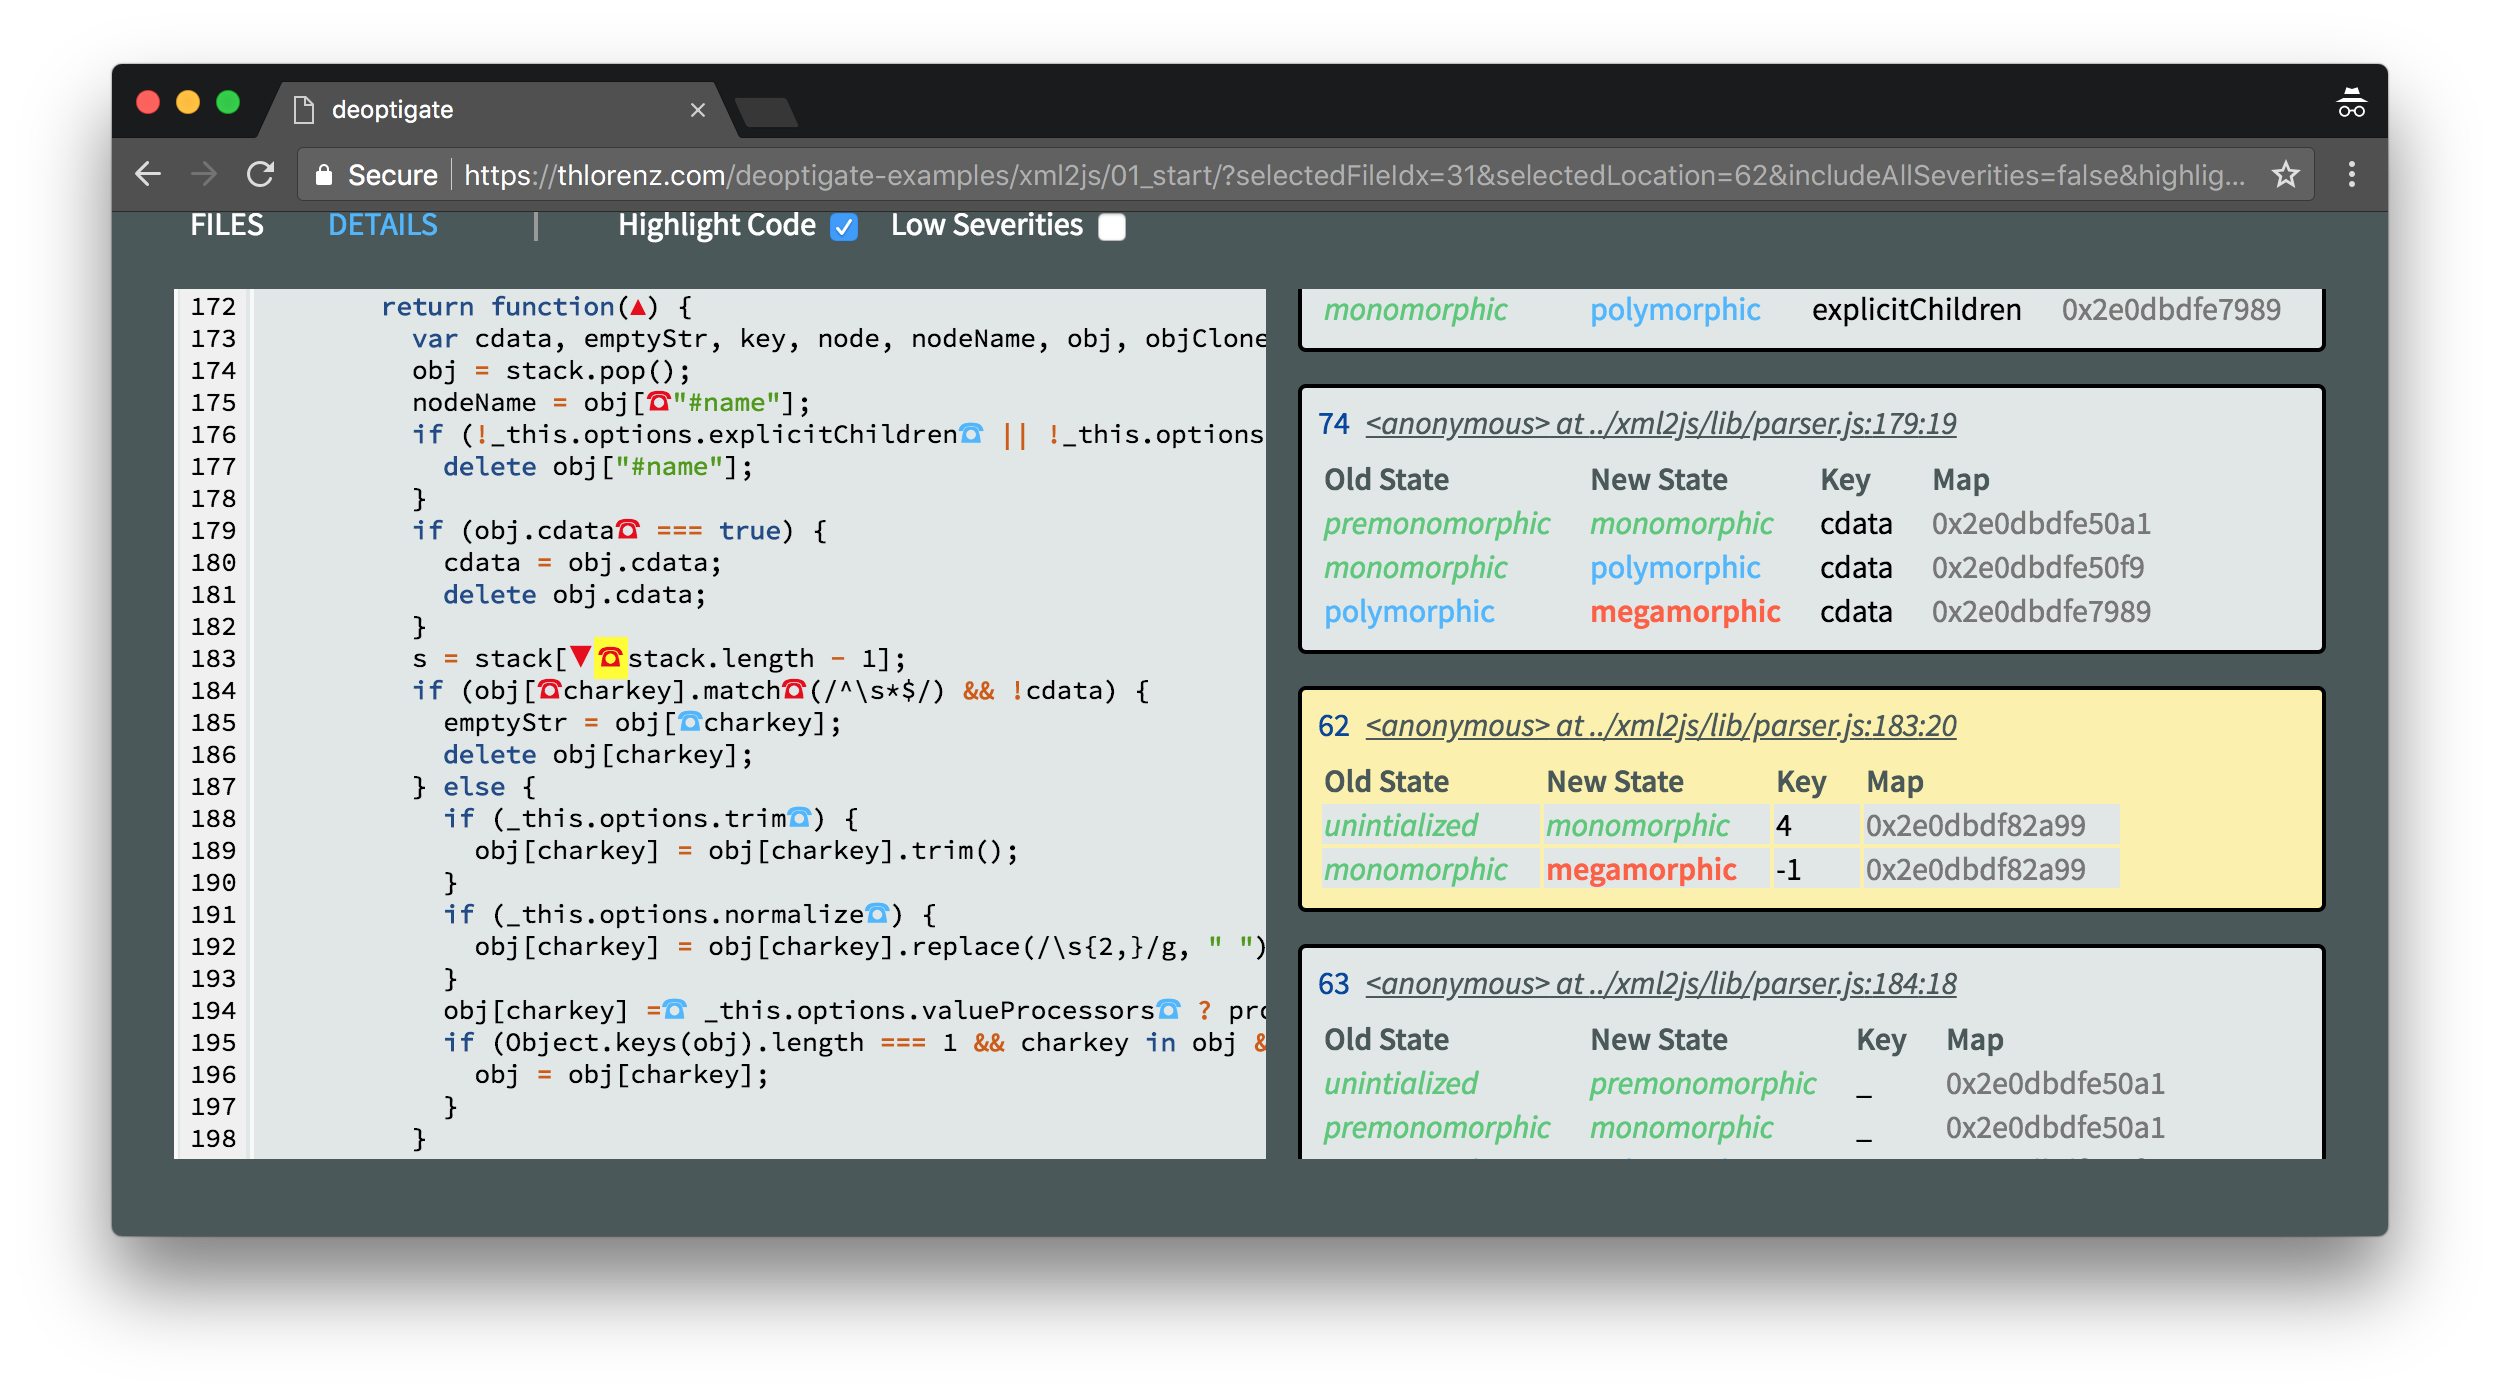
This reveals that an attempt was made to access an element in the stack at index -1 which caused the function to become megamorphic and get deoptimized. This happens to be the anonymous function assigned to onclosetag which we already identified as a potential bottleneck with N|Solid.
As this bug should be easy to resolve we will fix that first.
Small Change Big Difference
Here is the CoffeeScript code that this code was generated from.
s = stack[stack.length - 1]
The same code is found in the function assigned to ontext.
s = stack[stack.length - 1]
if s
Here the way this bug is covered up is a bit more obvious, as the string s is verified to be not null or undefined before execution continues. A similar check exists for the case just shown further above, but further down in the code.
To clarify, this code works fine as long as stack is a non-empty array, but when it is empty stack.length - 1 returns -1 and we then try to access an element at that index which causes the problem.
Obviously, this bug is easily fixed simply by adding a guard to avoid this out of bounds access.
Here's the diff I applied to both lines of code:
- s = stack[stack.length - 1]
+ s = stack.length > 0 and stack[stack.length - 1]
Let’s run deoptigate again and see if we see any improvements.
We can immediately see that we resolved one deoptimization and removed two critical function state changes recorded via inline caches.
We dig into the deoptimization details in order to verify that the out of bounds related deoptimization is no longer present.
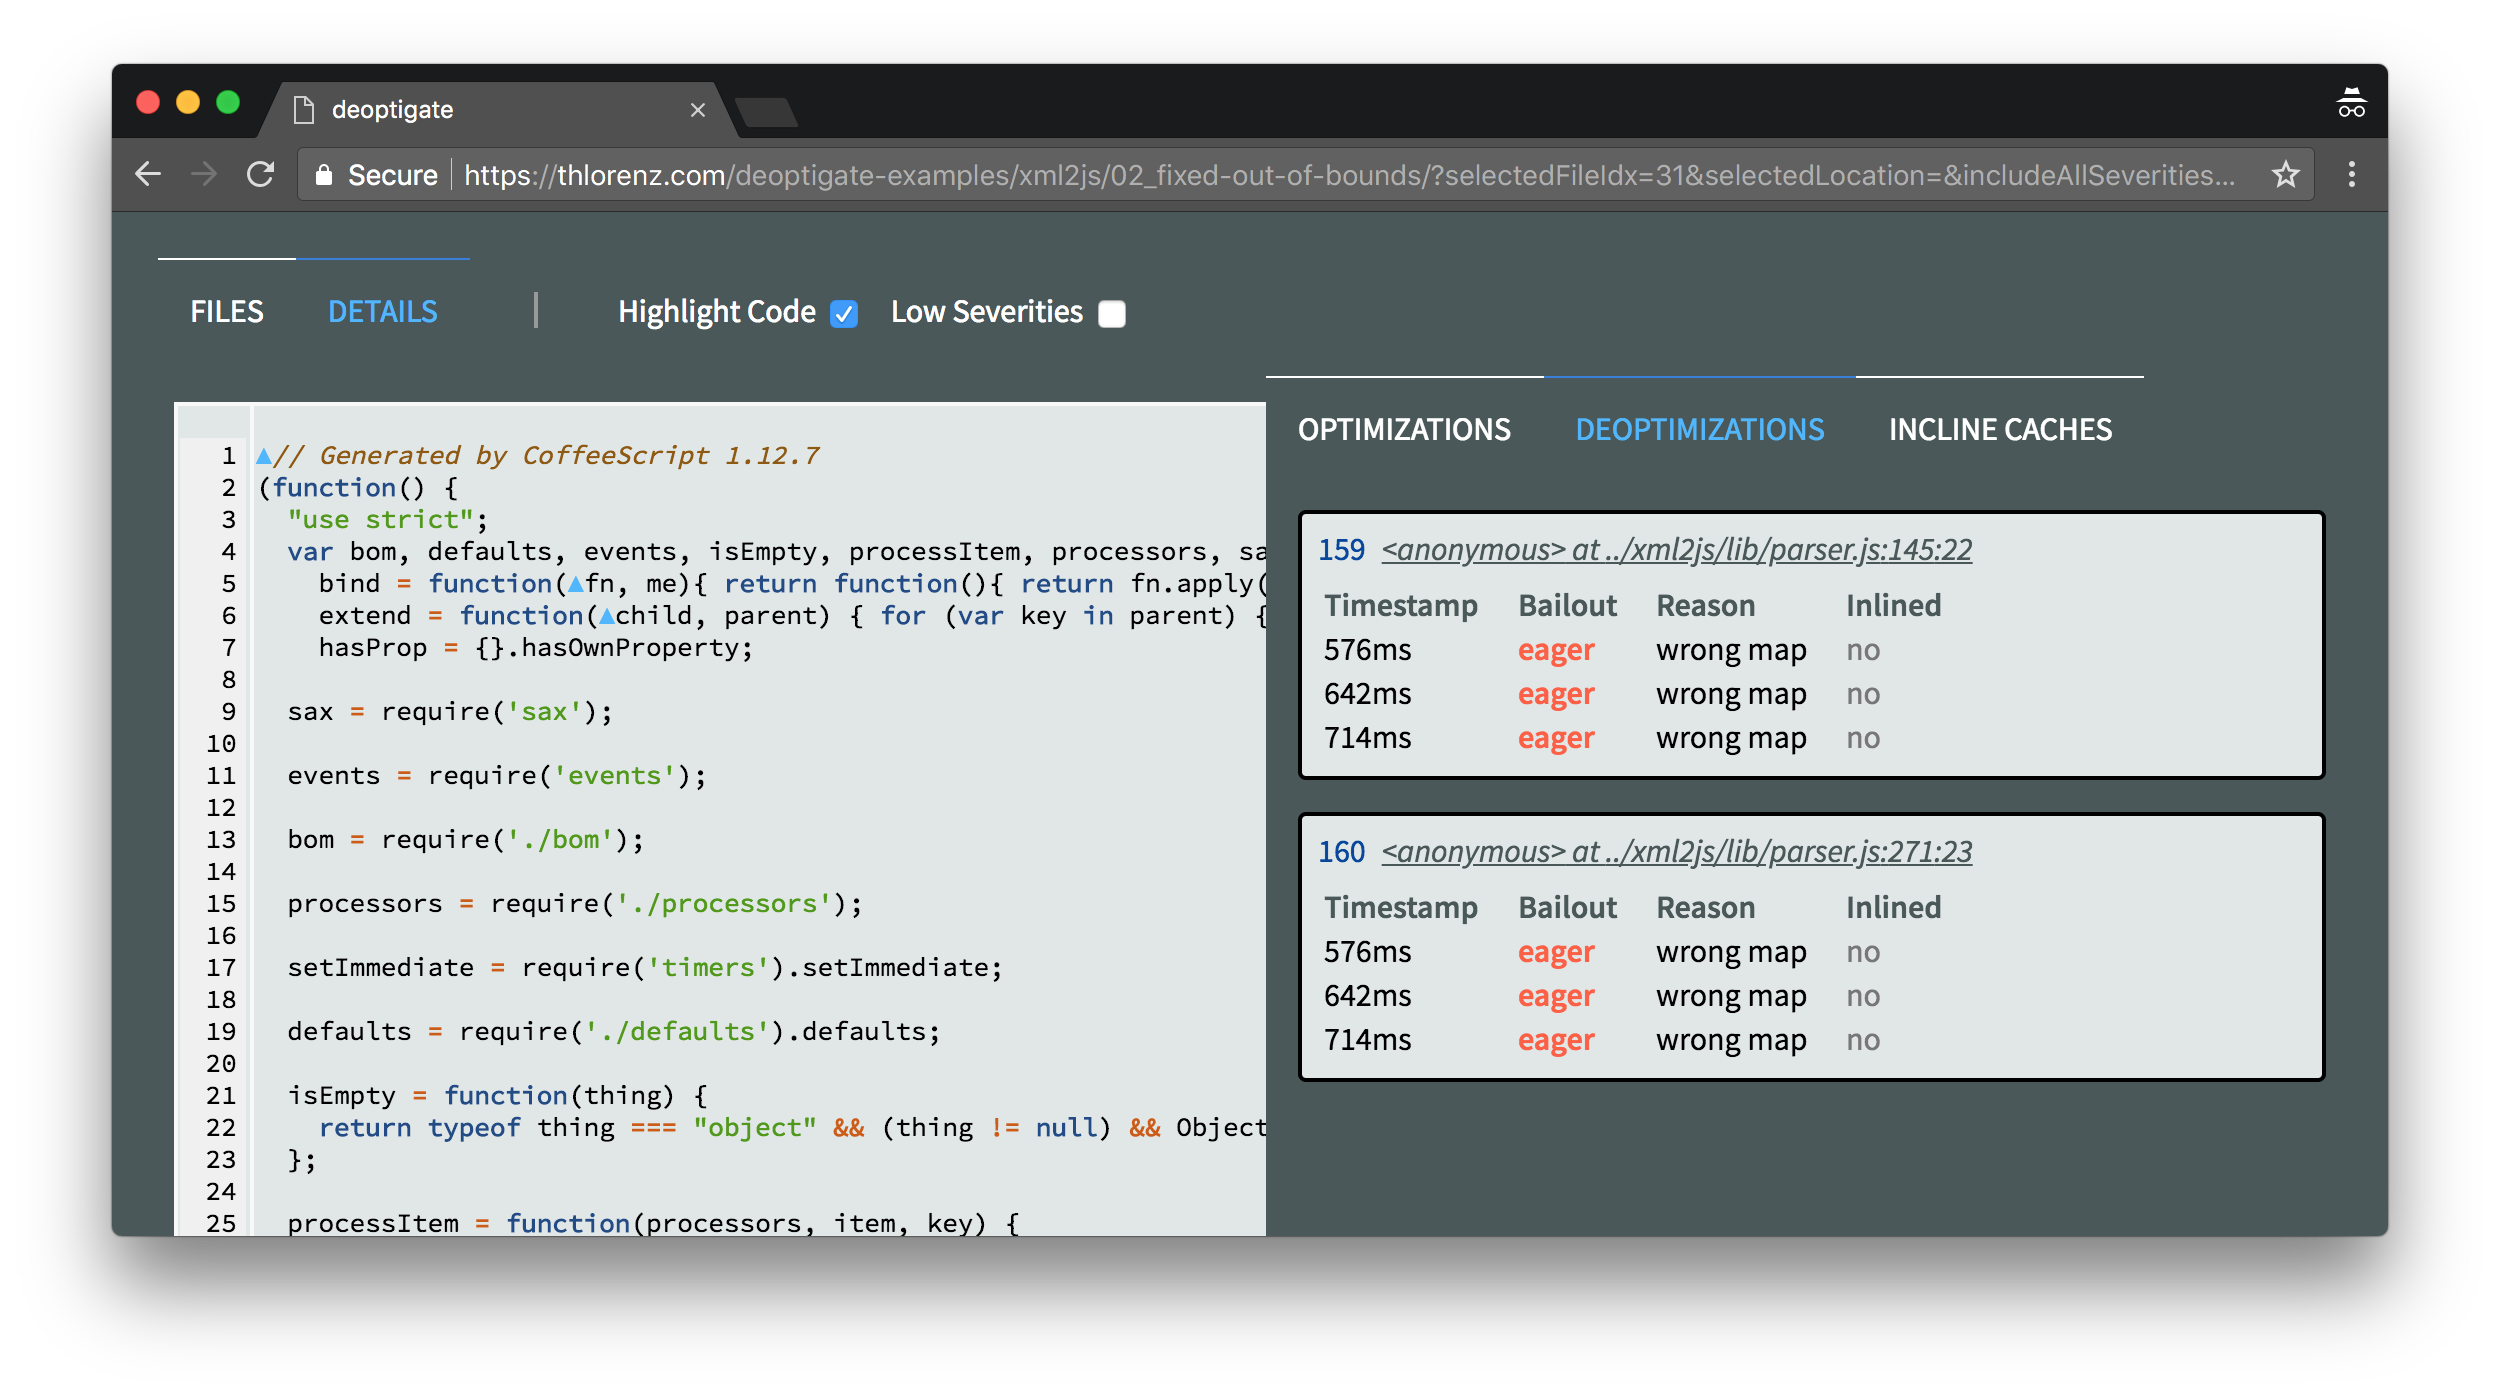
Thus even though this bug didn't cause any errors it did hurt the performance of the library.
In order to keep this post to a reasonable length, I won't show benchmarking results until the very end, but be advised that after every such change you should perform a benchmark in order to verify that it actually did affect the performance in the way you expect.
Built-in Functions to be Preferred
There is another part in the code that was bugging me, even though it didn't cause any deoptimizations.
Inside the constructor function there were two places which made it go megamorphic. This is never good as that means that either it will never be optimized or if it is, the code will be more complex and slower than code for polymorphic or monomorphic functions.
Let's have a look.
Here we are accessing dynamic properties on ref and this.options via bracket notation. In the case of this.options this also results in a Map change. These places in the code are the cause for the undesirable megamorphism. So I looked at the CoffeeScript code to find out what it is actually trying to accomplish.
# copy this versions default options
@options = {}
@options[key] = value for own key, value of defaults["0.2"]
# overwrite them with the specified options, if any
@options[key] = value for own key, value of opts
It is basically just copying all default options into the @options object and then overriding the ones that have been supplied via opts. As it turns out the latest JavaScript as a built-in function for that, Object.assign.
Therefore the entire block of the code above can be replaced with a one liner using that builtin.
Here's the diff I applied.
- @options = {}
- @options[key] = value for own key, value of defaults["0.2"]
- # overwrite them with the specified options, if any
- @options[key] = value for own key, value of opts
+ @options = Object.assign({}, defaults["0.2"], opts)
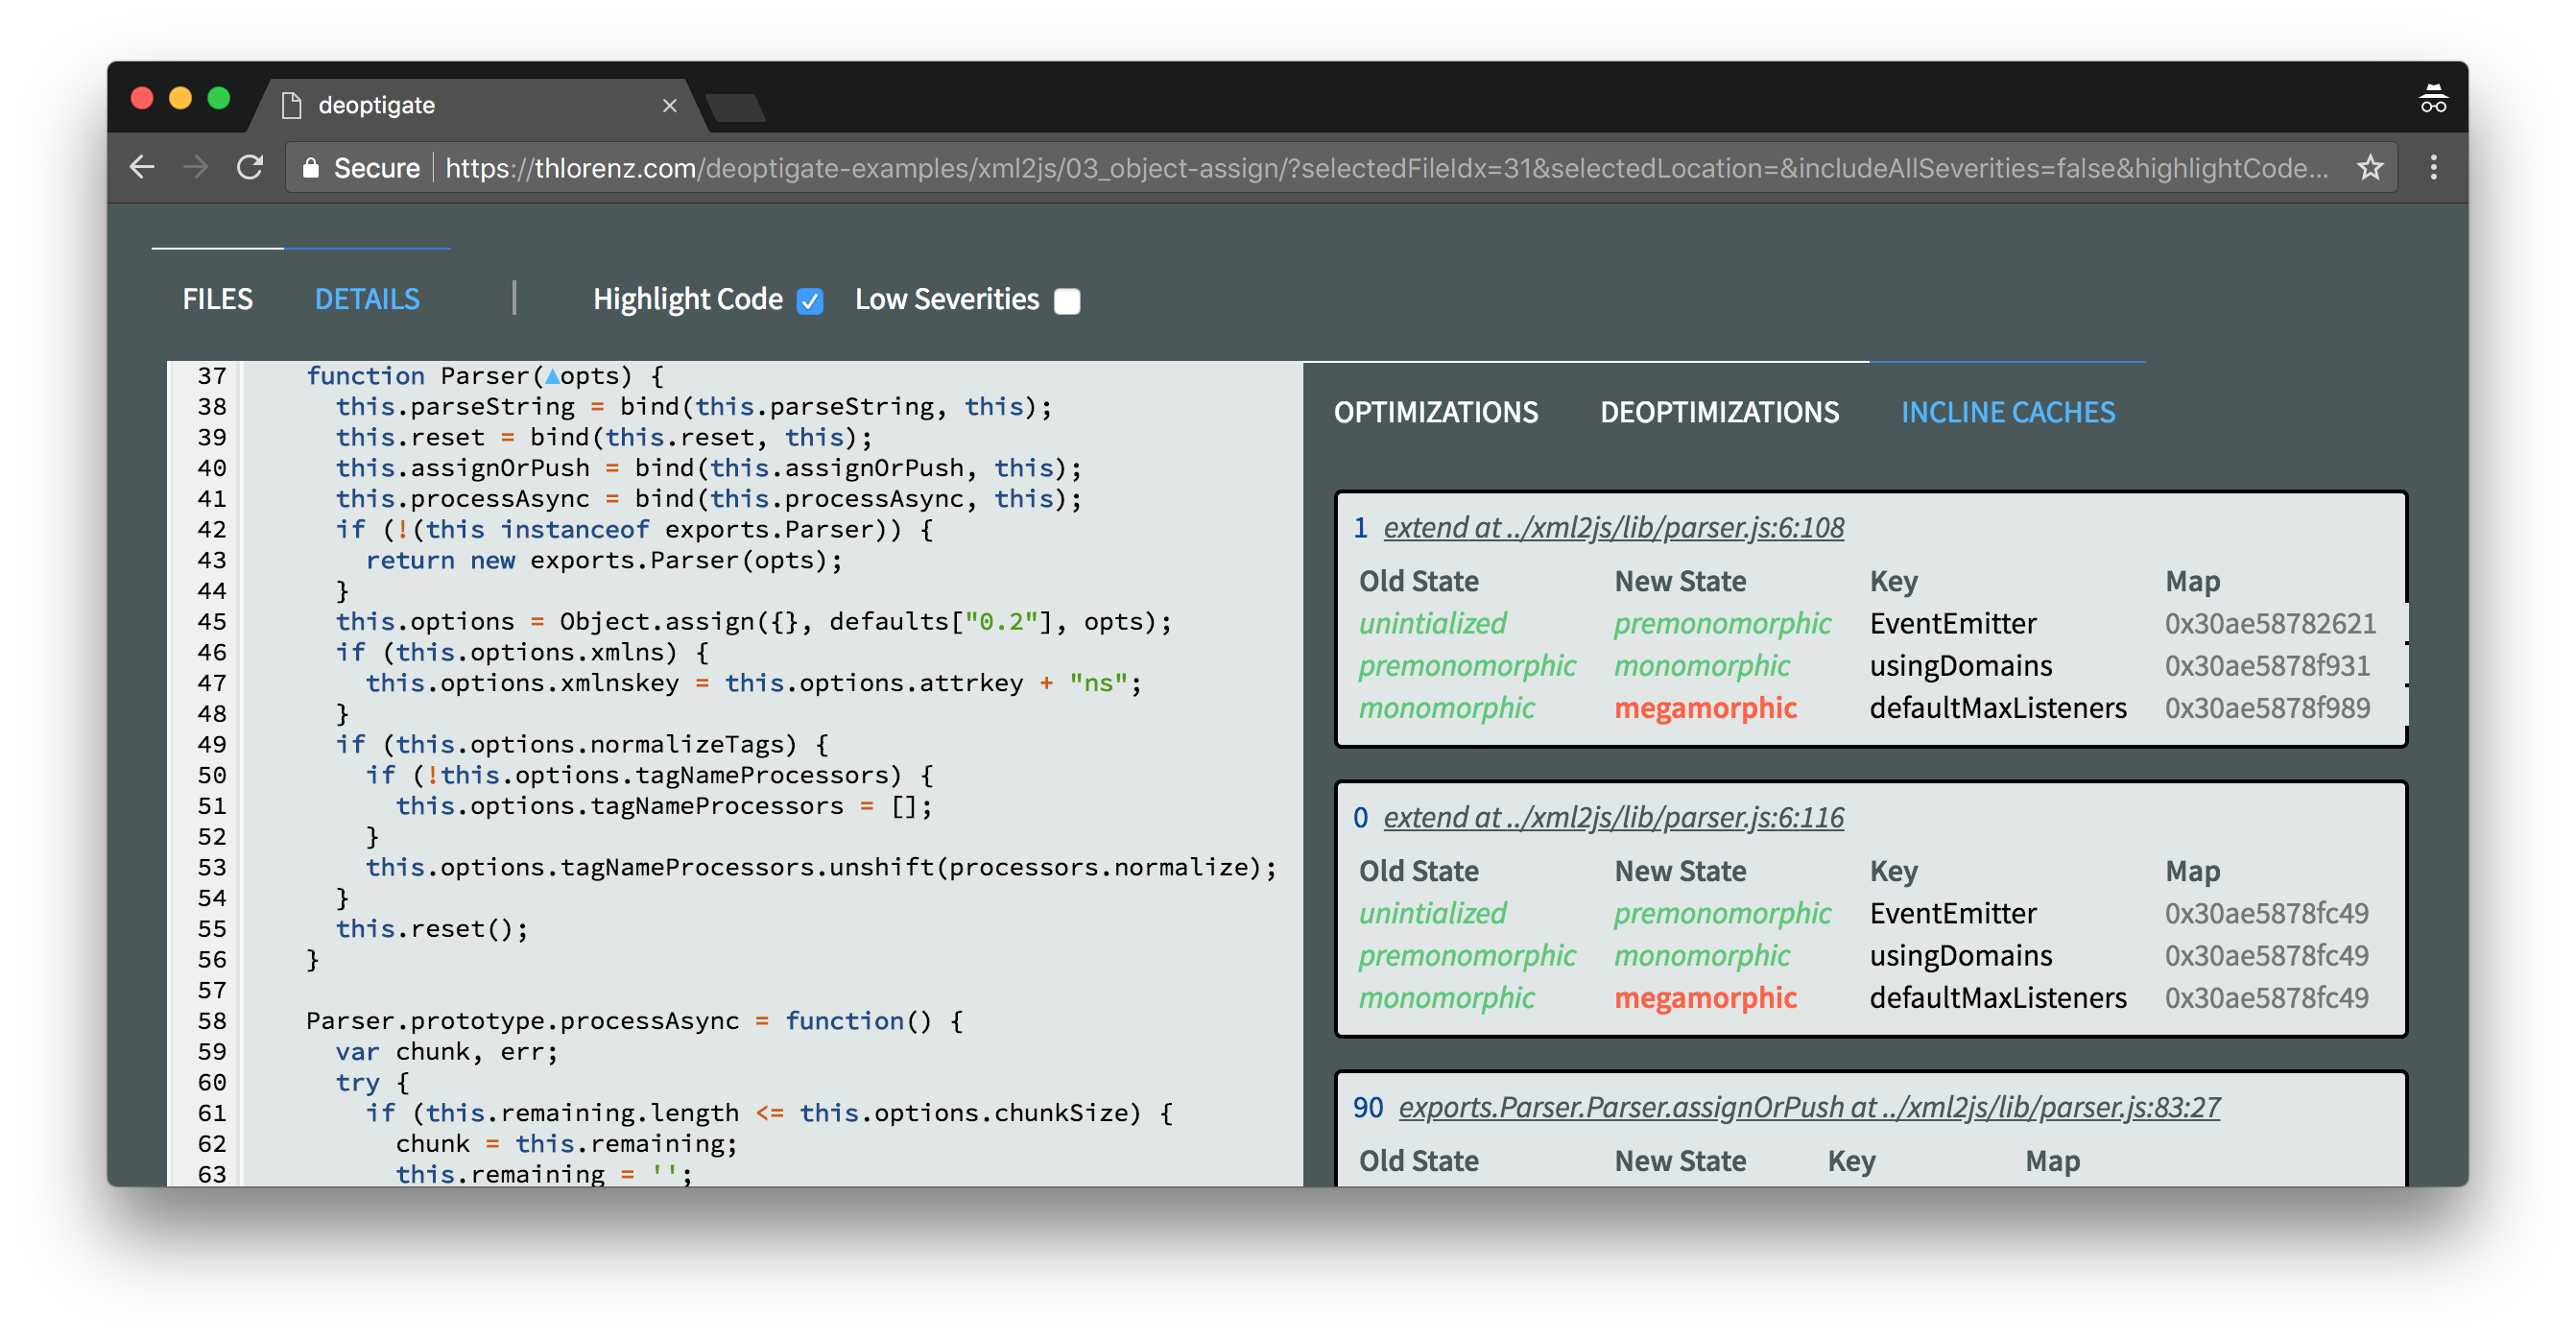
This simple change resulted in two critical function state changes (inline caches) to be fixed as well as four semi critical ones. It also caused the parser.js to drop to position two of files with most potential issues.
Navigating to the Parser constructor we learn that all its critical function state changes have been fixed.
CoffeScript putting us in a Bind
OK great job, but what about those remaining two deoptimizations, are we going to punt on those? After all they are also two of the functions that we identified with N|Solid as taking a lot of time, onopentag and ontext.
Of course we won't punt on them! I just left them for last as they were most tricky and thus most fun to fix.
Both of these remaining deoptimizations are caused when we access this.options due to wrong map.
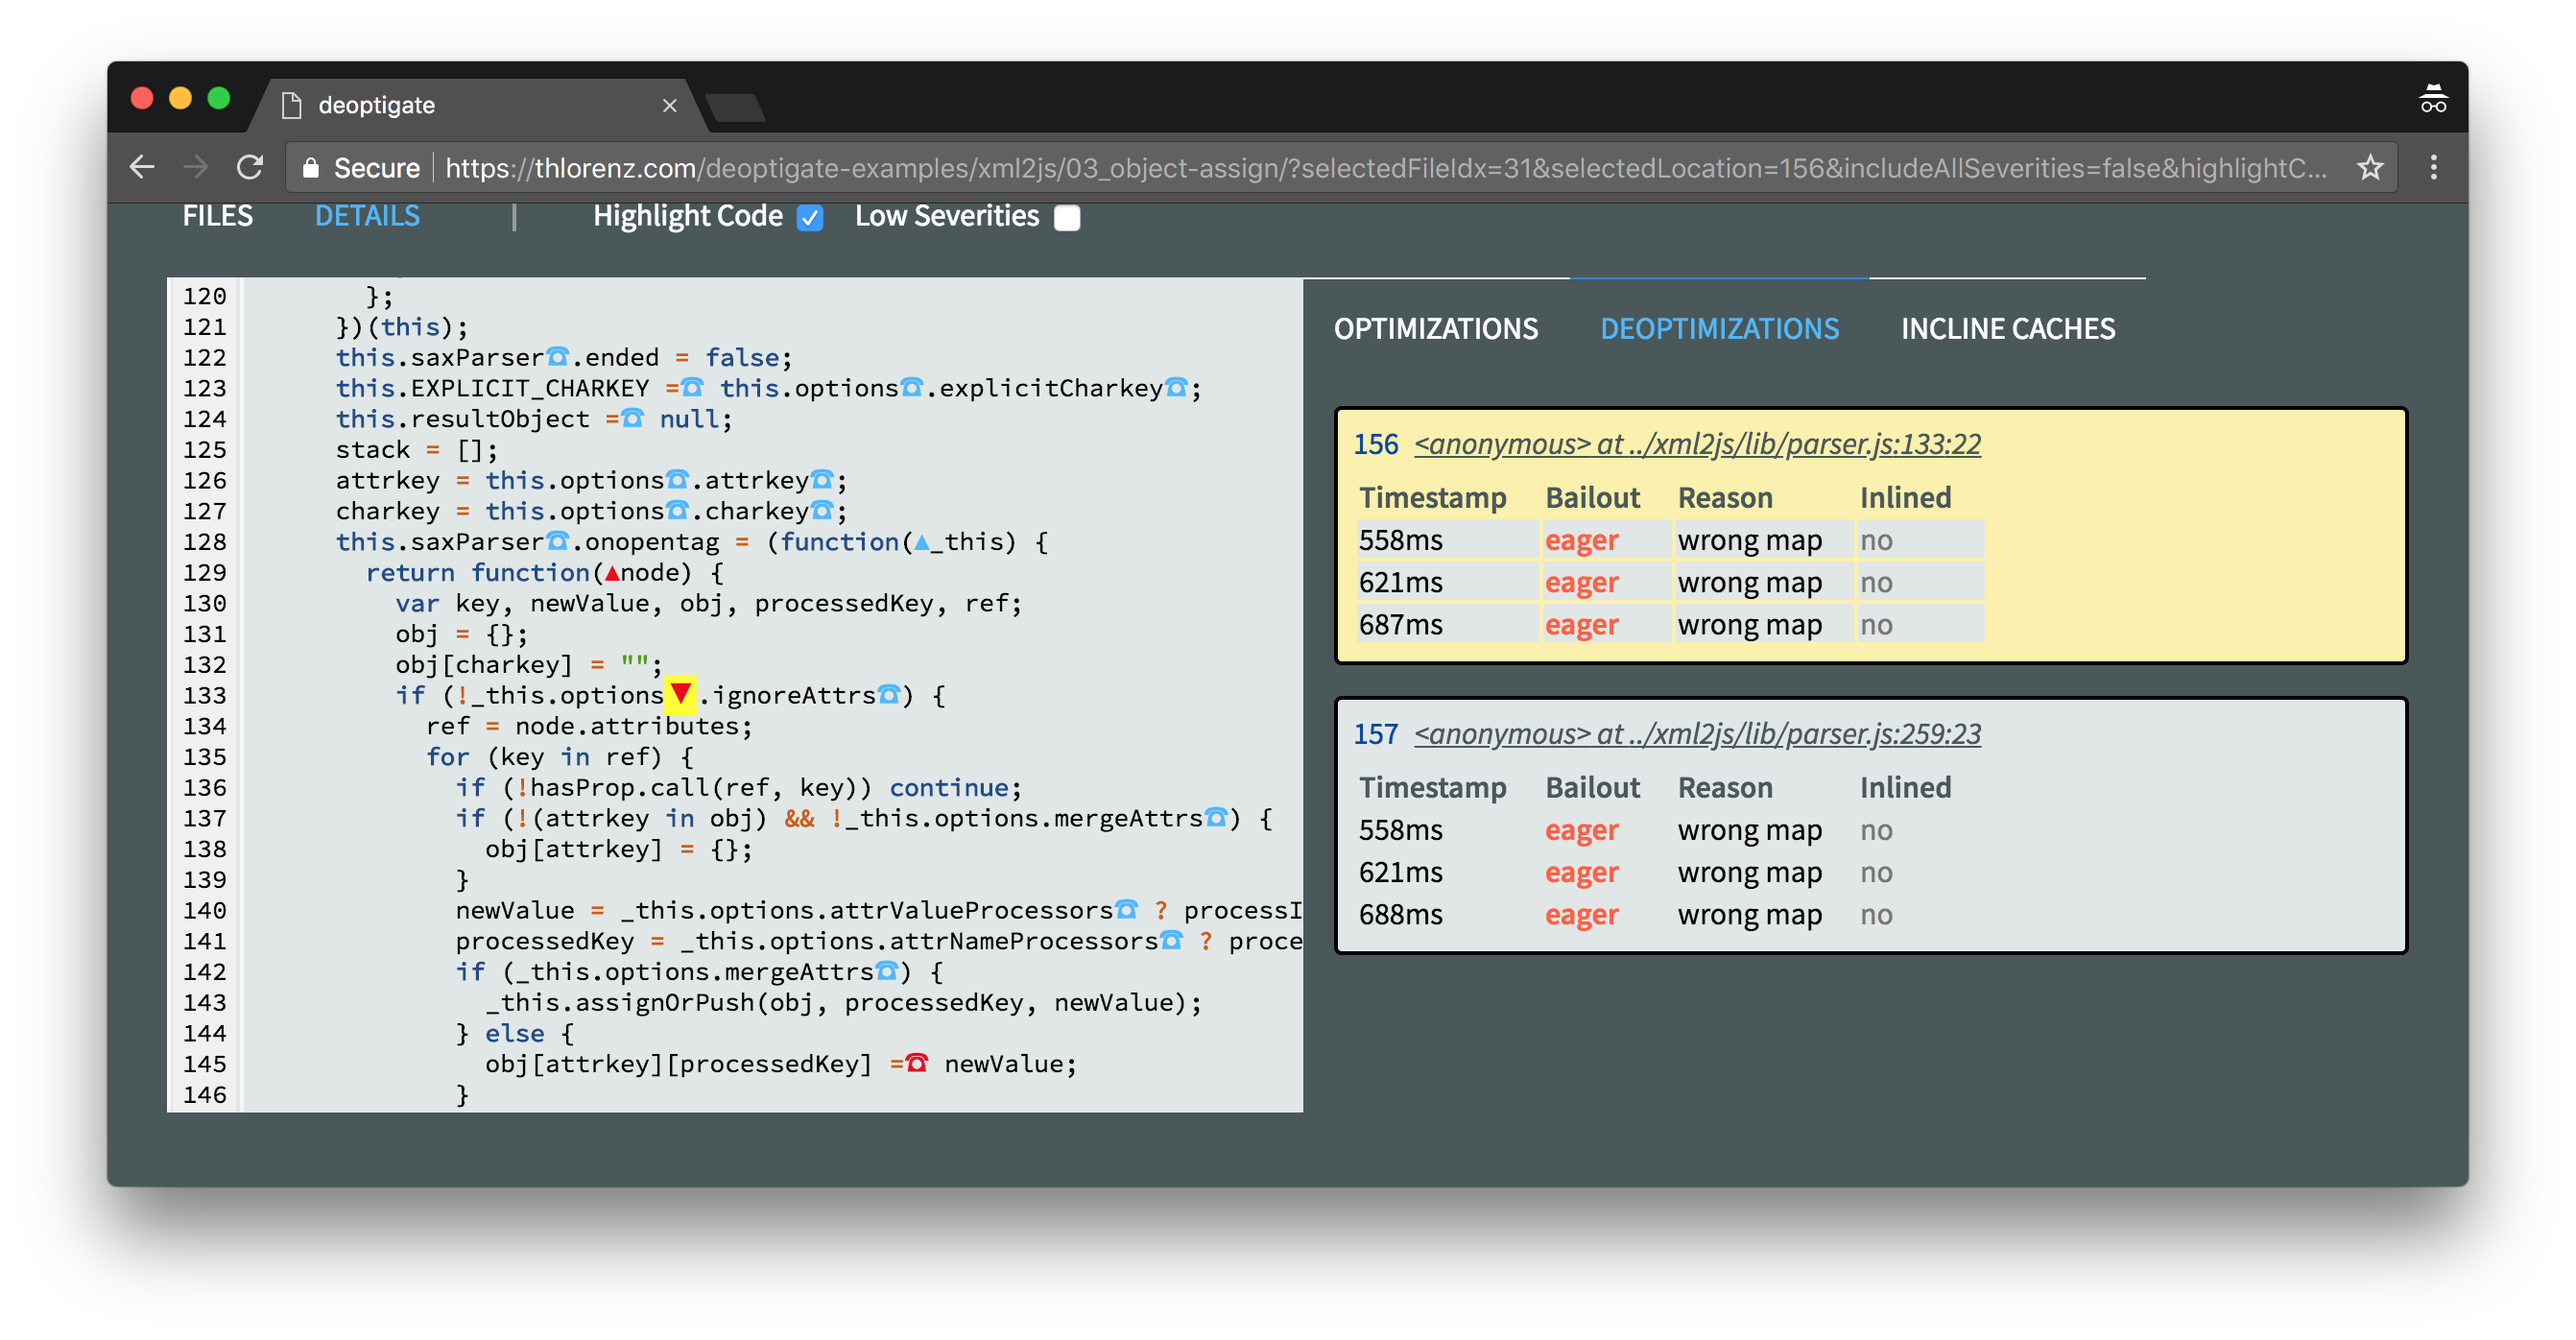
It is important to point out that it is not the options object that has the wrong Map here, but the this instance when we access options.
This is confirmed when we select any critical IC marker where a property on this is accessed.
In this case we inspect the access to the removeAllListeners function. Do you see all the Map changes?
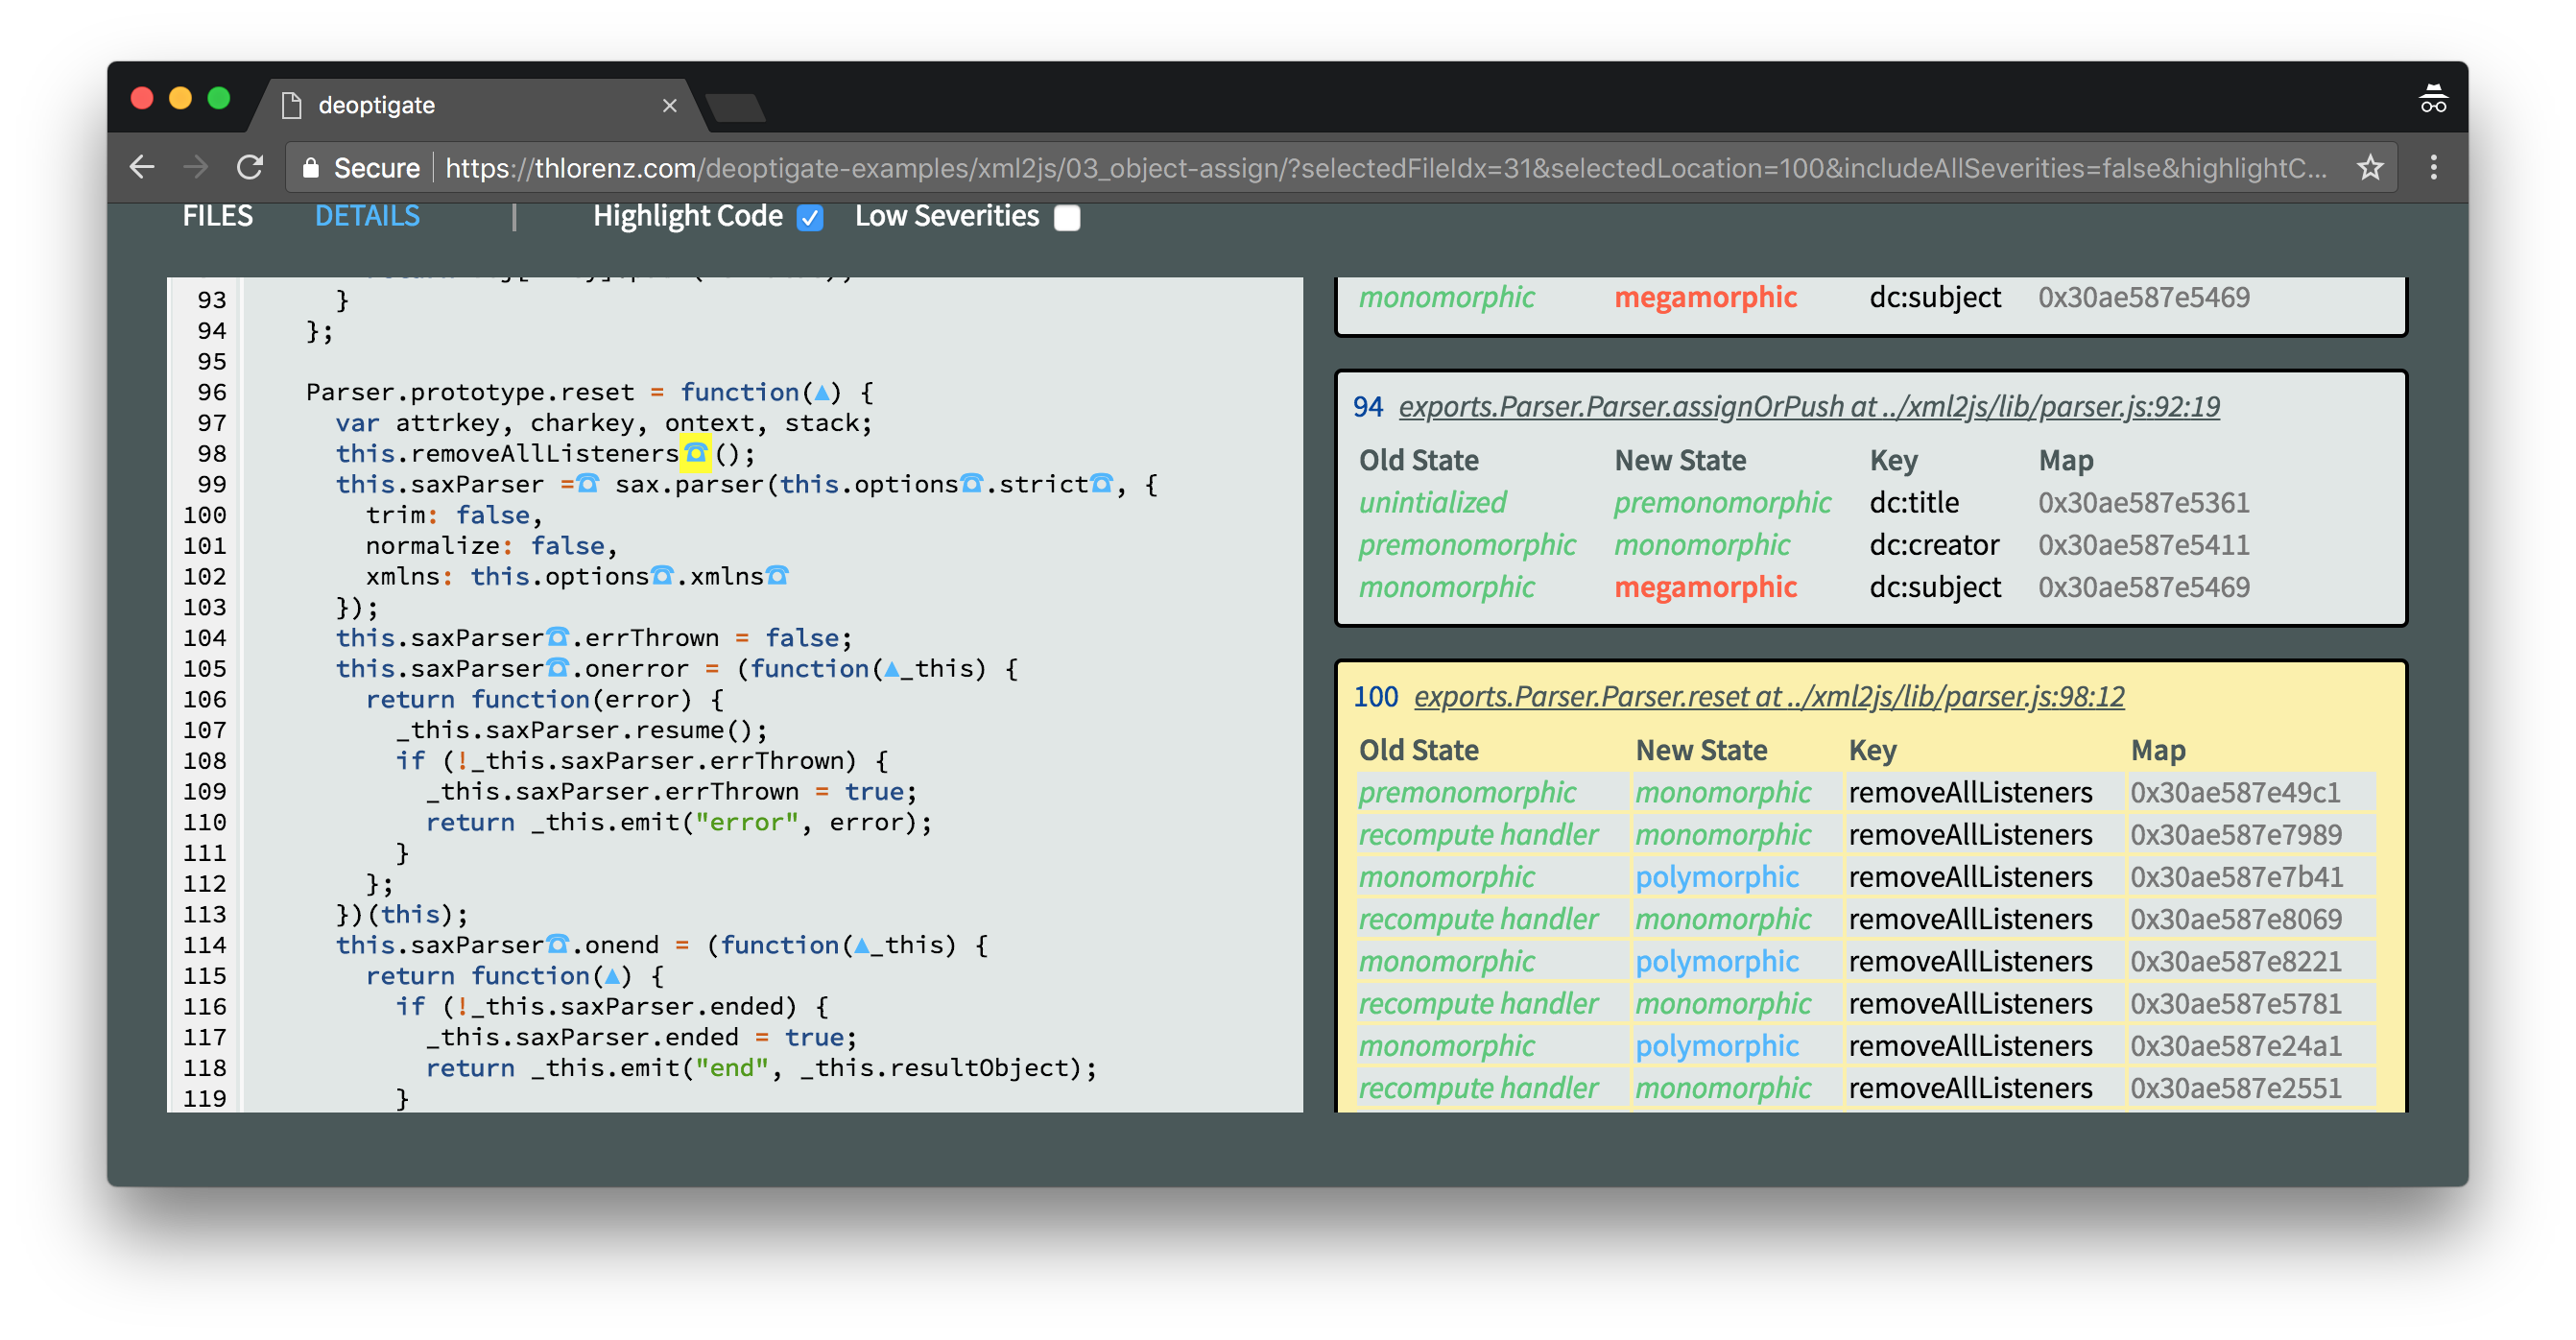
We also notice numerous recomputes. Those are due to the fact that the function got deoptimized and at that point optimistically started out as monomorphic until another Map of this was encountered and it became polymorphic again.
To be clear this here is an instance of the Parser, so I looked for places where we assign properties to it after its constructor runs, since that would cause a Map change, but I couldn't find any. Then I had a closer look at the constructor to ensure that all properties are assigned in the same order, which is also essential to guarantee the same Map. I couldn't find anything obviously wrong in there either.
However the first four lines inside the constructor piqued my interest.
38:       this.parseString = bind(this.parseString, this);
39:       this.reset = bind(this.reset, this);
40:       this.assignOrPush = bind(this.assignOrPush, this);
41:       this.processAsync = bind(this.processAsync, this);
Why are we doing all those binds?
Upon further inspection I noticed that only one of them, processAsync even made sense, but could be easily avoided.
In CoffeeScript using => instead of -> to create a function will have it bound in the generated code, so it's easy to overuse that feature without noticing.
On a hunch I decided to remove all those binds to see if that fixes the deoptimizations and applied the following change.
-  processAsync: =>
+  processAsync: ->
[ .. ]
-        setImmediate @processAsync
+        setImmediate () => @processAsync()
     catch err
       if ! @saxParser.errThrown
         @saxParser.errThrown = true
         @emit err

-  assignOrPush: (obj, key, newValue) =>
+  assignOrPush: (obj, key, newValue) ->

[ .. ]

-  reset: =>
+  reset: ->

[ .. ]

-  parseString: (str, cb) =>
+  parseString: (str, cb) ->
[ .. ]
-        setImmediate @processAsync
+        setImmediate () => @processAsync()
Then I ran deoptigate again to be greeted with a surprise.
✨No more deoptimizations!!! 🎉
However I still didn't understand why those binds caused those Map changes. Didn't the V8 team proudly announce that React folks among others can now use bind freely as it was immensely sped up and didn't cause any problems anymore?
I decided to ask Benedikt Meurer for help. He agreed that bind should not cause any problems but also pointed out that JSFunction closures are tracked on the Map and thus would cause Map changes if they were modified.
However he also explained that functions created via bind are JSBoundFunctions and those are not tracked on the Map and hence shouldn't cause any problems.
I investigated the bind, that was part of the code generated by CoffeeScript, a bit closer by prettifying the one-liner in the head of the parser.js.
bind = function(fn, me) {
  return function() {
    return fn.apply(me, arguments);
  };
}
As at this point it became obvious that the CoffeeScript bind is actually not using JavaScript's bind at all, but instead creates a new function which closes over this via the me parameter. This is a JSFunction and it's going to be a different one every time bind is called.
This means that each time the Parser constructor function runs, the functions assigned to it will be different and since they are tracked on its Map, the Map itself will be different each time as well.
There are clear reasons why CoffeeScript binds functions in that manner, among them supporting browsers without or with slow bind builtins. However CoffeeScript users should be aware of the performance impact that may have.
In our case it was easily fixable since the binds could be avoided without any problems.
Benchmarks or it didn't happen!
As I mentioned earlier, a benchmark should be run at every step to verify improvements. Here we will just compare two benchmarks to see the overall performance gains we achieved with our fixes.
To that end I created a script to exercise the xml2js parser with benchmarkjs which is a great tool to measure the performance of libraries and applications.
With that benchmark I ran the xml2js parser with four different files and recorded the following results.
Before My Fixes
➝  node bench/xml2js.js
	amazon.wsdl                   19 ops/sec ±3.48% (144 runs sampled)
	cities.xml                    24 ops/sec ±1.66% (152 runs sampled)
	ibm-request.soap.xml          51 ops/sec ±2.88% (172 runs sampled)
	openformat-engell.soap.xml    20 ops/sec ±0.72% (145 runs sampled)
	web-account-service.wsdl      19 ops/sec ±1.12% (142 runs sampled)
After My Fixes
➝  node bench/xml2js.js
	amazon.wsdl                   20 ops/sec ±3.40% (146 runs sampled)
	cities.xml                    25 ops/sec ±1.70% (155 runs sampled)
	ibm-request.soap.xml          53 ops/sec ±2.97% (175 runs sampled)
	openformat-engell.soap.xml    21 ops/sec ±0.87% (147 runs sampled)
	web-account-service.wsdl      20 ops/sec ±0.61% (144 runs sampled)
Performance Gain
amazon.wsdl                  ~5.3%
cities.xml                   ~4.2%
ibm-request.soap.xml         ~3.9%
openformat-engell.soap.xml   ~5.0%
web-account-service.wsdl     ~5.3%
Overall Performance Gain
beforeOptsPerSec 	= 19 + 24 + 51 + 20 + 19 = 133
afterOptsPerSec  	= 20 + 25 + 53 + 21 + 20 = 139
diffOptsPerSec   	= 139 - 133              	     =   6
overallPerfGain  	= (6 / 133) * 100        	     = 4.5%
Saving Lives
So all that work for a ~5% performance gain? Is that even worth it?
Well that depends.
As we know the xml2js library is used in many places and thus it is safe to assume that it parsed thousands of XML files even while you were reading this paragraph.
Therefore I'll close with an advice Steve Jobs gave to Larry Kenyon in order to convince him to shave off just 10 seconds of the boot time of the Macintosh.
Well, let's say you can shave 10 seconds off of the boot time. Multiply that by five million users and that’s 50 million seconds, every single day. Over a year, that's probably dozens of lifetimes. So if you make it boot ten seconds faster, you've saved a dozen lives. That's really worth it, don't you think?
So, if you want to start optimizing your Node.js apps' and shaving off tens or hundreds of milliseconds from your applications, you can start using N|Solid and deoptigate together today for. The time you're saving today could very well start saving lives tomorrow.