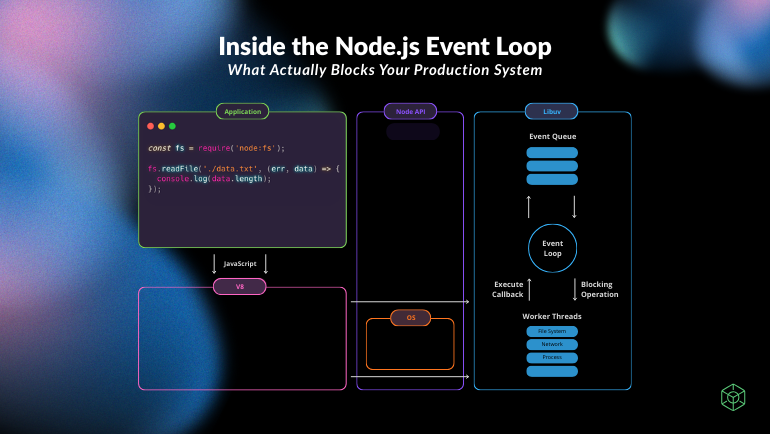
Inside the Node.js Event Loop: What Actually Blocks Your Production System
A deep technical breakdown of the Node.js Event Loop, libuv, thread pool behavior, and the real causes of production latency and blocking.
A deep technical breakdown of the Node.js Event Loop, libuv, thread pool behavior, and the real causes of production latency and blocking.
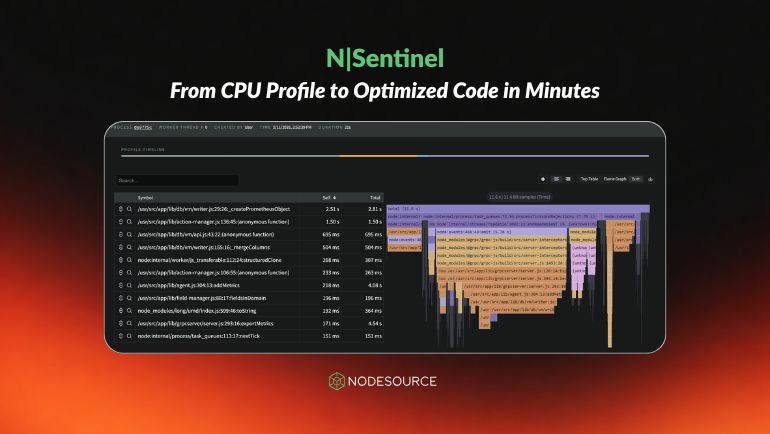
Learn how N|Sentinel turns Node.js CPU profiles into validated, optimized code in minutes with AI-driven performance remediation.
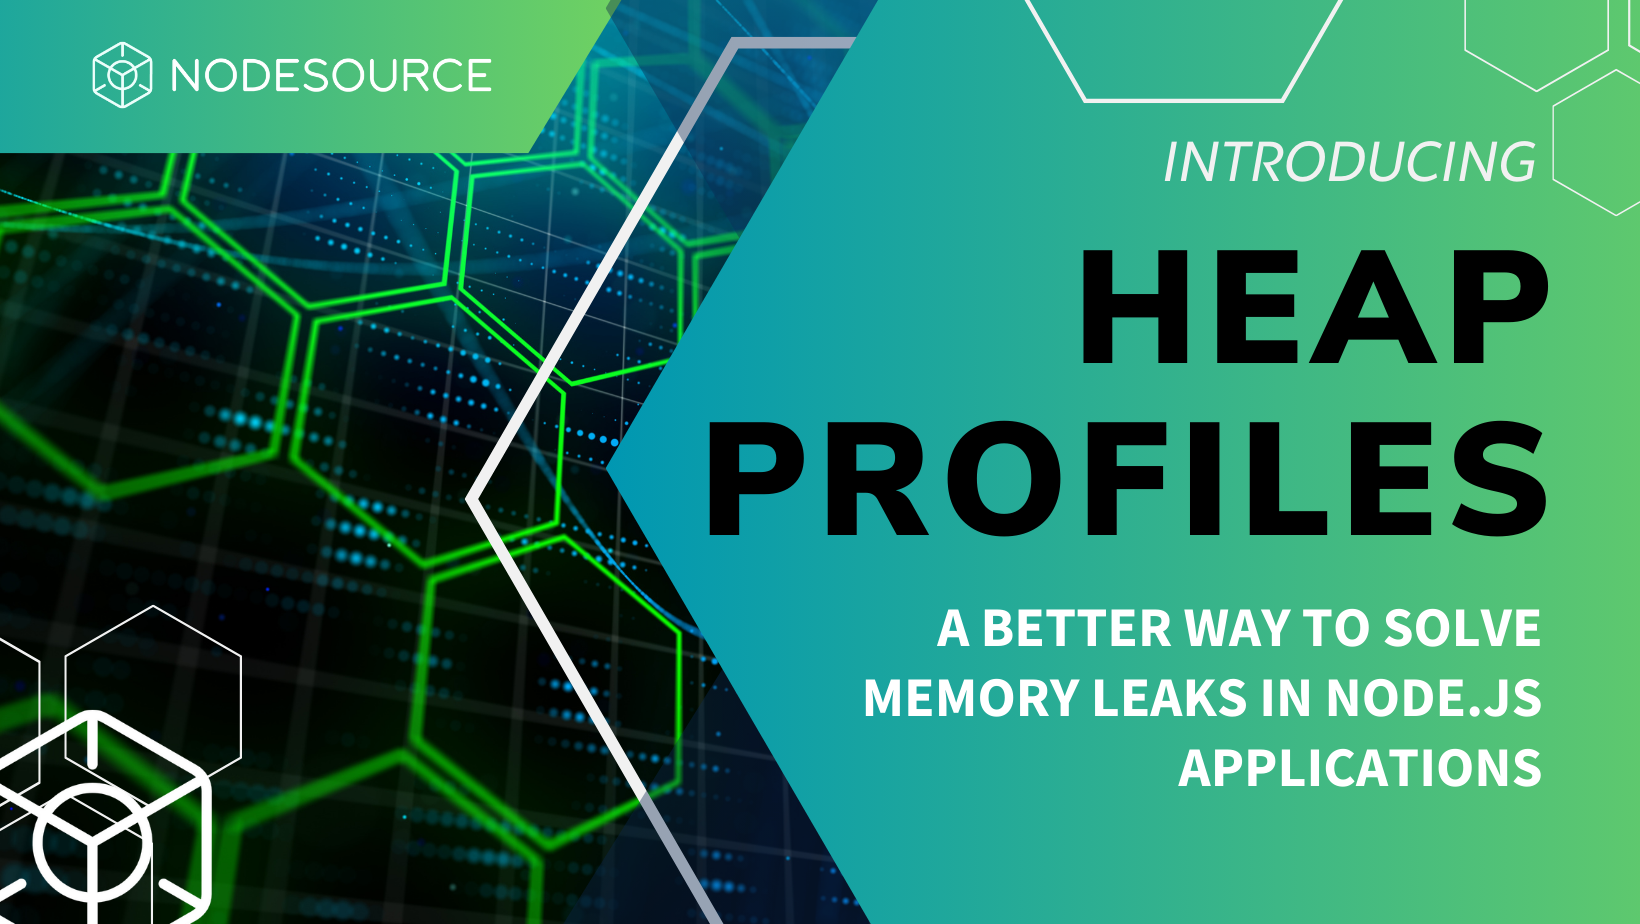
Discover N|Solid's new heap profiling feature for Node.js to easily detect and fix memory leaks with minimal overhead
Explore the top Node.js package managers in 2024: npm, Yarn, pnpm. Compare features, performance, and choose the best for your project.
Explore NodeSource's Infra Team: EKS migration, GitOps adoption, 70% faster deployments, 80% cost savings, reinforcing our Node.js excellence legacy.

the future of software development, is powered by telemetry, security, and AI - which was the topic of our talk. Learn how we are enabling that future.
Learn how to measure latency from the client-side using Chrome DevTools & N|Solid. Gain insights into optimizing performance and enhancing user experiences.
Identifying and addressing bottlenecks enables informed decisions, maintaining security and avoiding unnecessary infrastructure changes with NSolid.
N|Solid provides AIops into Node.js applications, enabling developers to identify performance issues and detect security vulnerabilities.

Get insights into the current state of your running applications/services through OpenTelemetry. Extract metrics, logs and traces, using the best practices.

OpenTelemetry is a standard to collect and instrument traces, metrics and logs. NodeSource supports OpenTelemetry, and N|Solid supports the OTel standard.
We are confident we're the best APM solution for Node. js-based applications; if you are using Node, you should be using our runtime.