Worker Threads Monitoring in N|Solid [6/10] The best APM for Node, layer by layer.
Worker Threads Monitoring
One of the more popular ways for developers to use Node.js is to leverage Worker Threads. Workers (threads) are useful for performing CPU-intensive JavaScript operations, according to the official documentation.
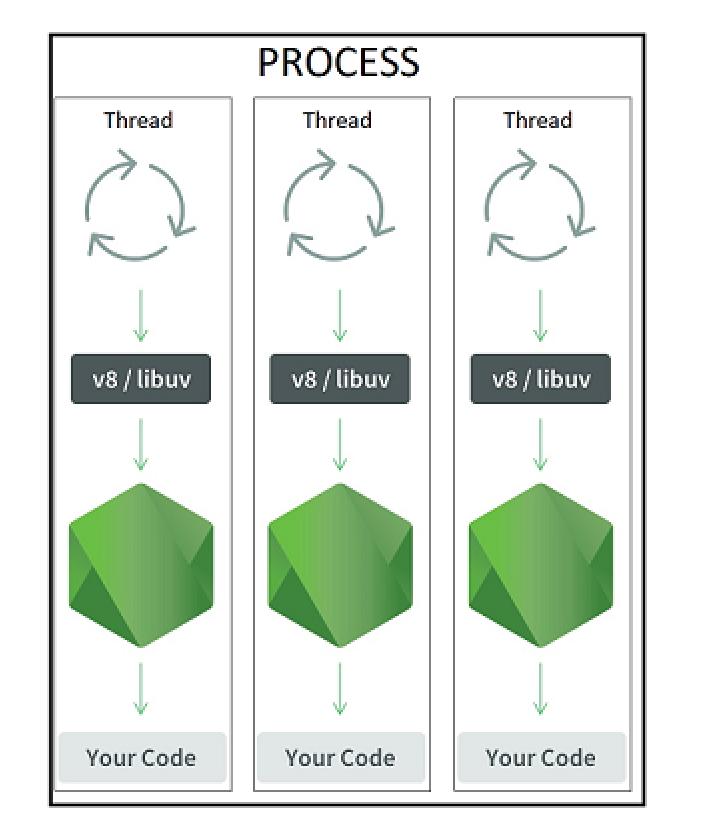
They have proven to be the best solution for CPU performance due to the following features:
- They run a single process with multiple threads.
- Executing one event loop per thread.
- Running single JS Engine instance per thread.
- Executing a single Node.js instance per thread.

Img 1 - Tracing - N|Solid
Since JavaScript doesn't support concurrency, Node.js worker uses V8, allowing the worker to run in complete isolation from other existing workers. If you want a detailed introduction to using web workers, read our previous blogpost, 'Understanding Worker Threads in Node.js'.
Gather information about a Worker Thread in production?
Last year we announced the addition of Worker Threads support in N|Solid. We are sure that Worker Threads are a powerful feature in Node.js that allows developers to build more complex and robust applications. Still, we also know that Organizations have had a significant challenge in adopting Worker Threads (despite their value) due to the lack of tooling and visibility on what's happening inside the threads.
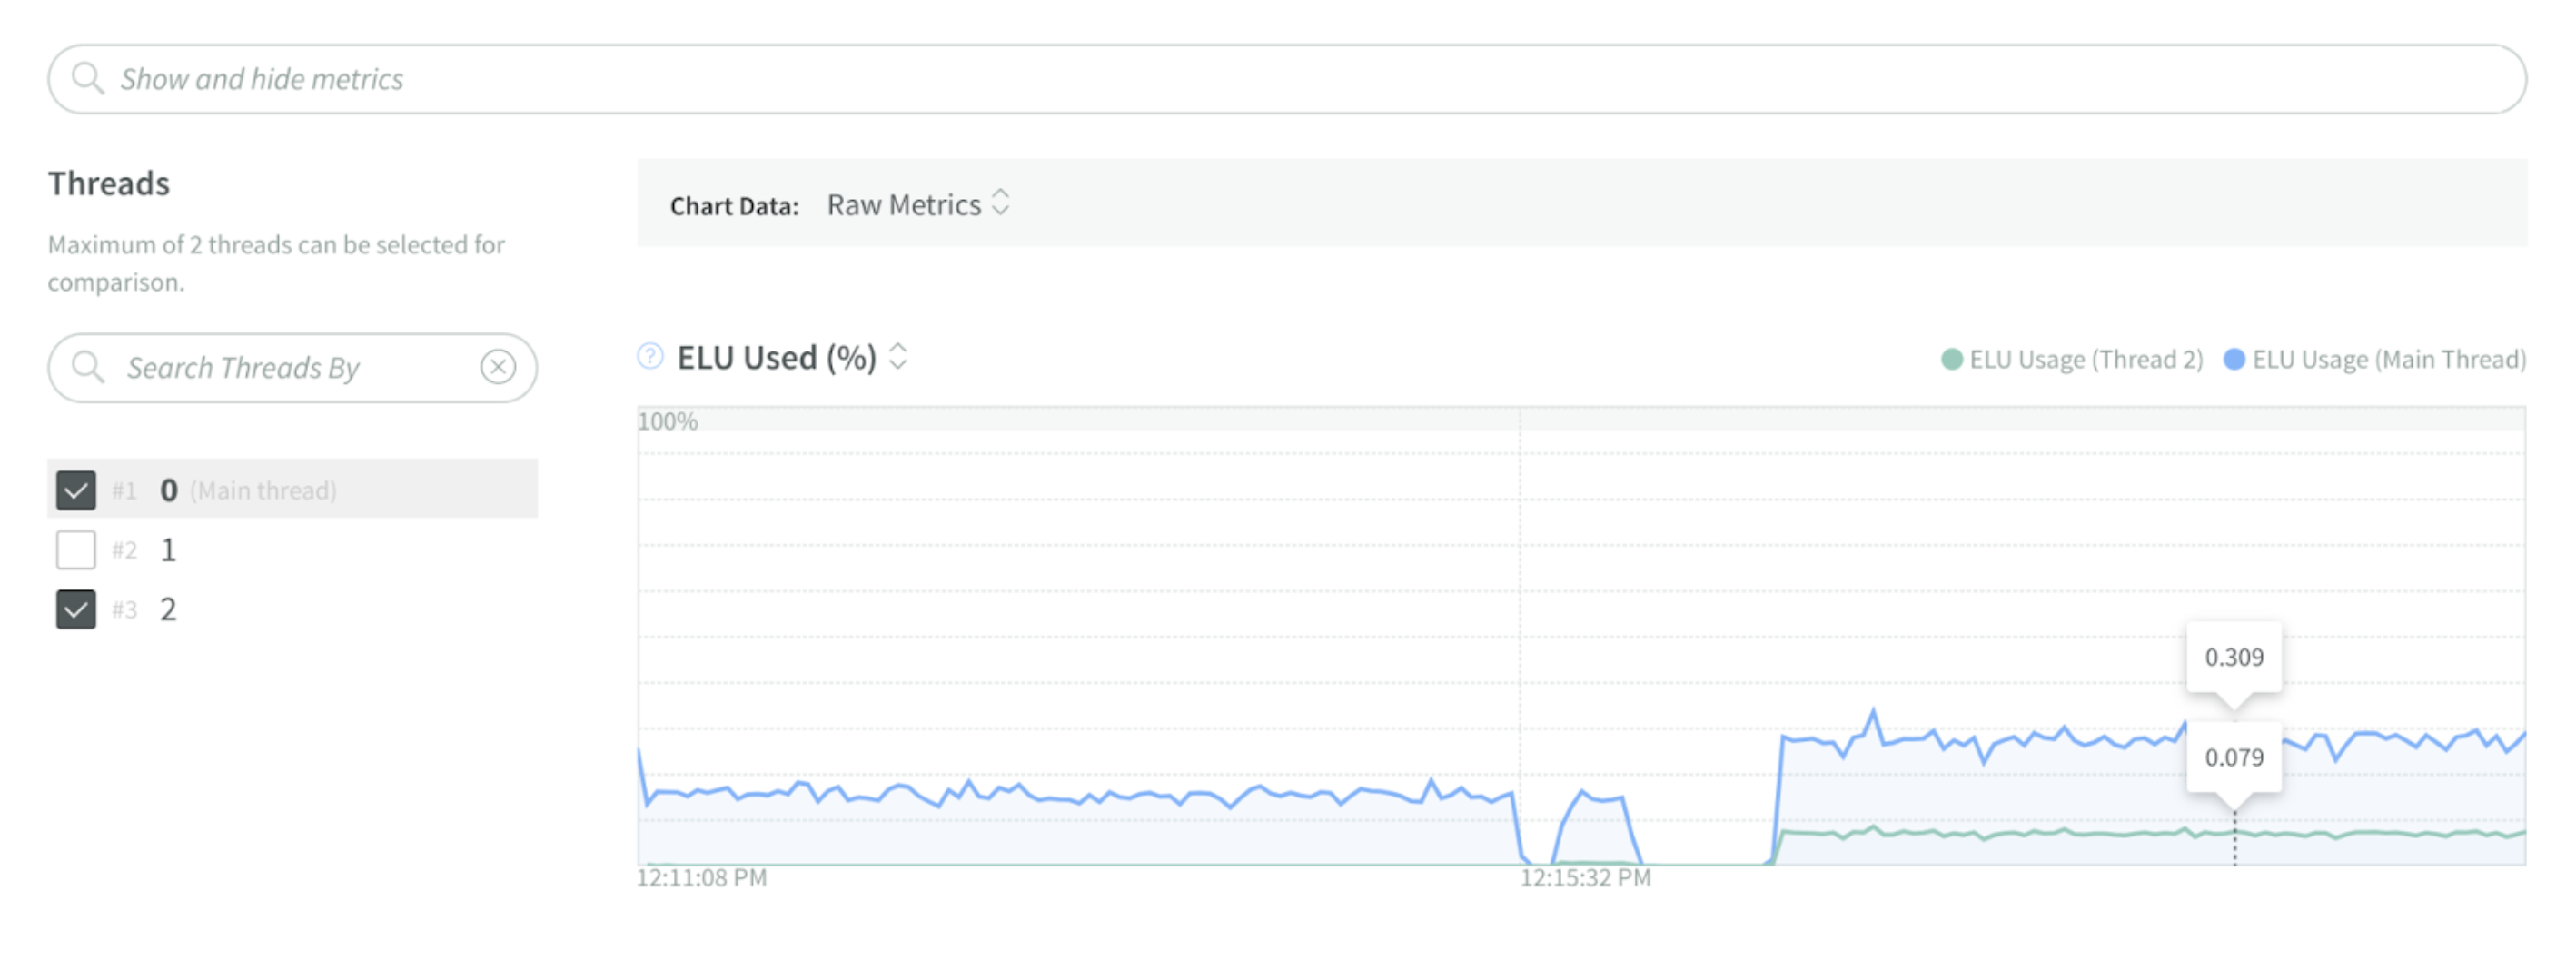
 Img 2. Worker Threads detail in N|Solid
With N|Solid, customers have in-depth metrics of each worker thread just as they previously leveraged them on the main thread in production 😱. If you want to learn more about how to view Worker Thread insights in N|Solid read this article.
Why Worker Threads Monitoring in N|Solid is different?
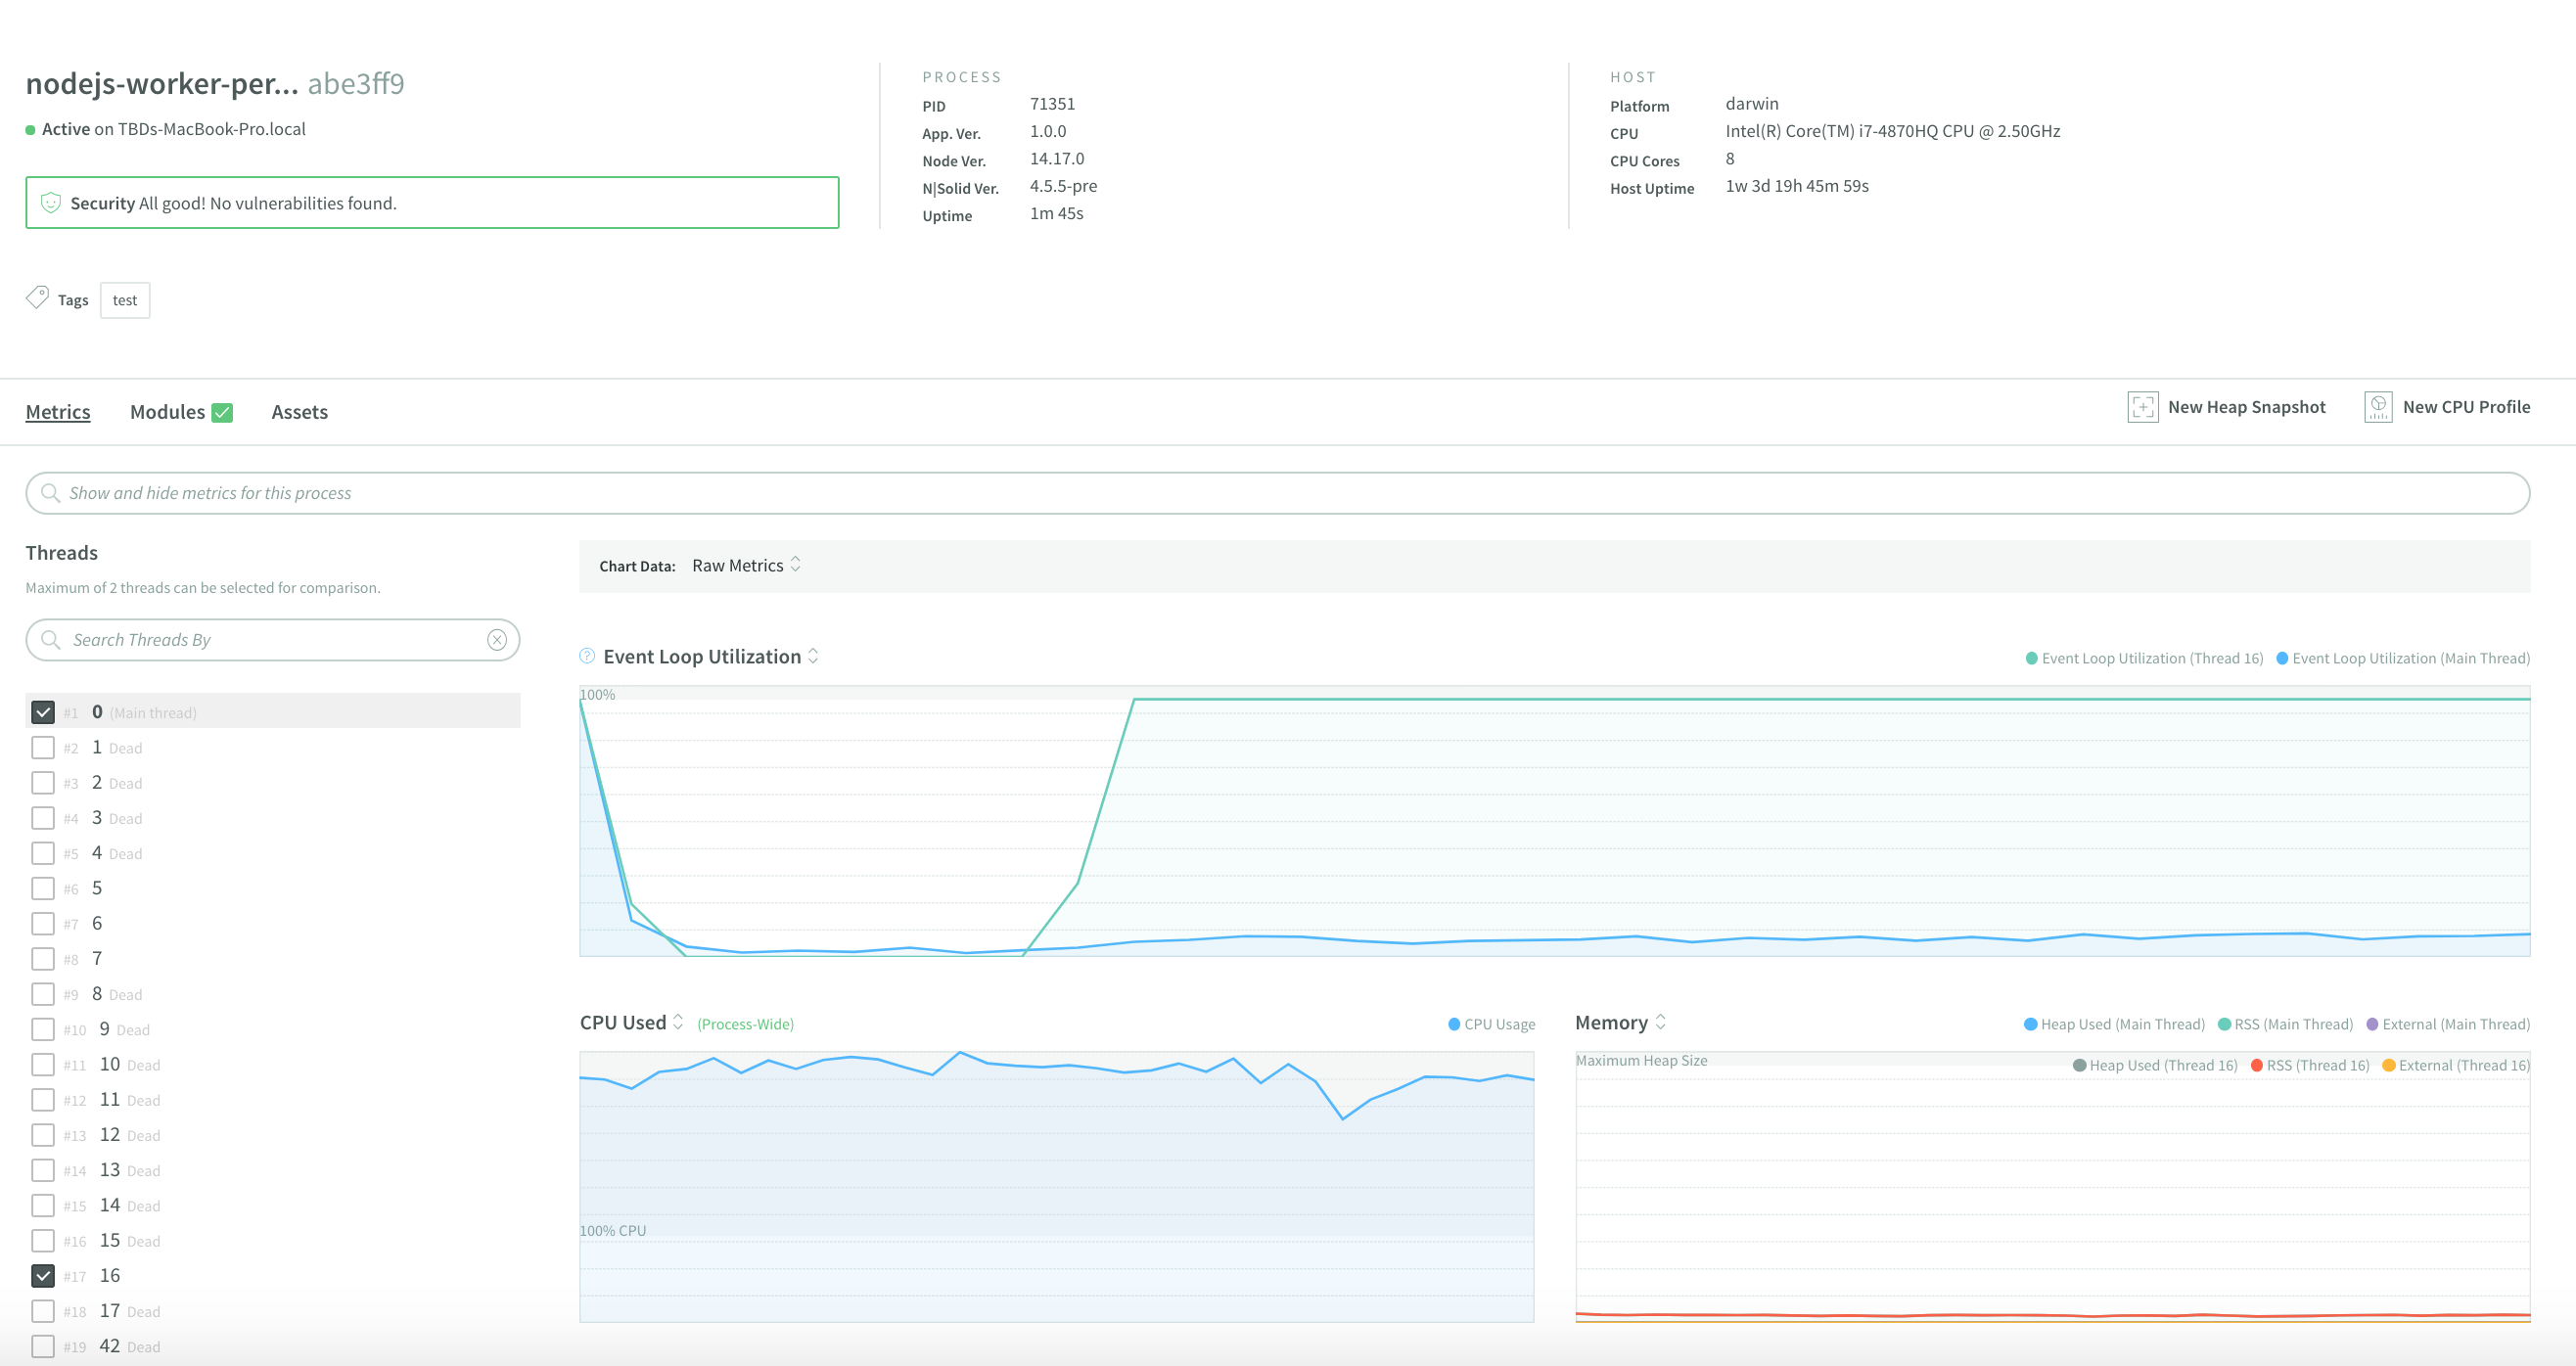
N|Solid Console was made to support worker thread metrics from the beginning. Our interface supports worker threads unlike any other APM; we have the power to take a CPU profile or a heap snapshot of any worker thread on the fly. You also can straightforwardly pinpoint each thread.
 Img 3. Worker Threads in N|Solid Console
We've extended all our tooling into worker threads, where no one else has. Any company implementing Worker threads has no option but to use N|Solid if they wish to monitor worker threads.
- Advantage: View In-depth metrics of each worker thread.
- Benefit: Identify opportunities to improve the performance of CPU-intensive work.
Have in-depth metrics of each worker thread just as they have leveraged them previously on the main thread.
- Debug and find solutions for any problems while using threads in production.
- Seamless, integrated, with zero overhead, backward compatible, and includes CLI support.
N|Solid is the only tool that allows you to inspect the worker thread and identify issues at this more profound level.
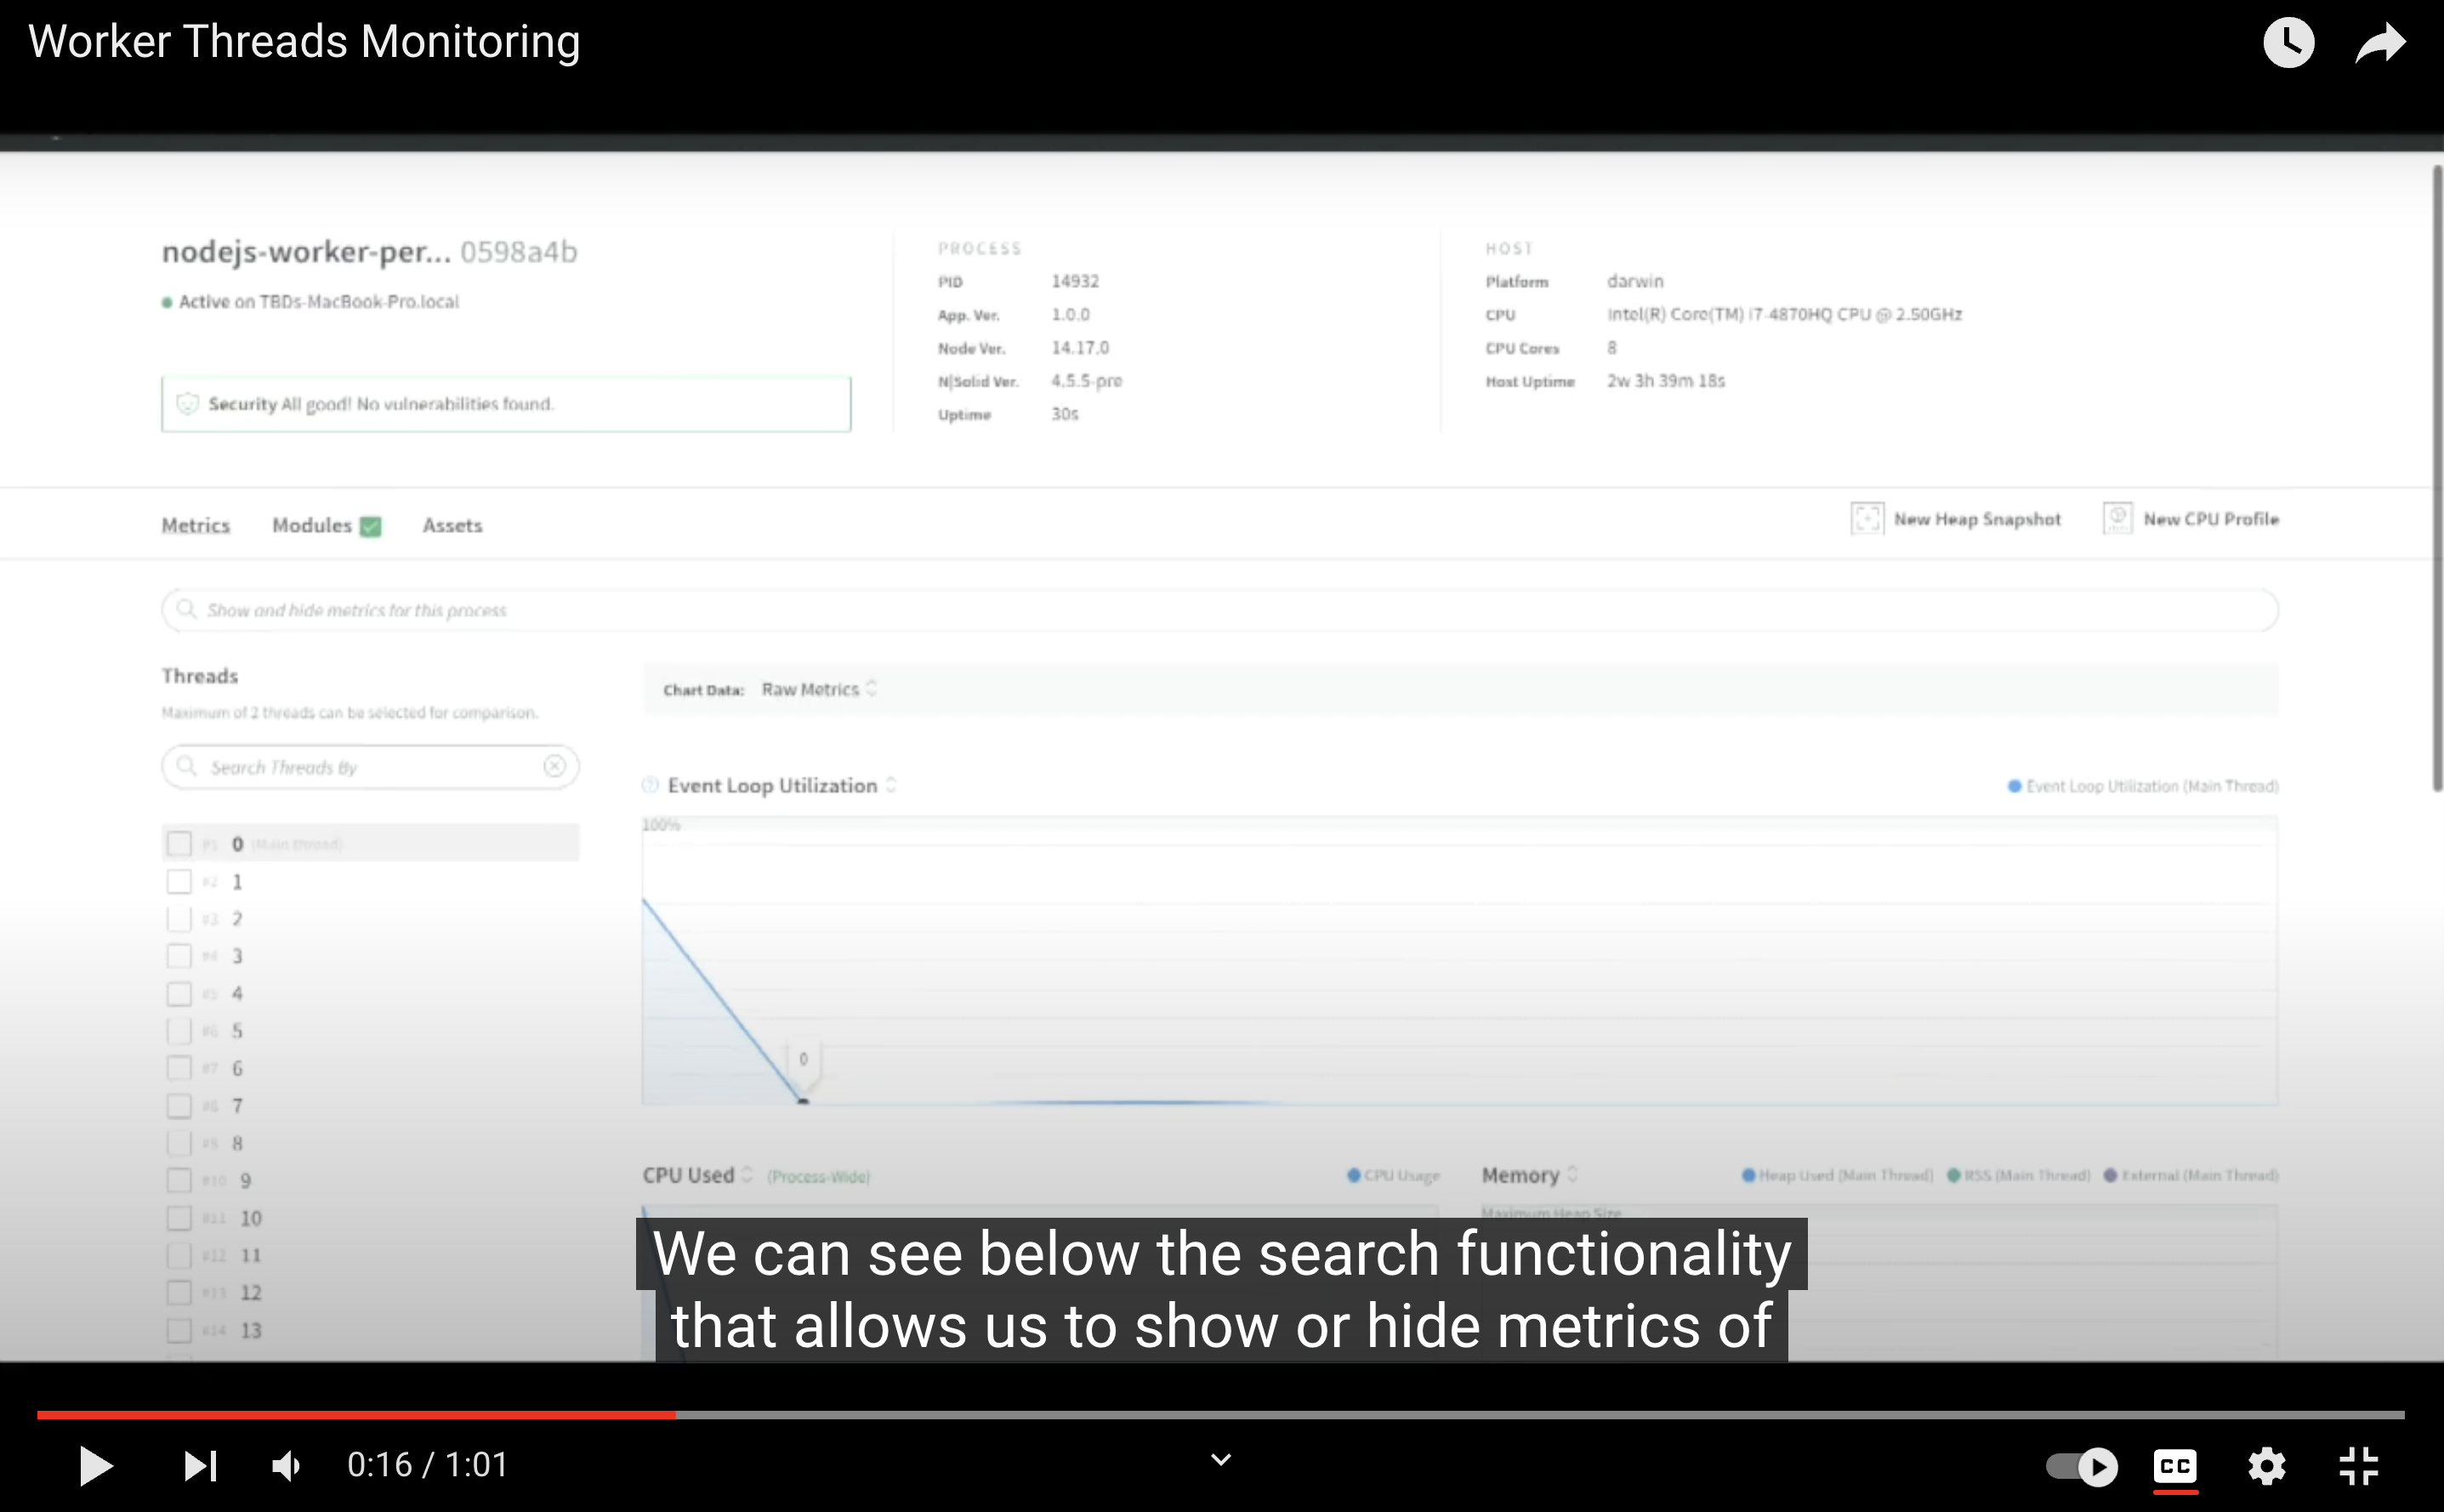
Demo Video — Worker Threads Monitoring in N|Solid
 __NOTE: __ For a better experience, you can activate the closed captions in the video. They are available in English.
When reviewing our application, we can see the process and the number of associated worker threads in the central Console. You can select a maximum of 2 threads out of the 17 in this process to perform a comparison, specifically reviewing:
- Event Loop Utilization
- CPUUsed
- Memory
- host load
- async data
- event-loop
- Internal Activity You also can create Heap Snapshots; only one thread can be selected. Or we can also create a CPU Profile, as explained in more Depth in CPU Profiling video.
Want to try N|Solid?
Do it right now! 🏃🏿♂️🏃♀️, We release in Openjs World 2022 some codes to redeem 50% in 8 or 12 processes in our SaaS version.
50% OFF USING:
- 8 processes OPENJS-8T
- 12 processes OPENJS-12T
Or sign up for our FREE option for 4 processes and get started with N|Solid!
To check out the top 10 features and more in N|Solid, sign up to create your account or sign in at the top right corner of our main page. More information is available here.