Memory Anomaly Detection in N|Solid [5/10] The best APM for Node, layer by layer
Inspecting Anomalies
Anomaly detection refers to the problem of finding patterns in data that do not conform to expected behavior. Understanding memory management reduces the possibility of wasting your application's resources and the unexpected effects on performance. According to Sergey Kibish, Anomalies can be illustrated in a simple two-dimensional space (Figure 1).
 Figure 1 - Illustration of simple anomalies in two-dimensional space
Abnormal behavior can be identified compared to an established pattern, and anything that deviates from an established baseline pattern is considered an anomaly. Read more here.
Memory Anomaly Detection in N|Solid
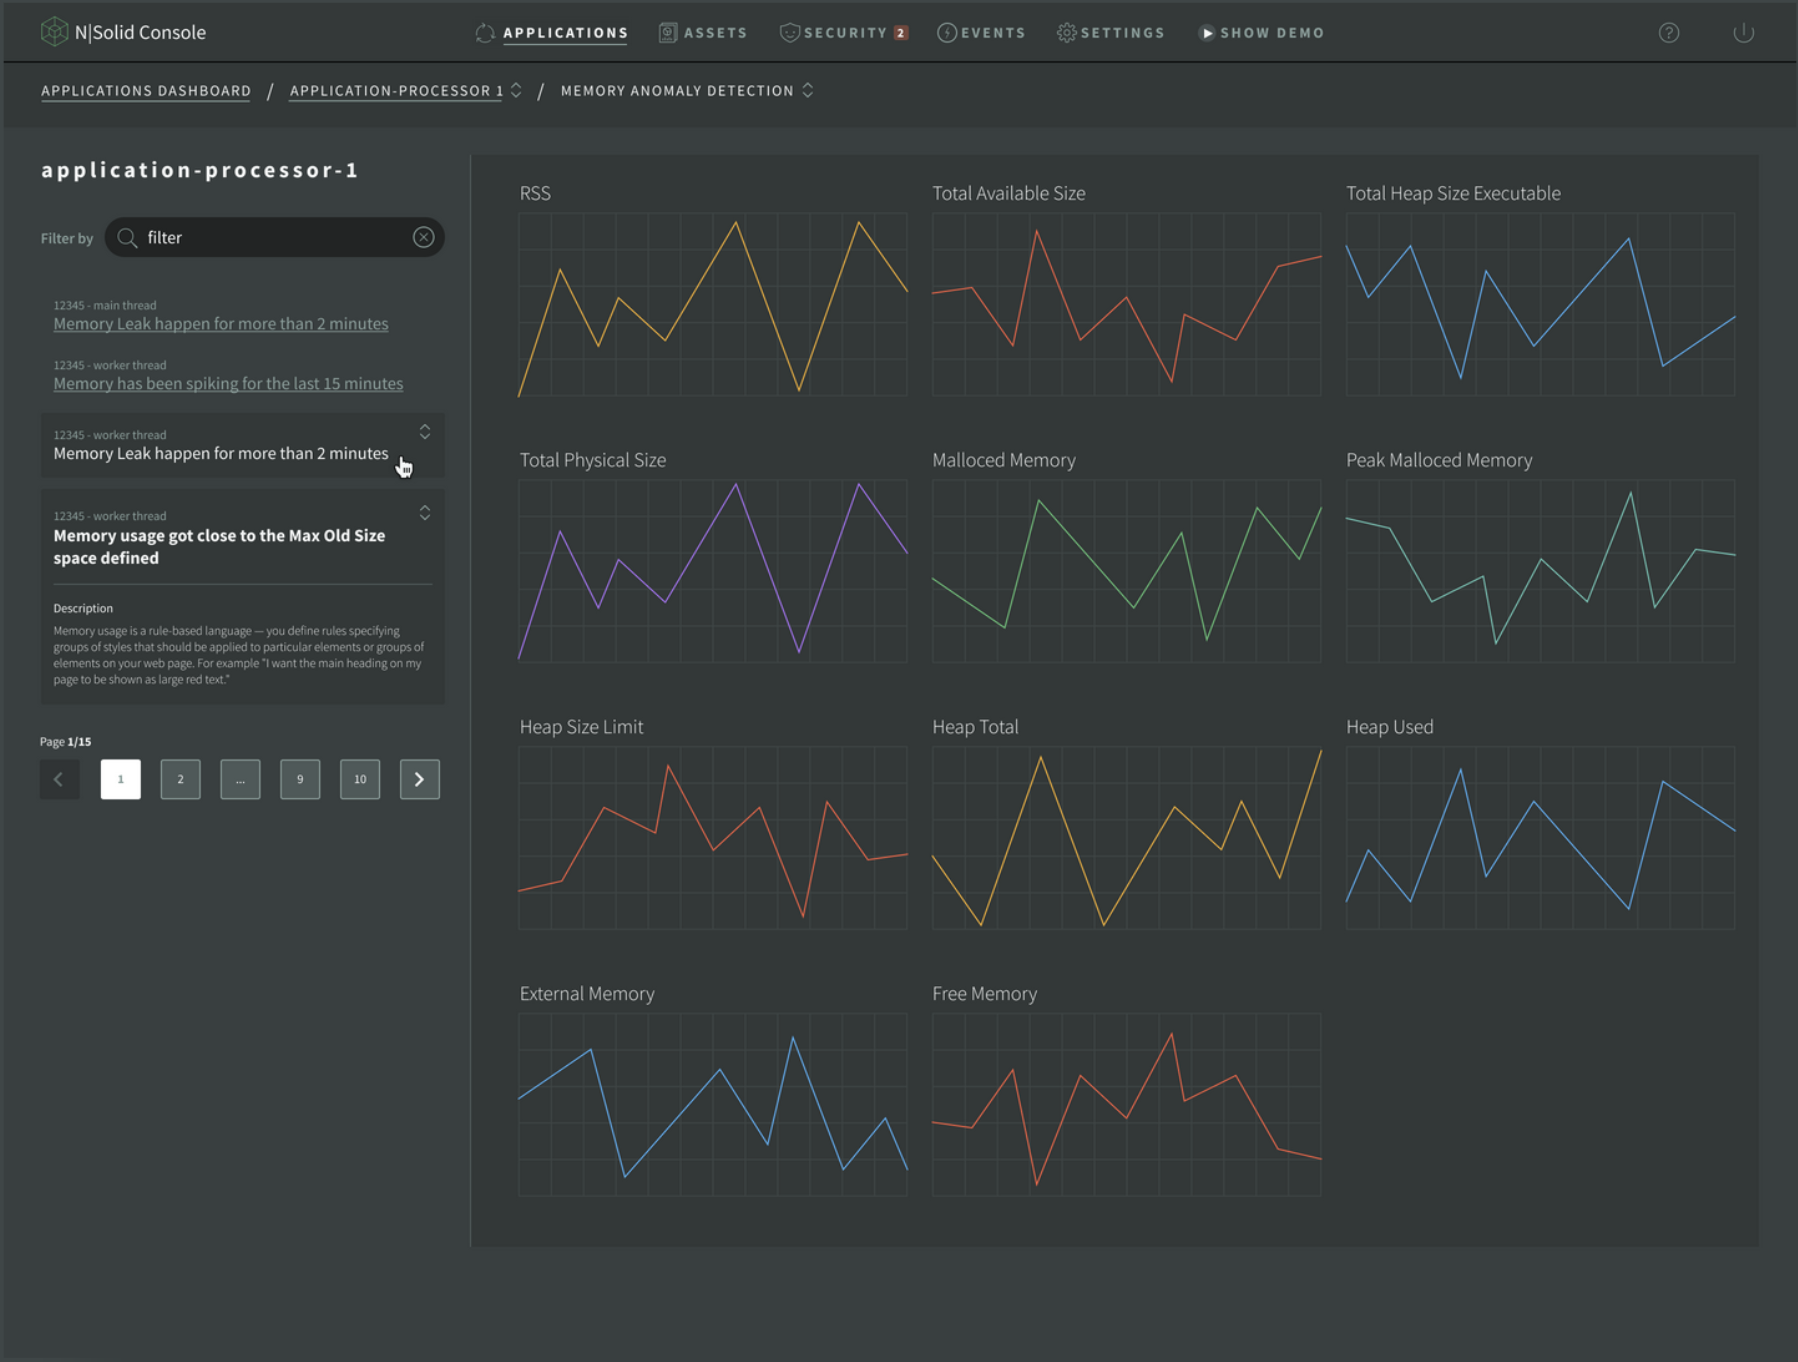
Memory Anomalies in the N|Solid Console provides a way to detect early cases of memory miss behavior or upcoming Out of Memory situations before it happens. That way, you can reduce the knowledge problem and view what is being triggered, and definitely, you don't need to be experienced to understand the data. It analyzes the data for you.
Anomaly Detection is helpful for infrastructure to view and for the developer to solve quickly. N|Solid generates anomaly events when the processes exceed the typical percentages of memory. This view helps you see potential memory issues or take a Heapsnap shot from any thread on the fly.

Img 1 - Memory Anomaly Detection - N|Solid
The feature Memory Anomaly Detection allows you:
- Navigate between historical insights and metrics before and after the incident happened.
- Get anomalies at different heap usage levels.
- Detect correlation between sets of memory-specific metrics.
- Filter results by specific processes inside your application.
You can read more about it in NodeSource Documentation.
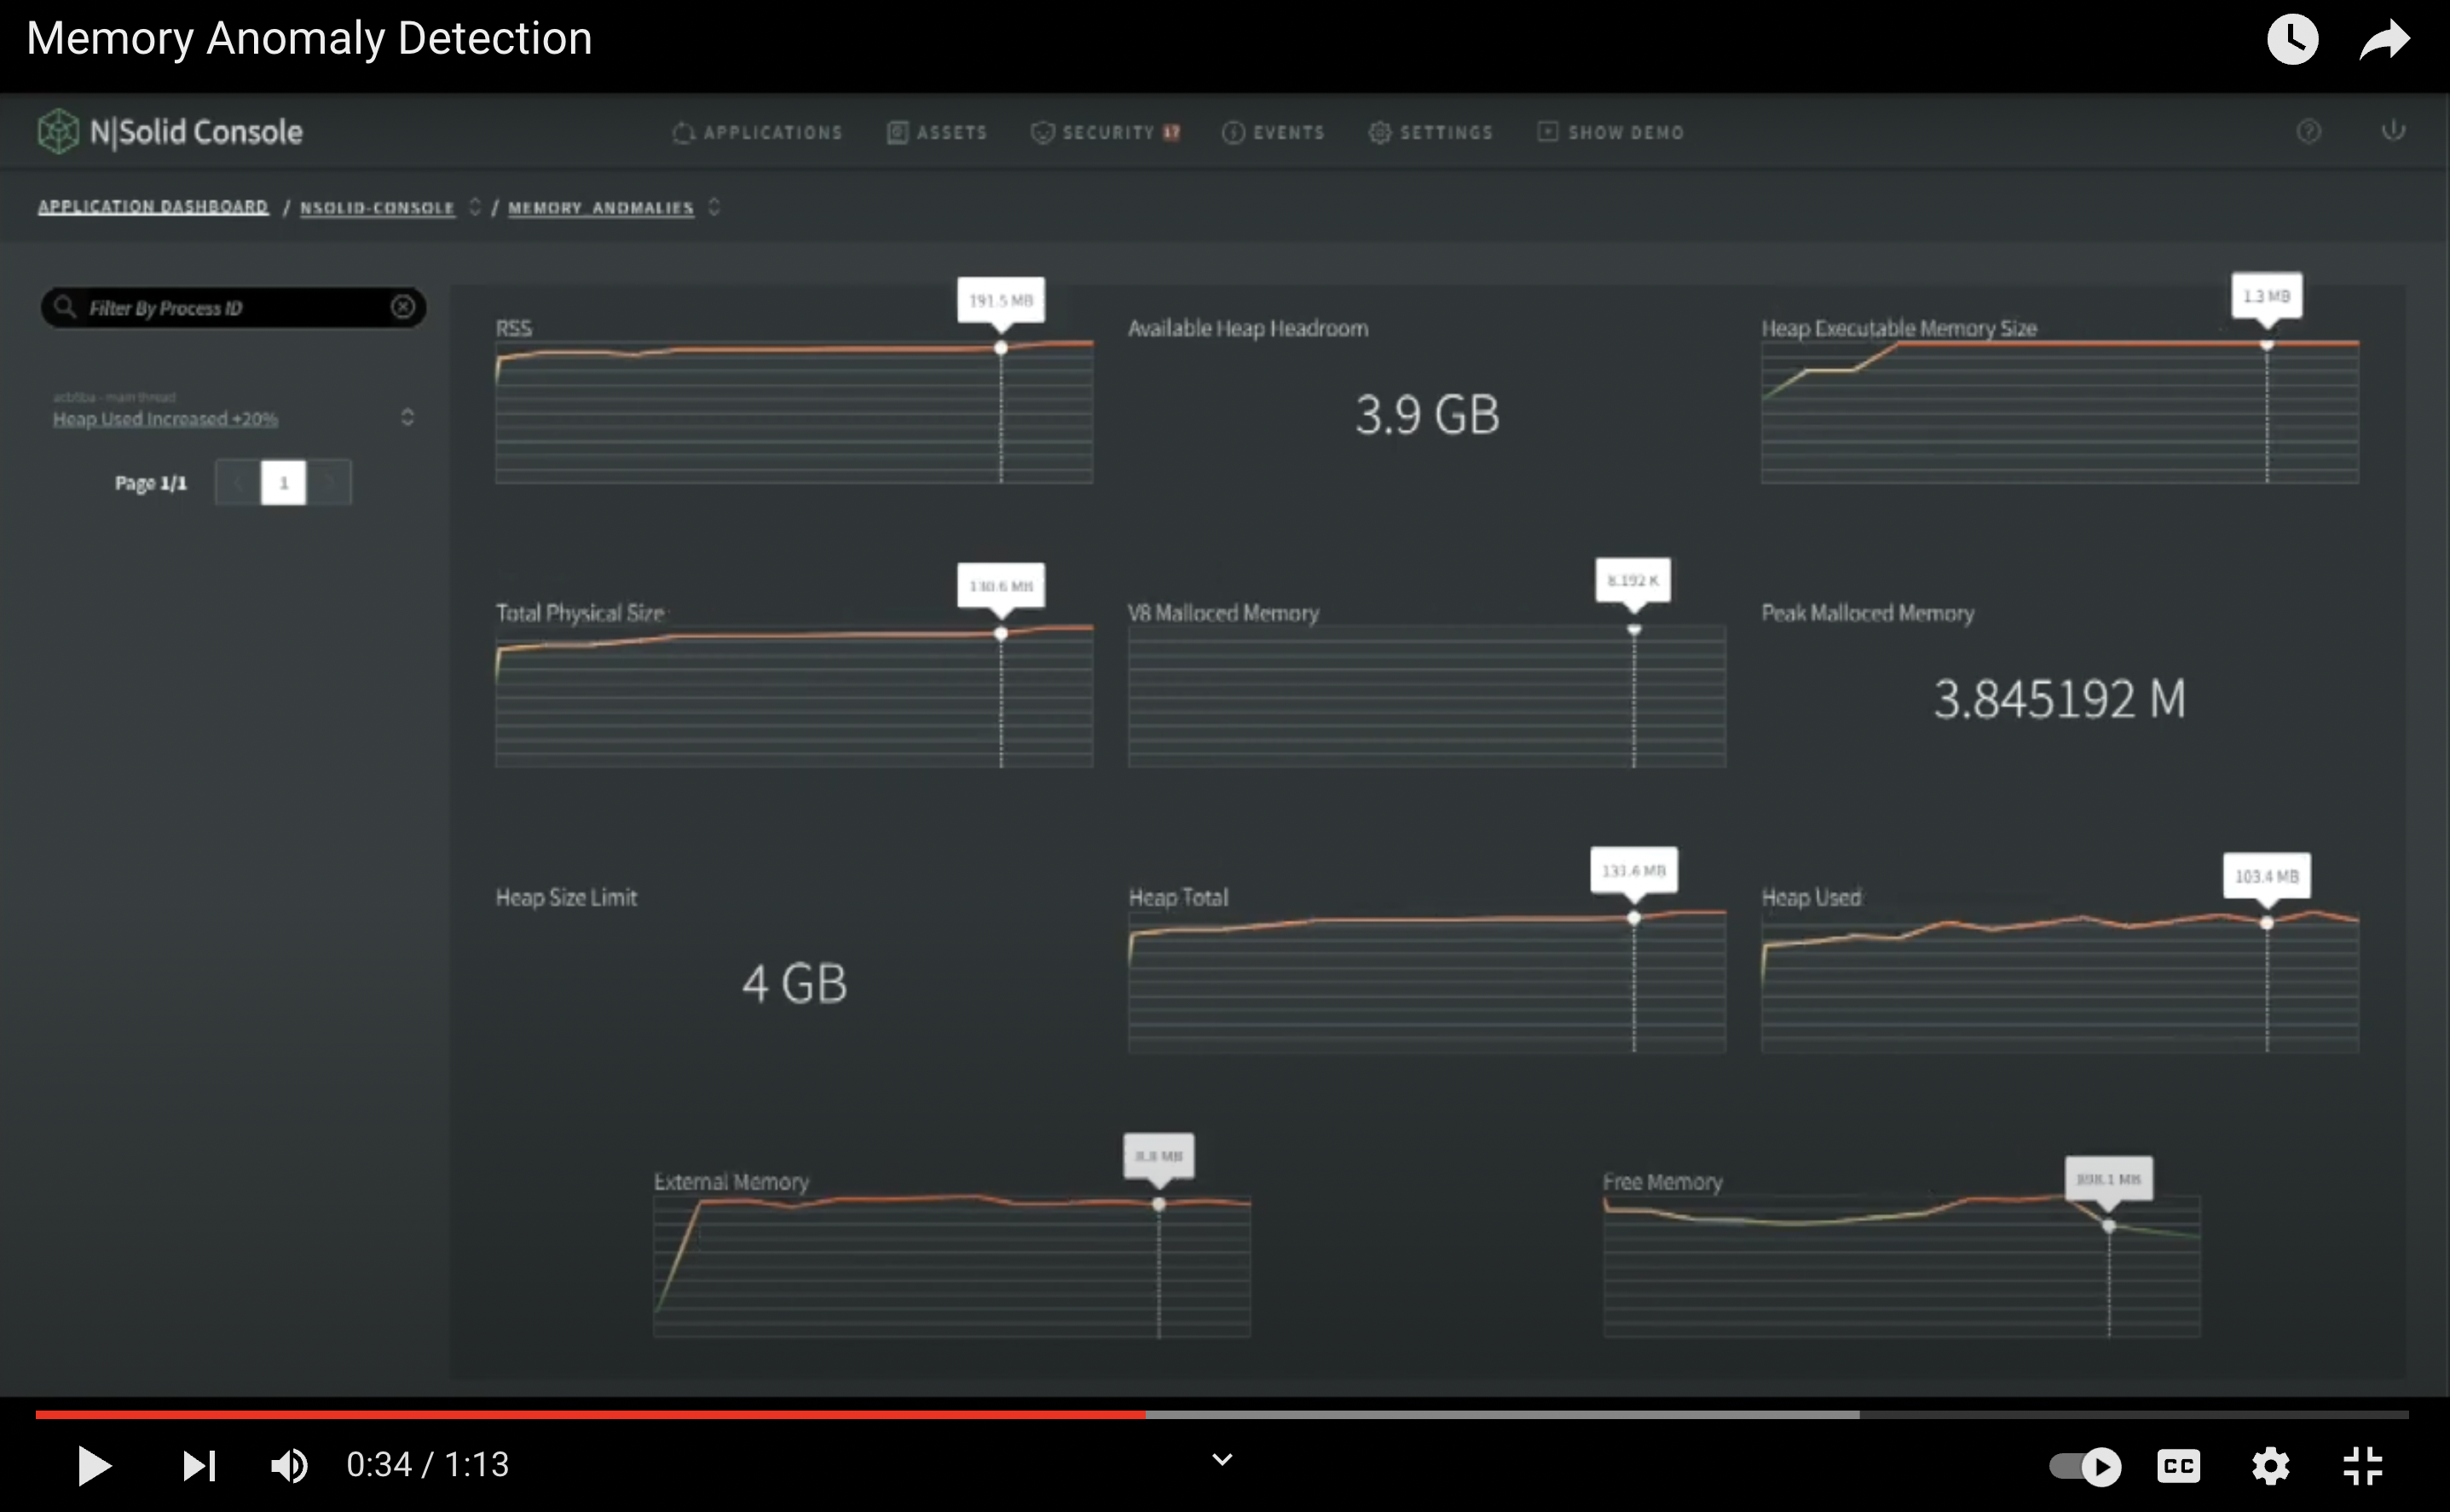
Demo Video — Memory Anomaly Detection in N|Solid
__NOTE: __ For a better experience, you can activate the closed captions in the video, they are available in English.
- Advantage: View In-depth metrics of each worker thread.
- Benefit: Identify opportunities to improve the performance of CPU-intensive work and identify Memory anomalies taken with a more accurate detection method.
Want to try N|Solid?
Do it right now! 🏃🏿♂️🏃♀️, We release in Openjs World 2022 some codes to redeem 50% in 8 or 12 processes in our SaaS version.
50% OFF USING:
- 8 processes OPENJS-8T
- 12 processes OPENJS-12T
Or sign up for our FREE option for 4 processes and get started with N|Solid!
To check out the top 10 features and more in N|Solid, sign up to create your account or sign in at the top right corner of our main page. More information is available here.
