Announcing Worker Threads Monitoring for Node.js in N|Solid
NodeSource is very excited to announce the addition of Worker Threads support in N|Solid, it’s an amazing new feature for our customers on their journey with Node.js.
Worker Threads are a very powerful feature in Node.js that allows developers to build more complex and robust applications. Worker Threads became stable in Node.js v12 in April 2019 the Node.js Contributors have been heavily focusing on this killer feature because they provide developers the ability to improve the performance CPU intensive-work. To learn more about the importance and the basics of worker threads, check out this article.
Organizations have had a major challenge in adopting Worker Threads (in spite of their value) due to the lack of tooling and visibility on what’s happening inside the threads. Today, with the latest release of N|Solid, that all changes.
With Worker Threads in N|Solid, customers will now be able to have in-depth metrics of each worker thread just as they have leveraged them previously on the main thread.
By adding full support for Worker threads developers should be able to use Workers in a production environment with the confidence that any issues that arise can be solved just as easily as if the process was not using Workers.
Note: Worker threads are supported only on Erbium (Node.js v12) and Fermium (Node.js v14) which are the only Node.js versions that support Worker Threads as a stable feature. So if you are using non-supported Node.js versions, this is a great reason to upgrade. Also keep in mind that Node.js v10 will no longer be supported in April 2021.
What’s so exciting about this?
For the first time in the Node.js ecosystem, you can now take Heap Snapshots and CPU profile of an individual Worker Thread of your preference, (not only the main thread) compare threads, debug, troubleshoot and find solutions for any problems while using threads in production. You can now develop using Worker Threads without any worrying and the confidence provided by all N|Solid metrics. These insights will help developers build better applications and also solve issues that arise significantly faster.
We now offer worker threads support out of the box. It’s seamless, integrated, with zero overhead, backwards compatible and includes CLI support. No other commercial APM supports this.
To take a heap snapshot or CPU profile you just have to choose the thread 🙌😁, it's that simple.
In other words, all the value that developers receive from N|Solid for the main thread, is now also available for Worker Threads.
Why should you try it?
There are no other solutions on the market that enable developers to easily and seamlessly stream metrics or take snapshots and CPU profiles of individual Worker threads. N|Solid is the only product that exists for this. No other APM offers this capability.
So if you want to take the maximum advantage of Worker Threads on the enterprise, and easily find more information about the threads you are creating and using, you should give N|Solid it a try.
How is this different from current solutions?
It can be difficult to gather information about a Worker Thread in production. Usually to get that information, you need to do it in development, interrupt the thread and enter into debugging mode. Normally you can’t do this in production.
With this release, a Worker Thread running in production can be instantly interrupted and you can gather information about it in the form of a CPU profile or a heap snapshot while the process is running, that is, without interrupting the process itself and regardless of the state of the worker thread (other solutions out there require the worker to be available to be queried).
You can collect and report all the same metrics for all threads and they can be stored, so you can have a comprehensive overview of how all of your worker threads have been doing over time, including when they have been up, or down, how many are you are currently using, what they are doing, how many handles they have, and others.
How to view Worker Thread insights in N|Solid
There are changes in two main views, in the scatterplot and the process details.
On the top right in the scatterplot graph, you can see the process id and the number of threads of that process, as you can see in the image below:
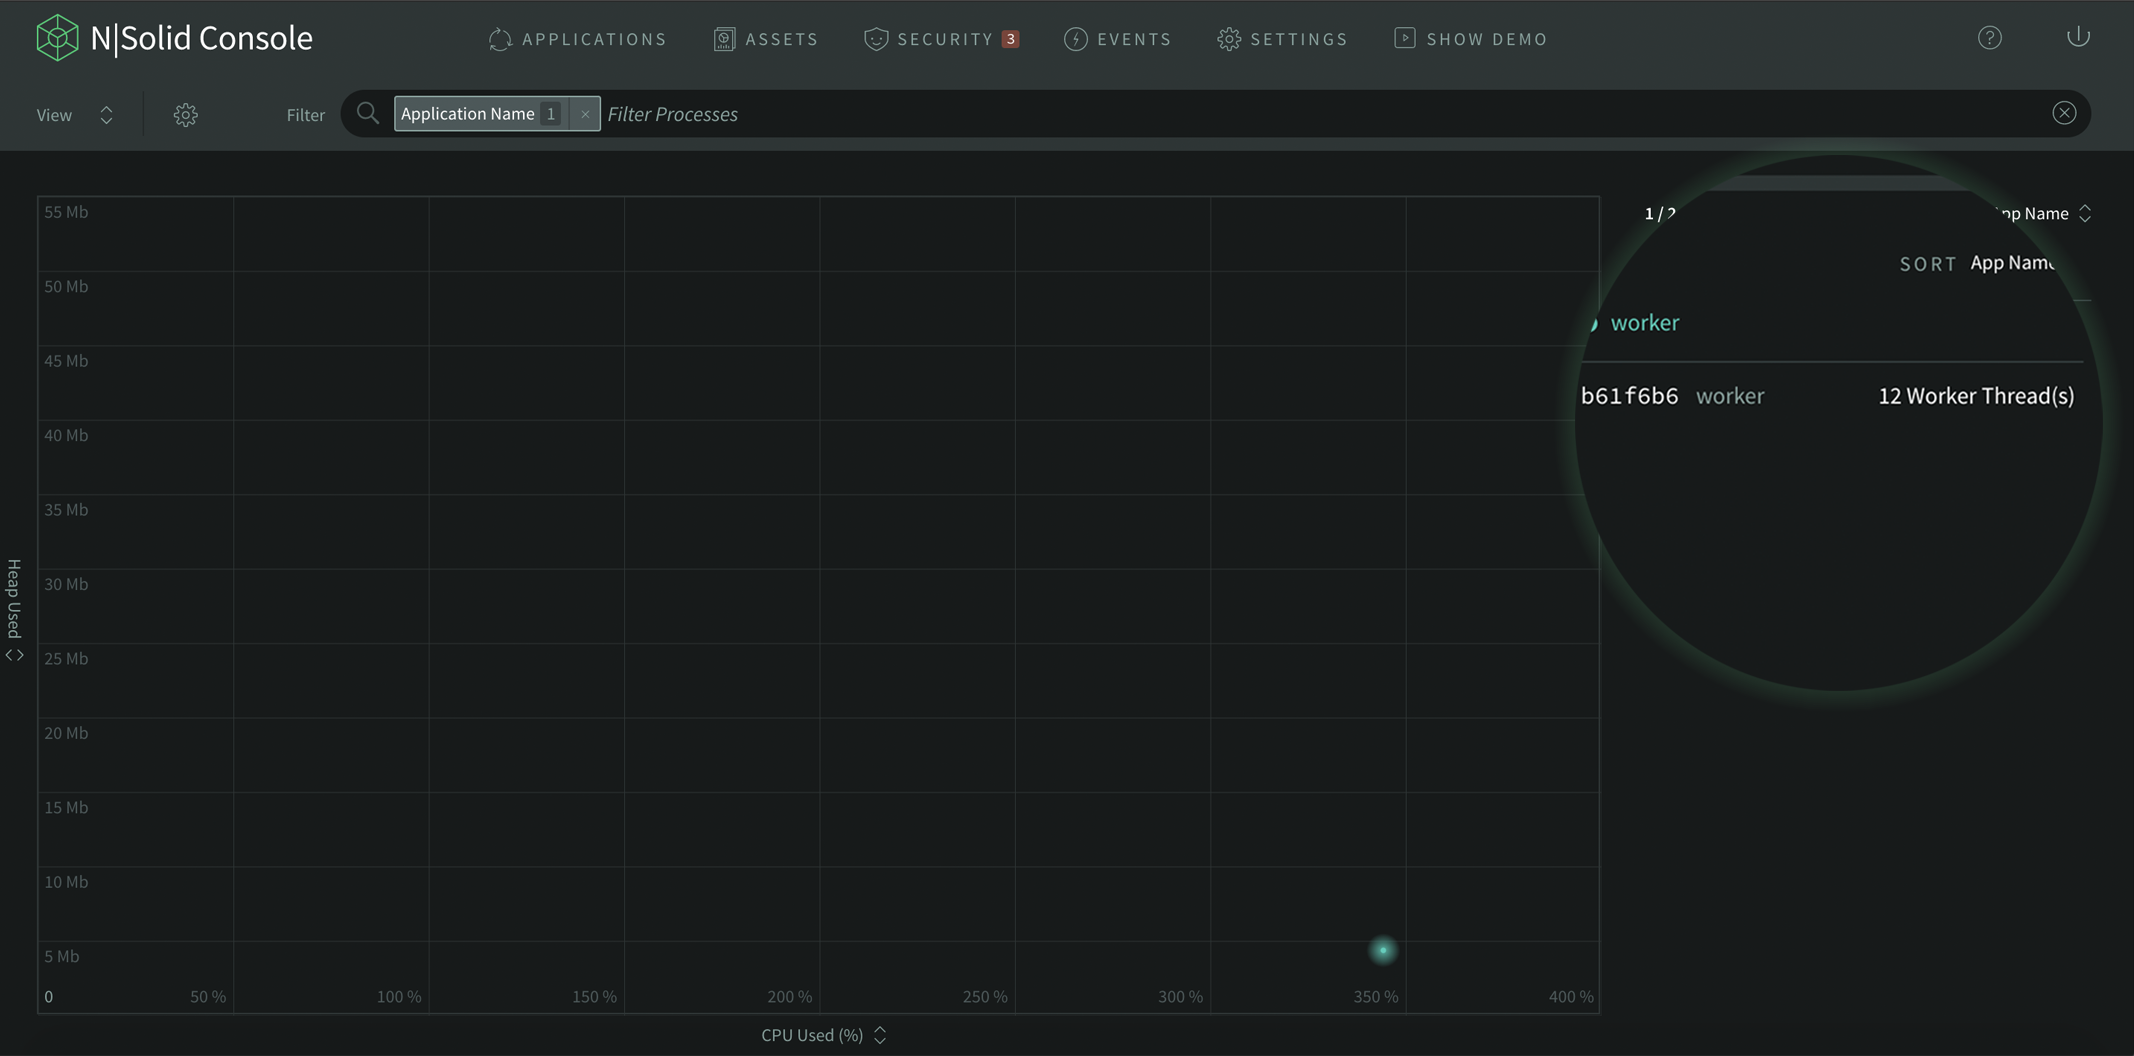
In this case, that specific process has 4 Worker Threads. If the process has no threads it will show as 0.
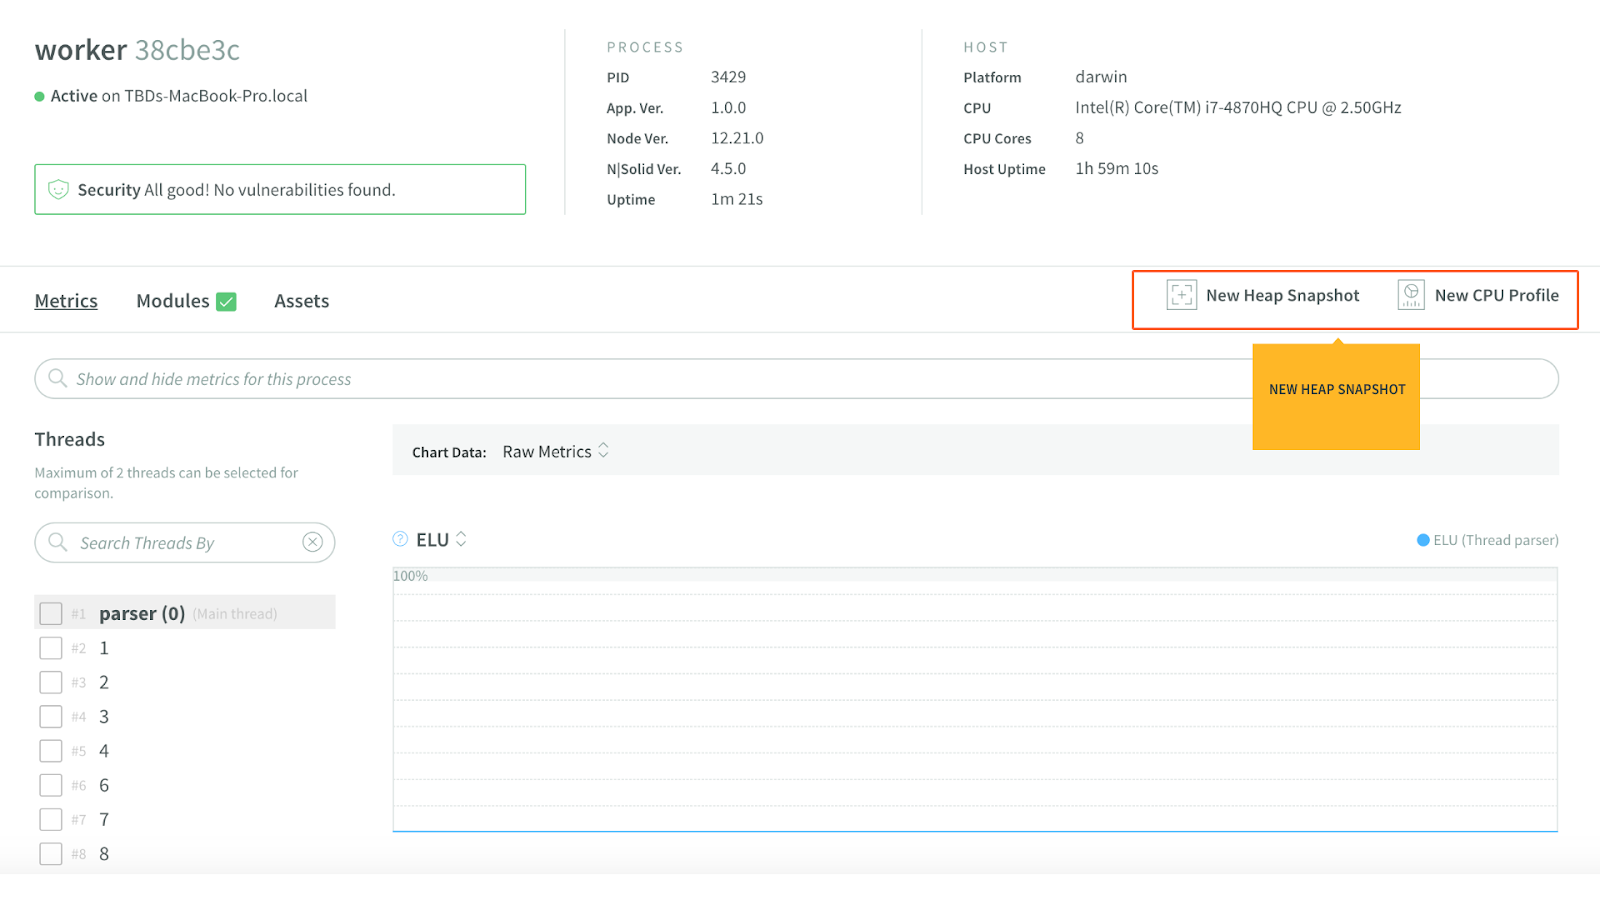
In the process details screen we can see a new metric: Event Loop Utilization or ELU which is the ratio of time the event loop is not idling in the event provider to the total time the event loop is running.
We are featuring ELU as the main metric because ELU is similar to but more reliable than CPU when indicating the health of the process. Especially if using Worker threads. To find more about this metric, you can read this blog post or the oficial documentation.
In the left panel inside the N|Solid console we can see the list of threads that are running in the process, in this case 5.
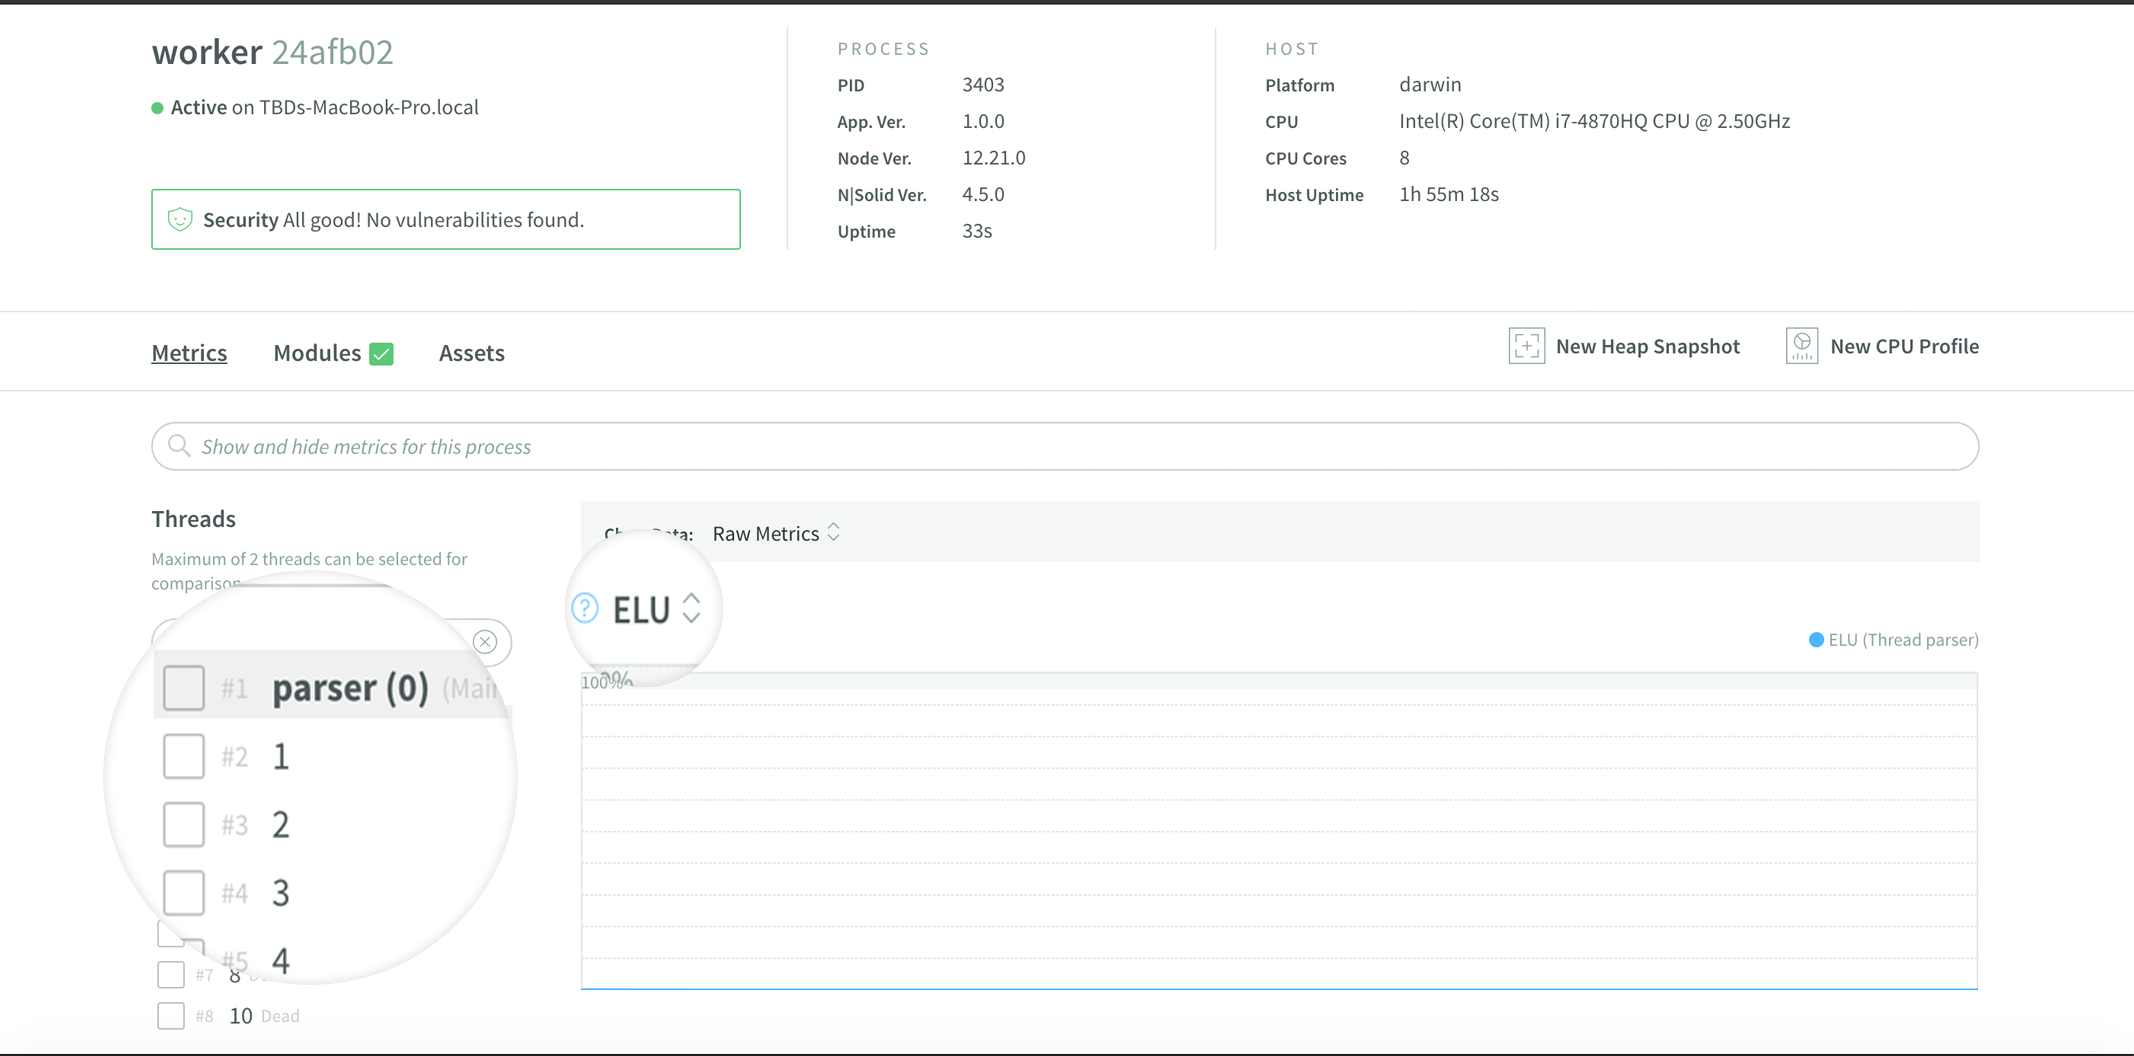
The main thread will always be 0 and each thread is named after its id (if you prefer, you can change the id by names using the N|Solid JavaScript API). To learn about how to use the N|Solid JavaScript API read this blog post.
The threads that are shown as “dead”, (in this case thread #3) are threads that have already finished their execution while the process is running. You can still see the metrics of those not longer active threads.
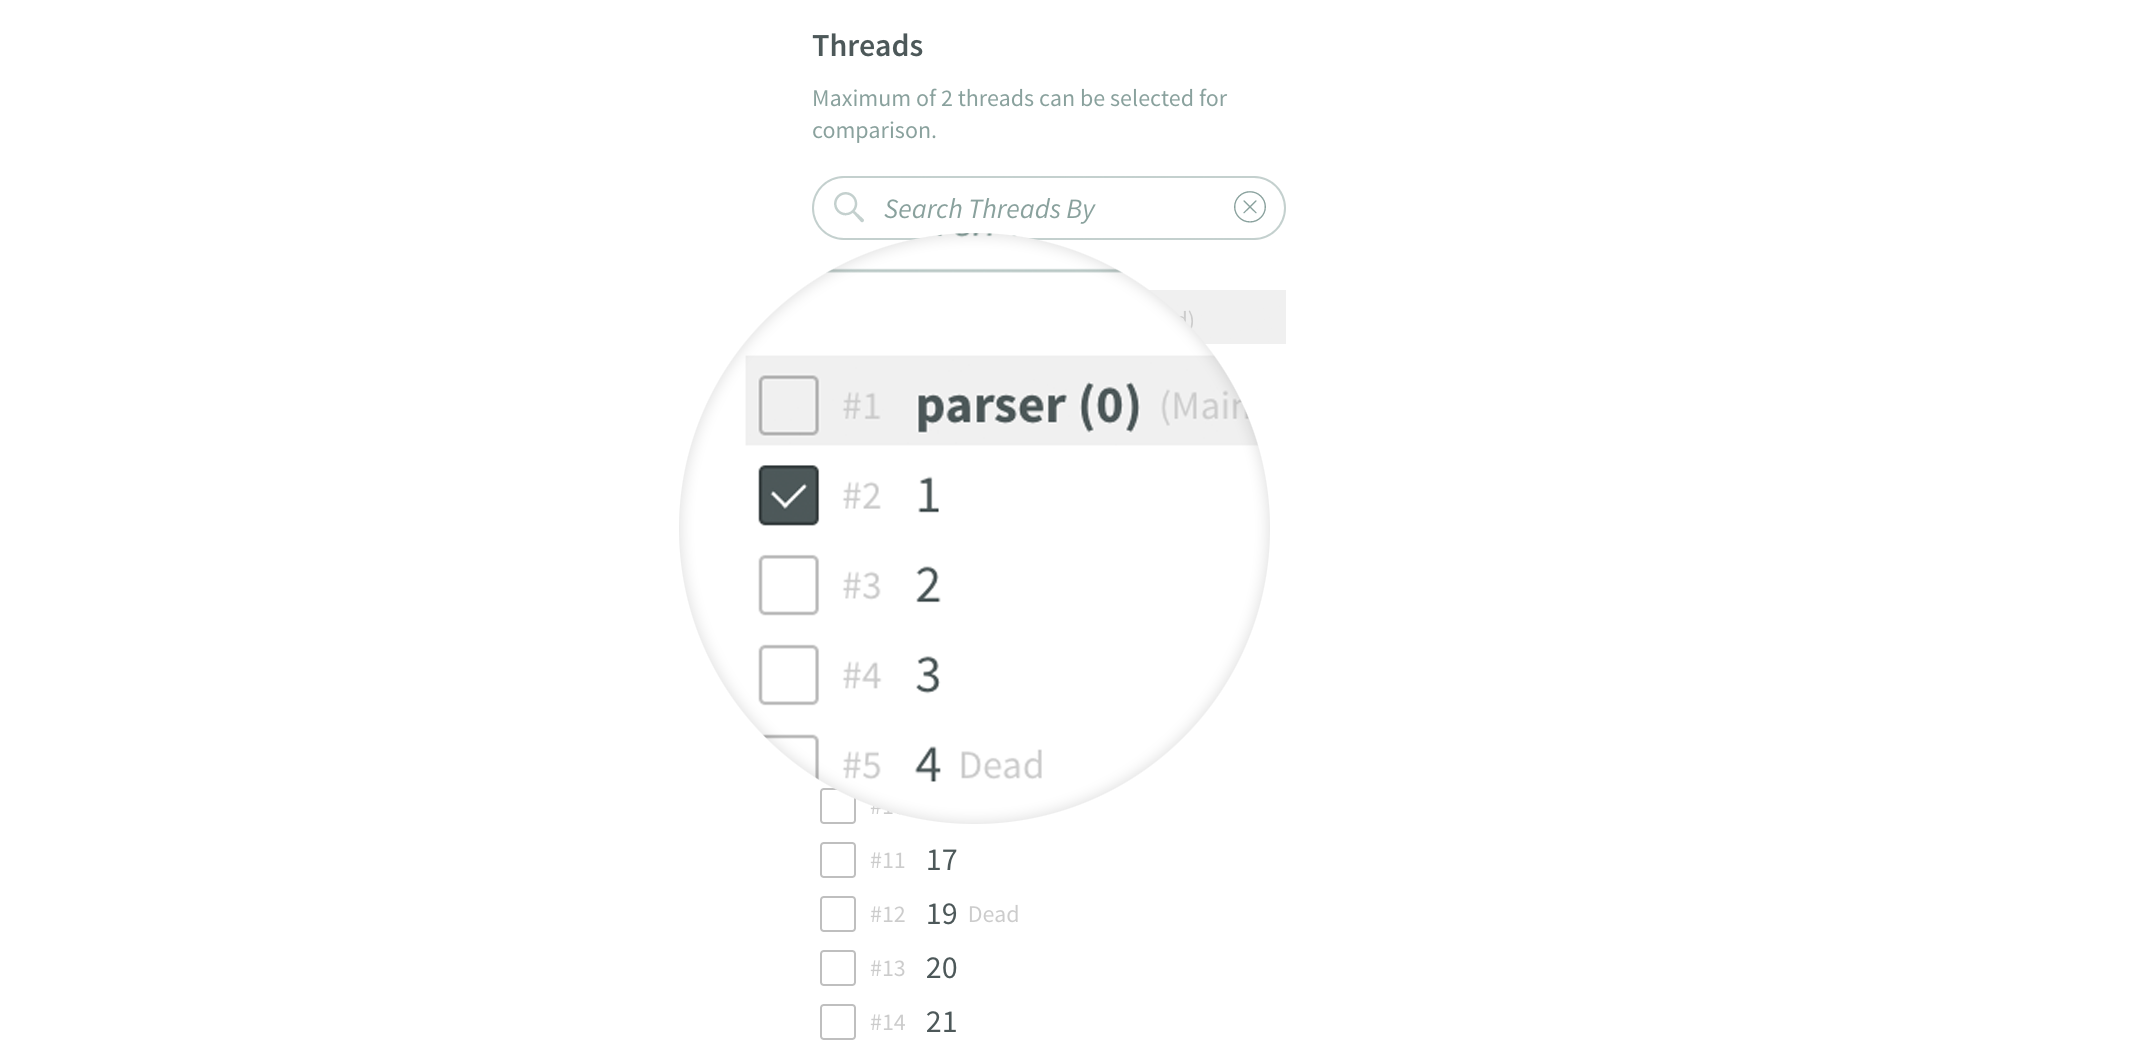
To see the information and all the metrics of one specific thread, click the thread id or name, as it’s shown in the image below:
You can also compare any 2 threads just by clicking on them:
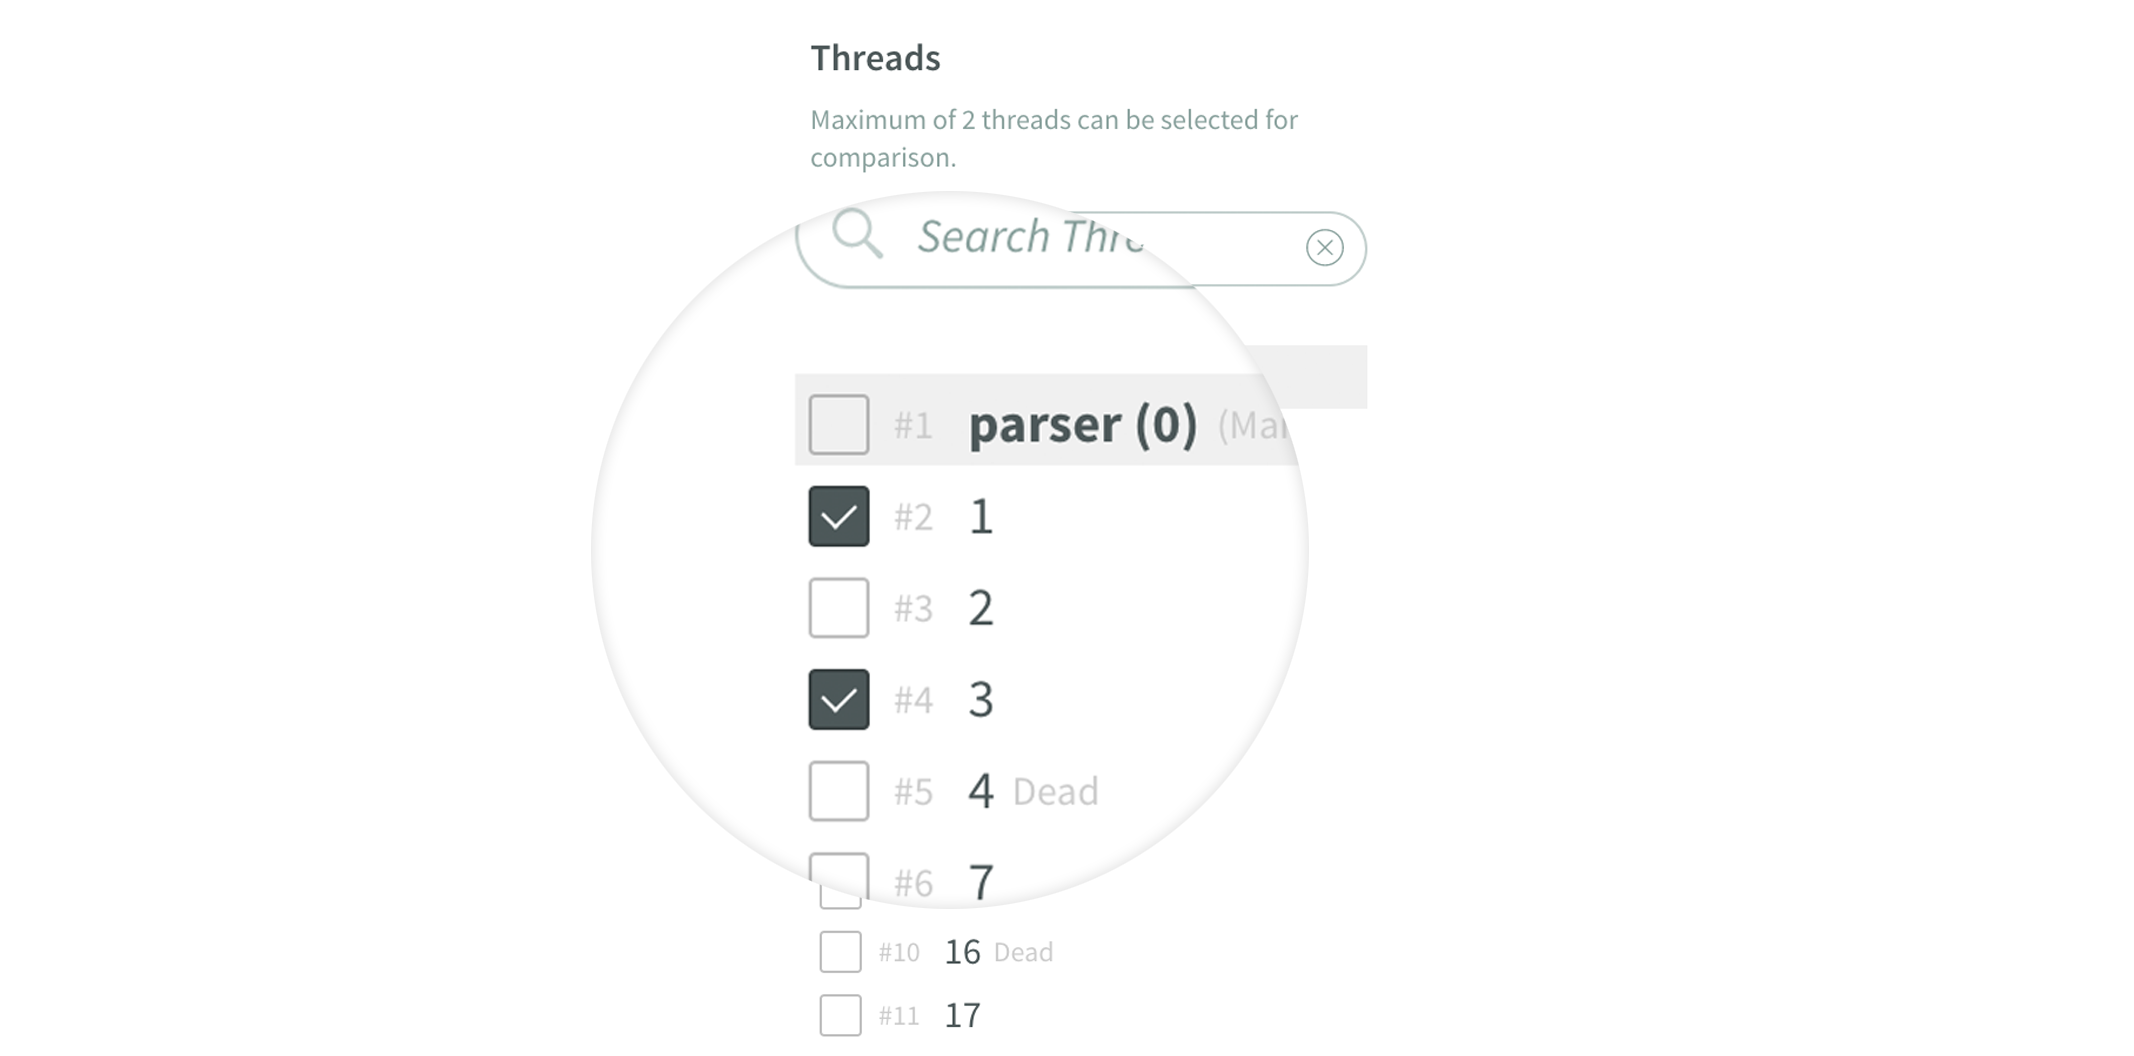
And on the process details you will be able to see each metric differentiated by the two selected threads in different colors as is shown below.
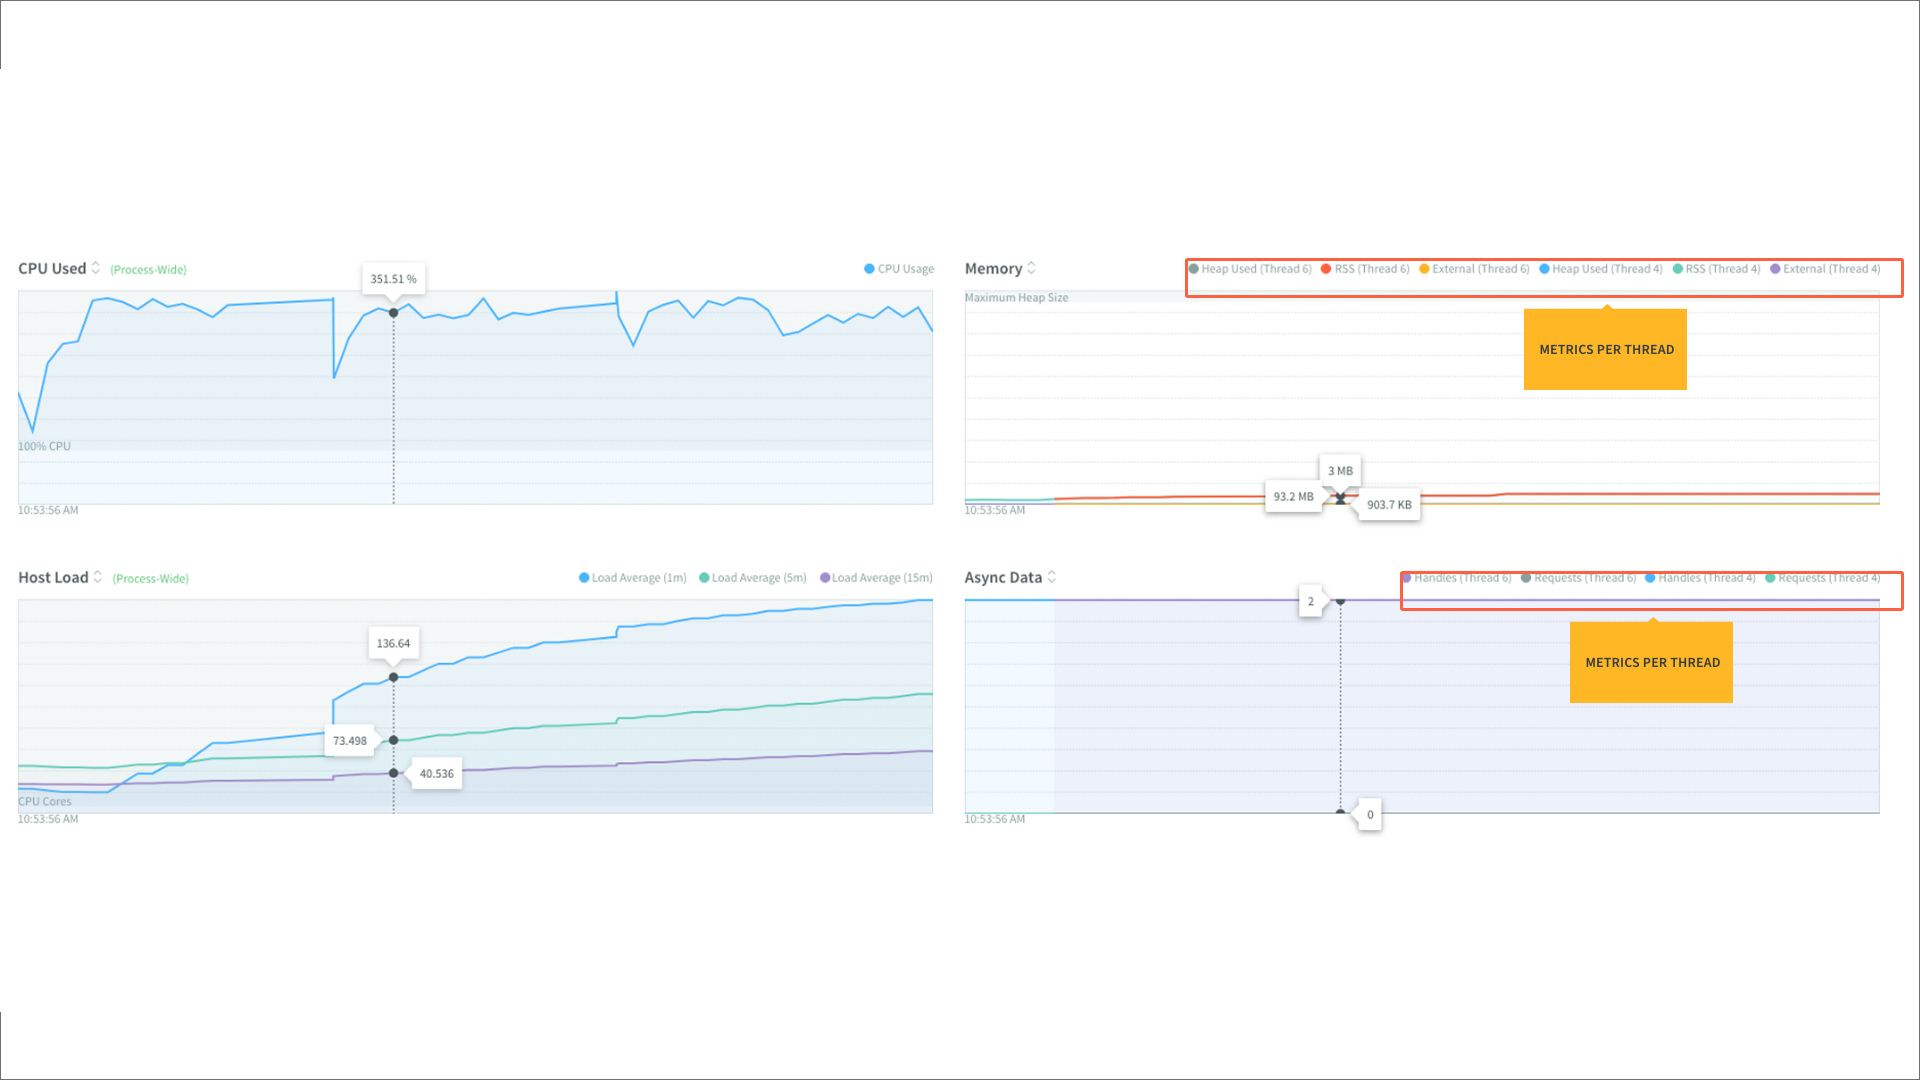
If you don’t select any thread it will show all the metrics from the main thread.
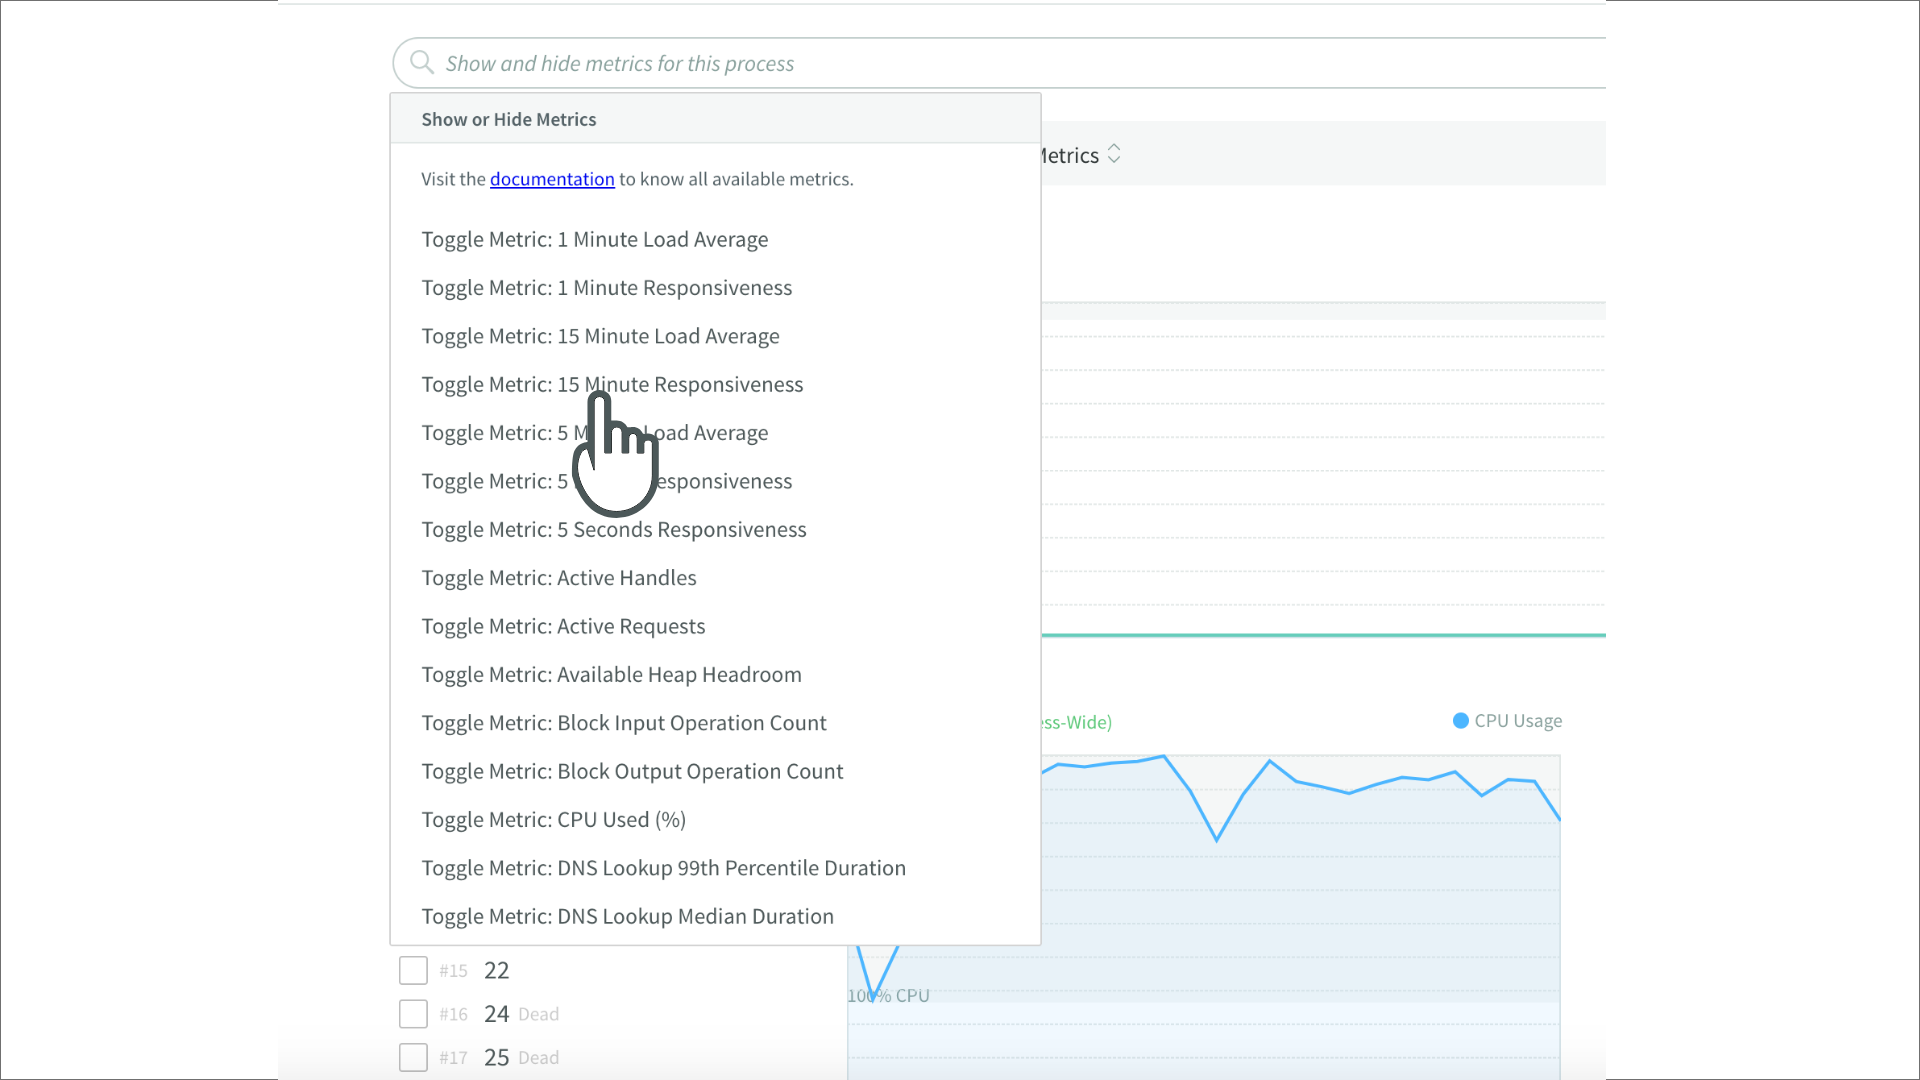
If you click the magnifying glass icon of “Show and hide metrics for this process, you can see the other metrics that are available for the processes:
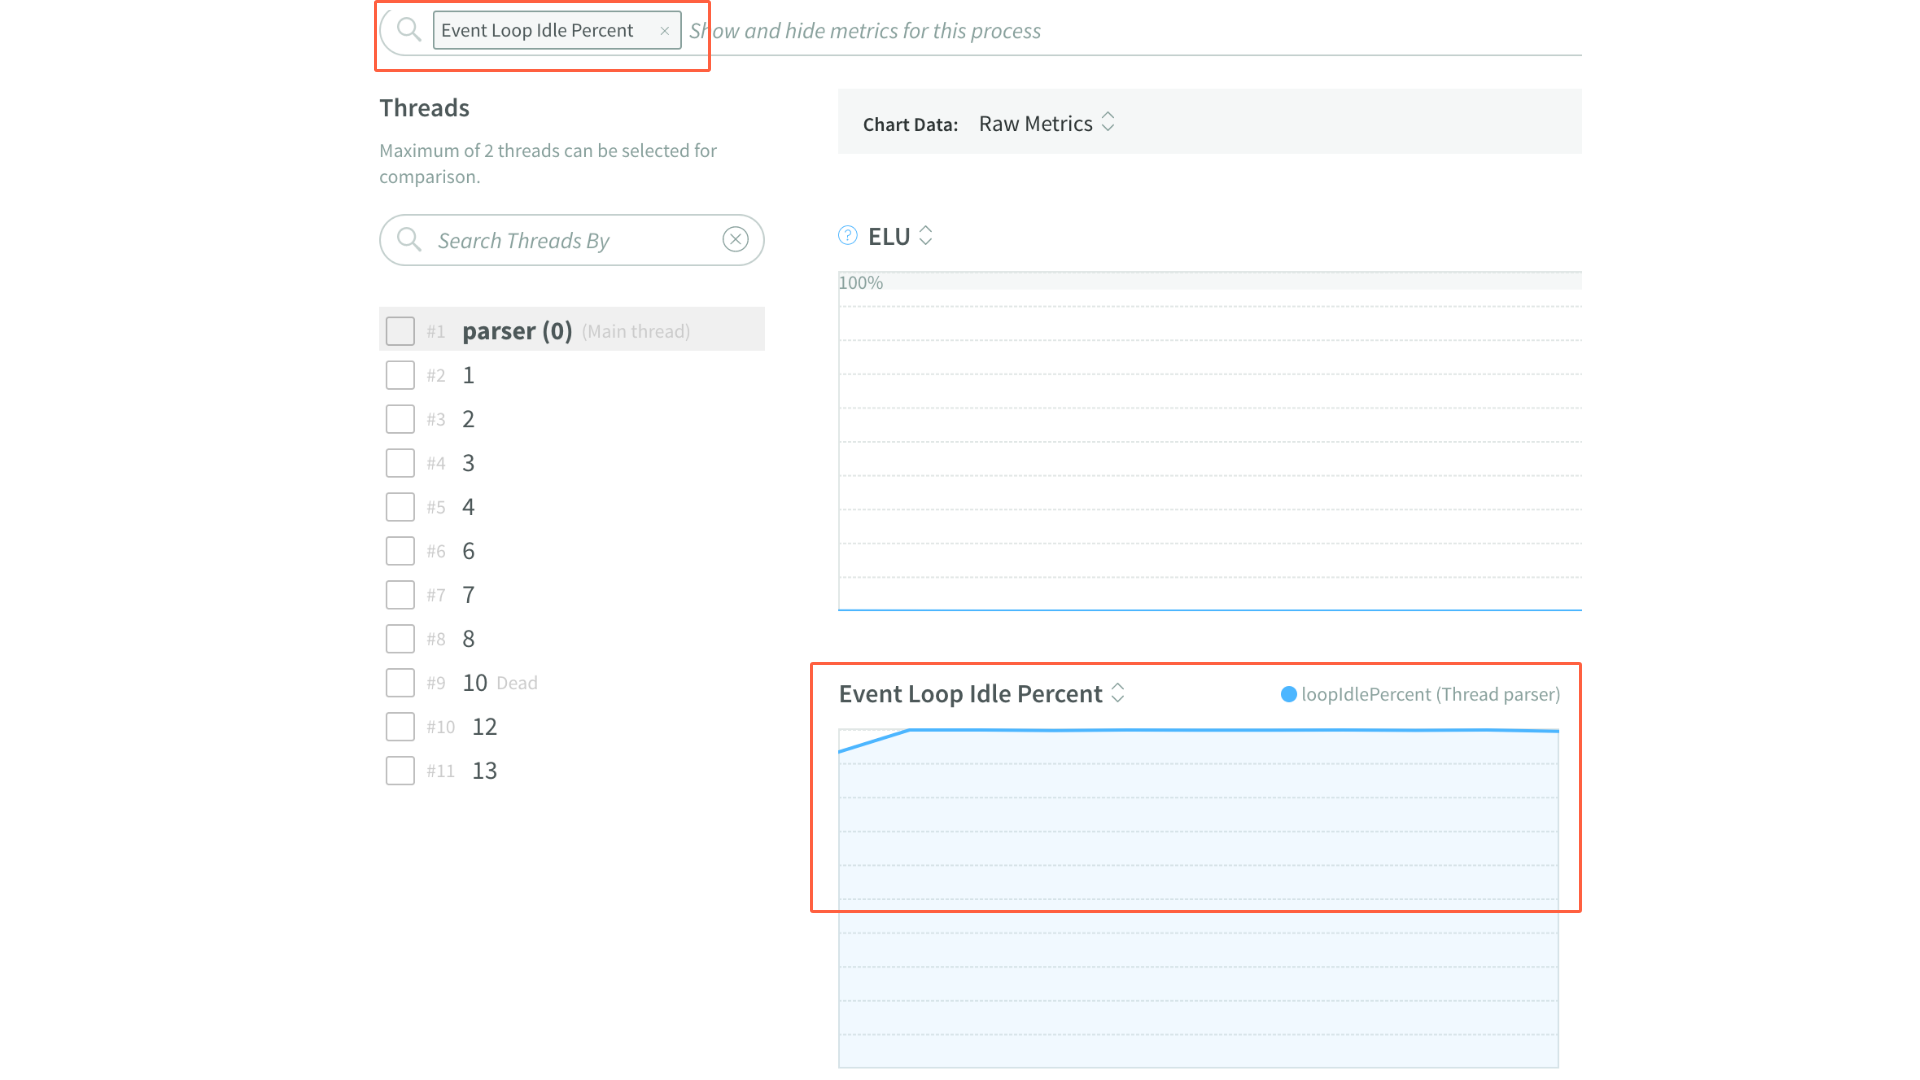
For example if you select Event Loop Idle Percent, you will be able to see the metric as is shown below.
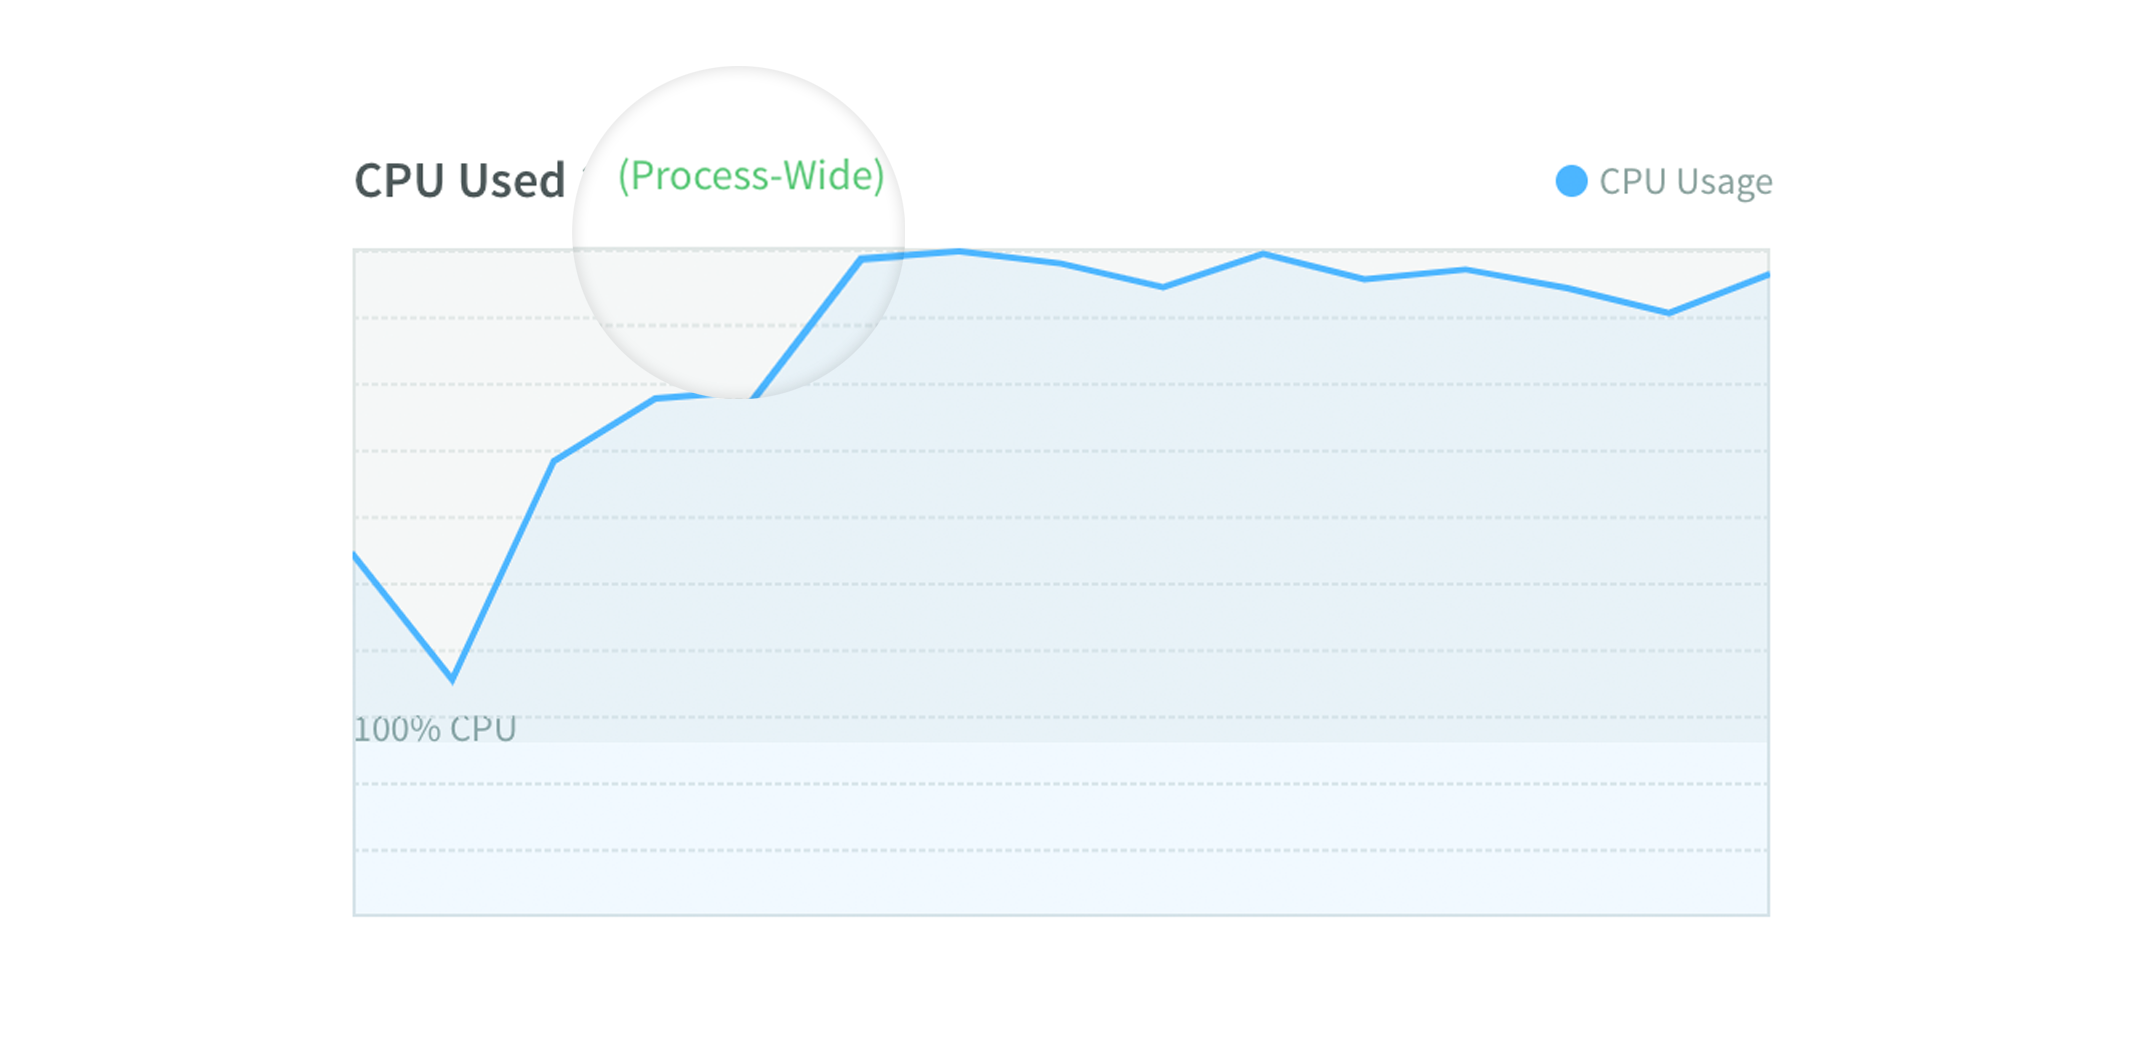
The metrics that have the label “Process Wide” such as CPU Used, means that this metric is the same for all the threads, it doesn't change if you switch metrics per thread or compare them, because they are shared across all the threads inside the process.
Heap Snapshot and CPU profile per thread
In the right top corner you can find the “New Heap Snapshot” and “New CPU profile” button.
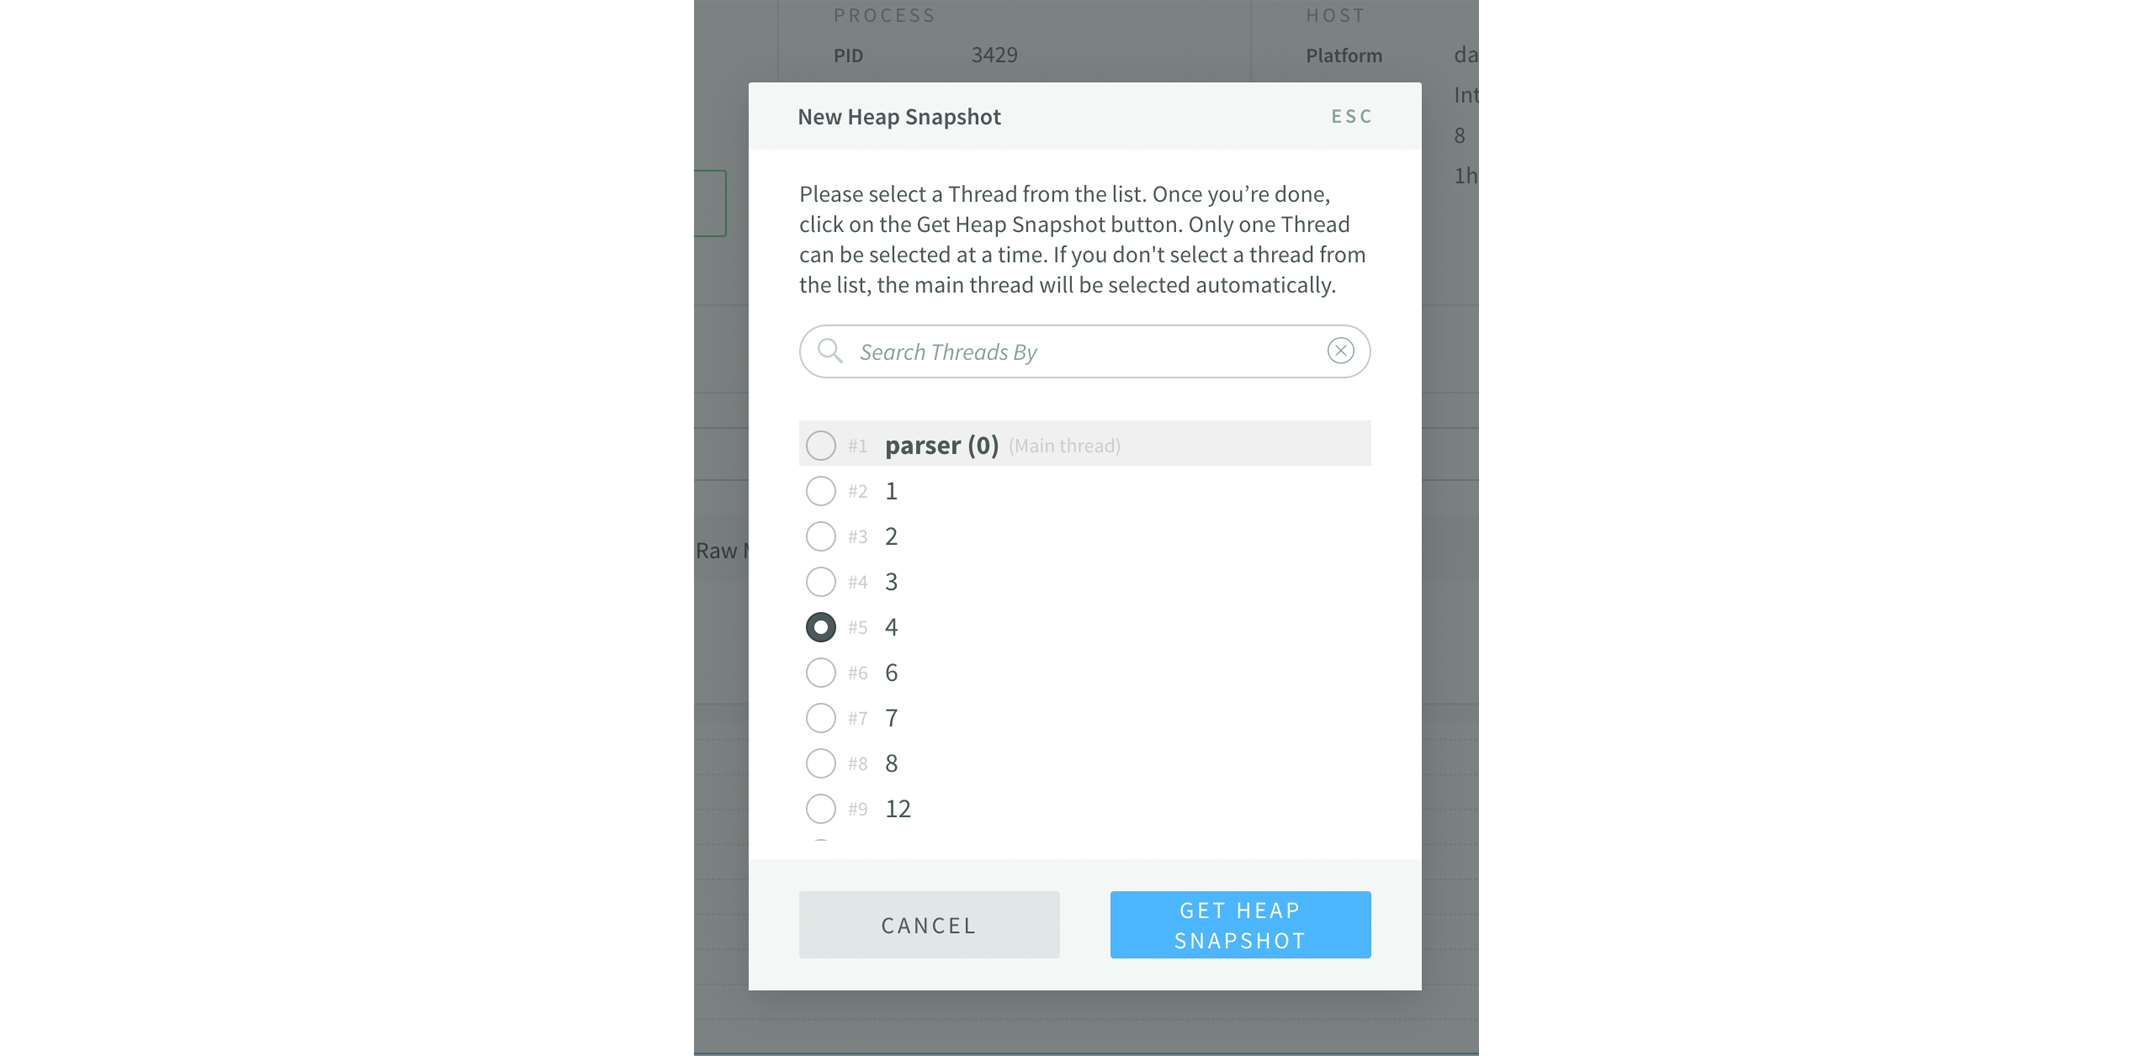
If you click the New Heap Snapshot button, you can take a heap snapshot for the main thread or specific thread by selecting the thread from the list and clicking the “Get Heap Snapshot” button. Only one thread can be selected at a time. If you don’t select a thread, the main thread will be selected by default.
This can be very useful if you think a specific thread is consuming a lot of CPU or any other resource, you can select that thread and take a snapshot, in this case thread #2.
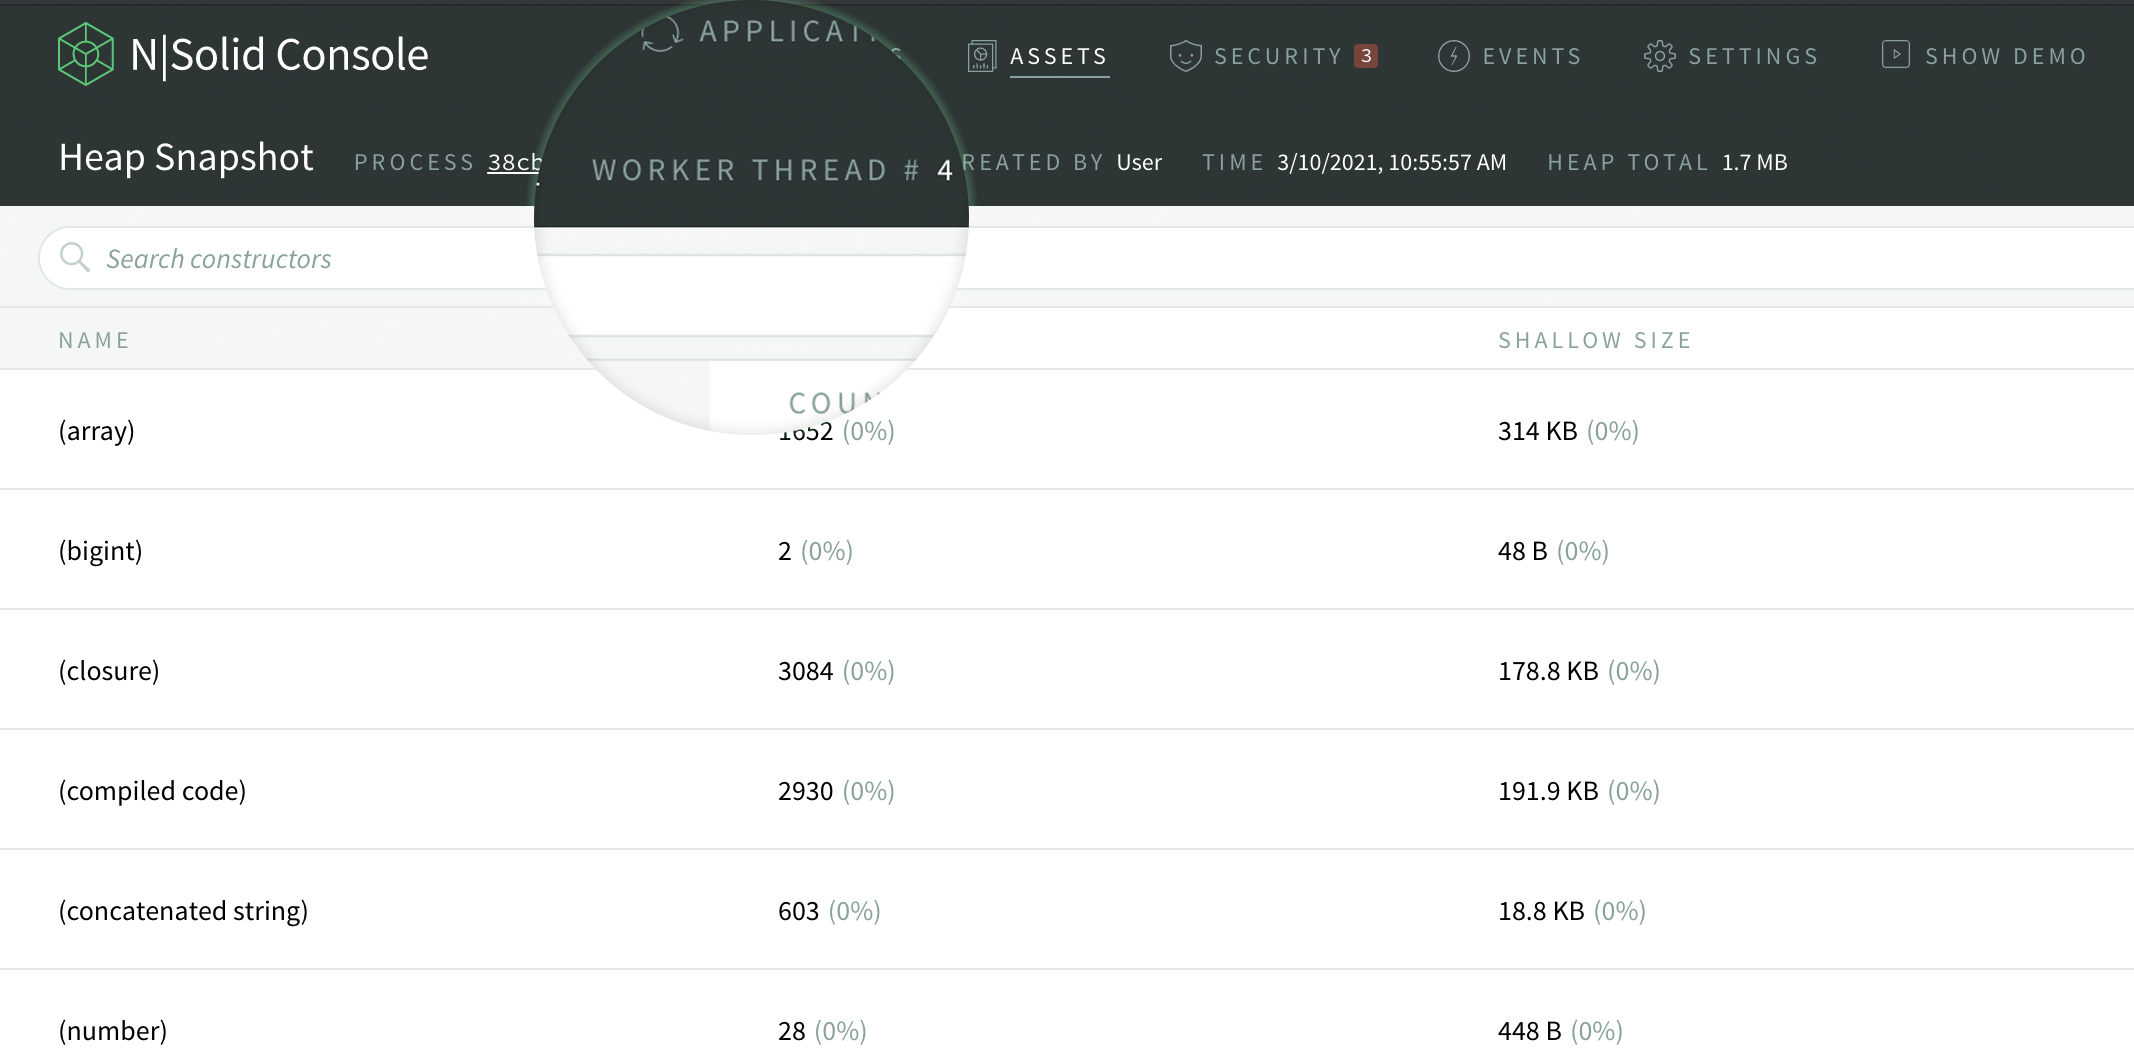
And now you can see the heap snapshot of that specific thread as you can see below:
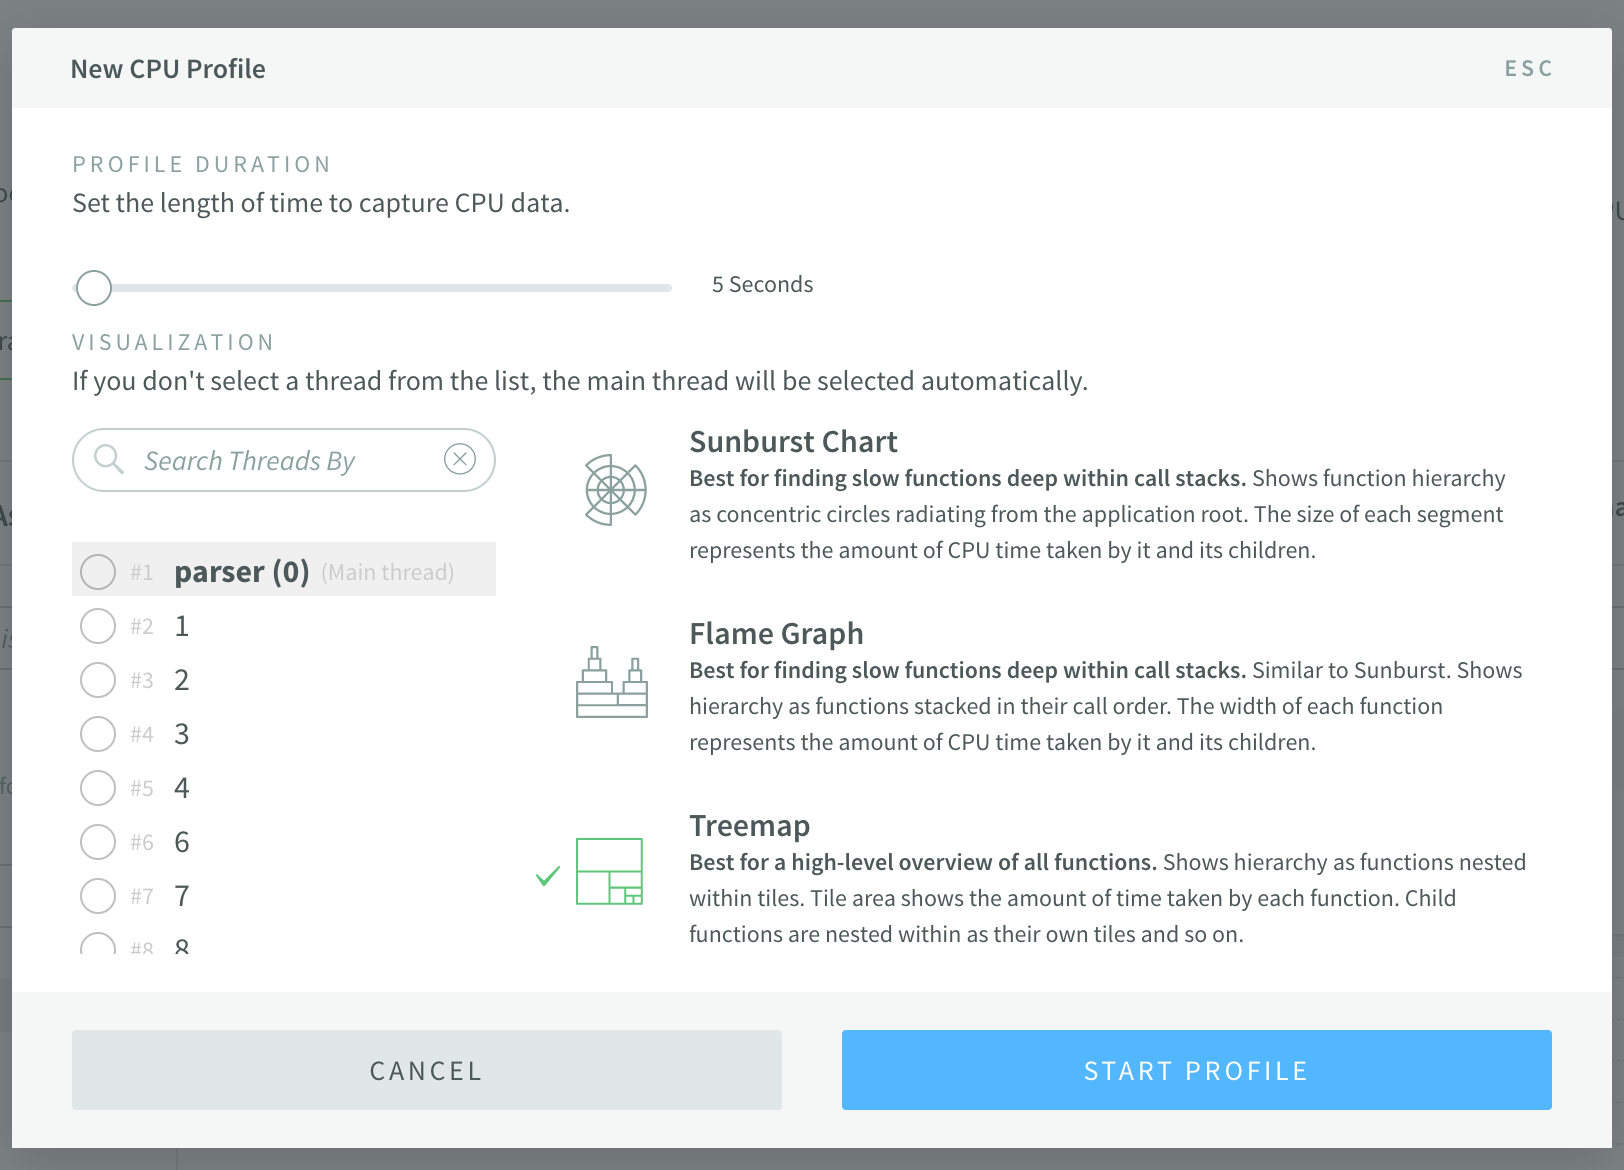
If you want to take a CPU profile, it will be the same, just select the thread you want to get the CPU profile from and click “Start Profile”. You can only select one thread and if no thread is selected the main thread will be chosen by default.
CLI
You can also use the CLI to take heap snapshots of a thread, by passing the flag --id [process_id] and the thread id --threadId=”4” If no thread Id is passed, it will take the main thread as default.

Need a helping hand?
If you have any questions, please feel free to contact us at info@nodesource.com or in this form.
To get the best out of Node.js, start a free trial of N|Solid, an augmented version of the Node.js runtime, enhanced to deliver low-impact performance insights and greater security for mission-critical Node.js applications. #KnowyourNode