HTTP Tracing in N|Solid [4/10] The best APM for Node, layer by layer
Using Tracing
In Node.js, you can centralize tracing information generated by V8, Js code, and userspace code.
"Tracing can be enabled with the --trace-event-categories command-line flag or by using the node:trace_events module."
Directly in the APMs, tracing means that you will have a detail of each flow in your application's process; this means that you will have records available of each time a function is called or a database or external information is called.
With tracing, you will have a way to capture, visualize and analyze traces across complex architectures, including architectures that use monoliths and microservices.
With N|Solid HTTP Tracing, you can enable and disable when you want the tracing to occur, —you can read more here fromRelease N|Solid V4.6 👉. This way, you can debug slow services or related errors and get out of bottlenecks quickly by finding the entry points to review the trace view and thus understand the whole picture.
When tracing is activated in N|Solid, it provides visibility of your application's actions at the HTTP and DNS levels. Information for every HTTP transaction and DNS request is collected, allowing us to know, for example, which specific HTTP requests are taking longer to process or whether a DNS server is too slow resolving specific domains.
Our tracing is performance-oriented; the observability we provide is the least expensive in terms of resources for the user. To obtain the observability of the processes, we spend fewer resources without having a high impact on CPU or Memory. Read the full documentation here
How does a developer use N|Solid tracing to understand application health and performance?
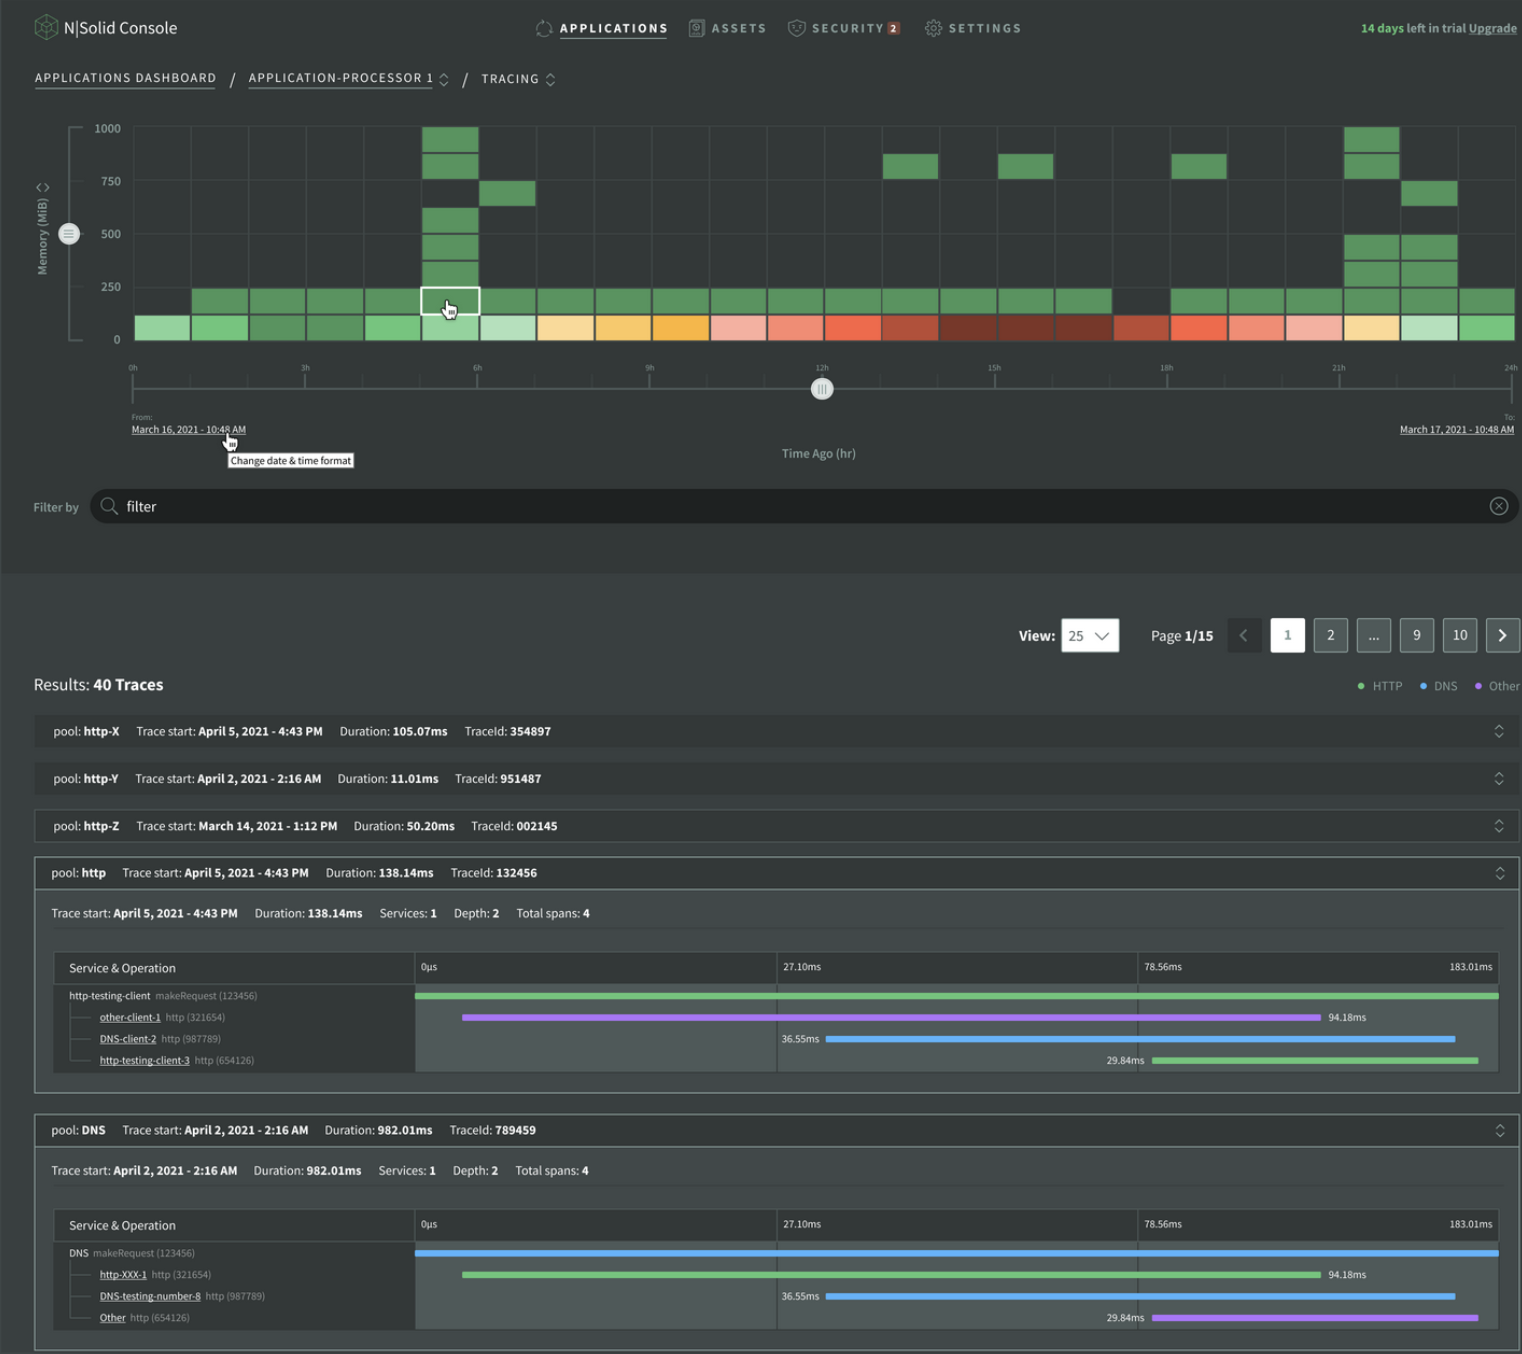 Img 1 - Tracing - N|Solid
With N|Solid you can consistently detect performance issues directly in the application. You can pinpoint what part of the service is causing the performance issue. You can also map the services part of your app, find points where performance can be improved, and choose to use tracing for single services or single application tracing. With N|Solid, what you get is less overhead!
Our implementation is according to the Opentelemetry standard. We can instrument every operation to the application; from our point of view, every operation is important. Some operations are automatically instrumented.
Why it's important, and how does N|Solid do better?
HTTP tracing helps developers pinpoint what part to analyze. With our product, you have complete control. You can turn this on/off; this separates us from others!
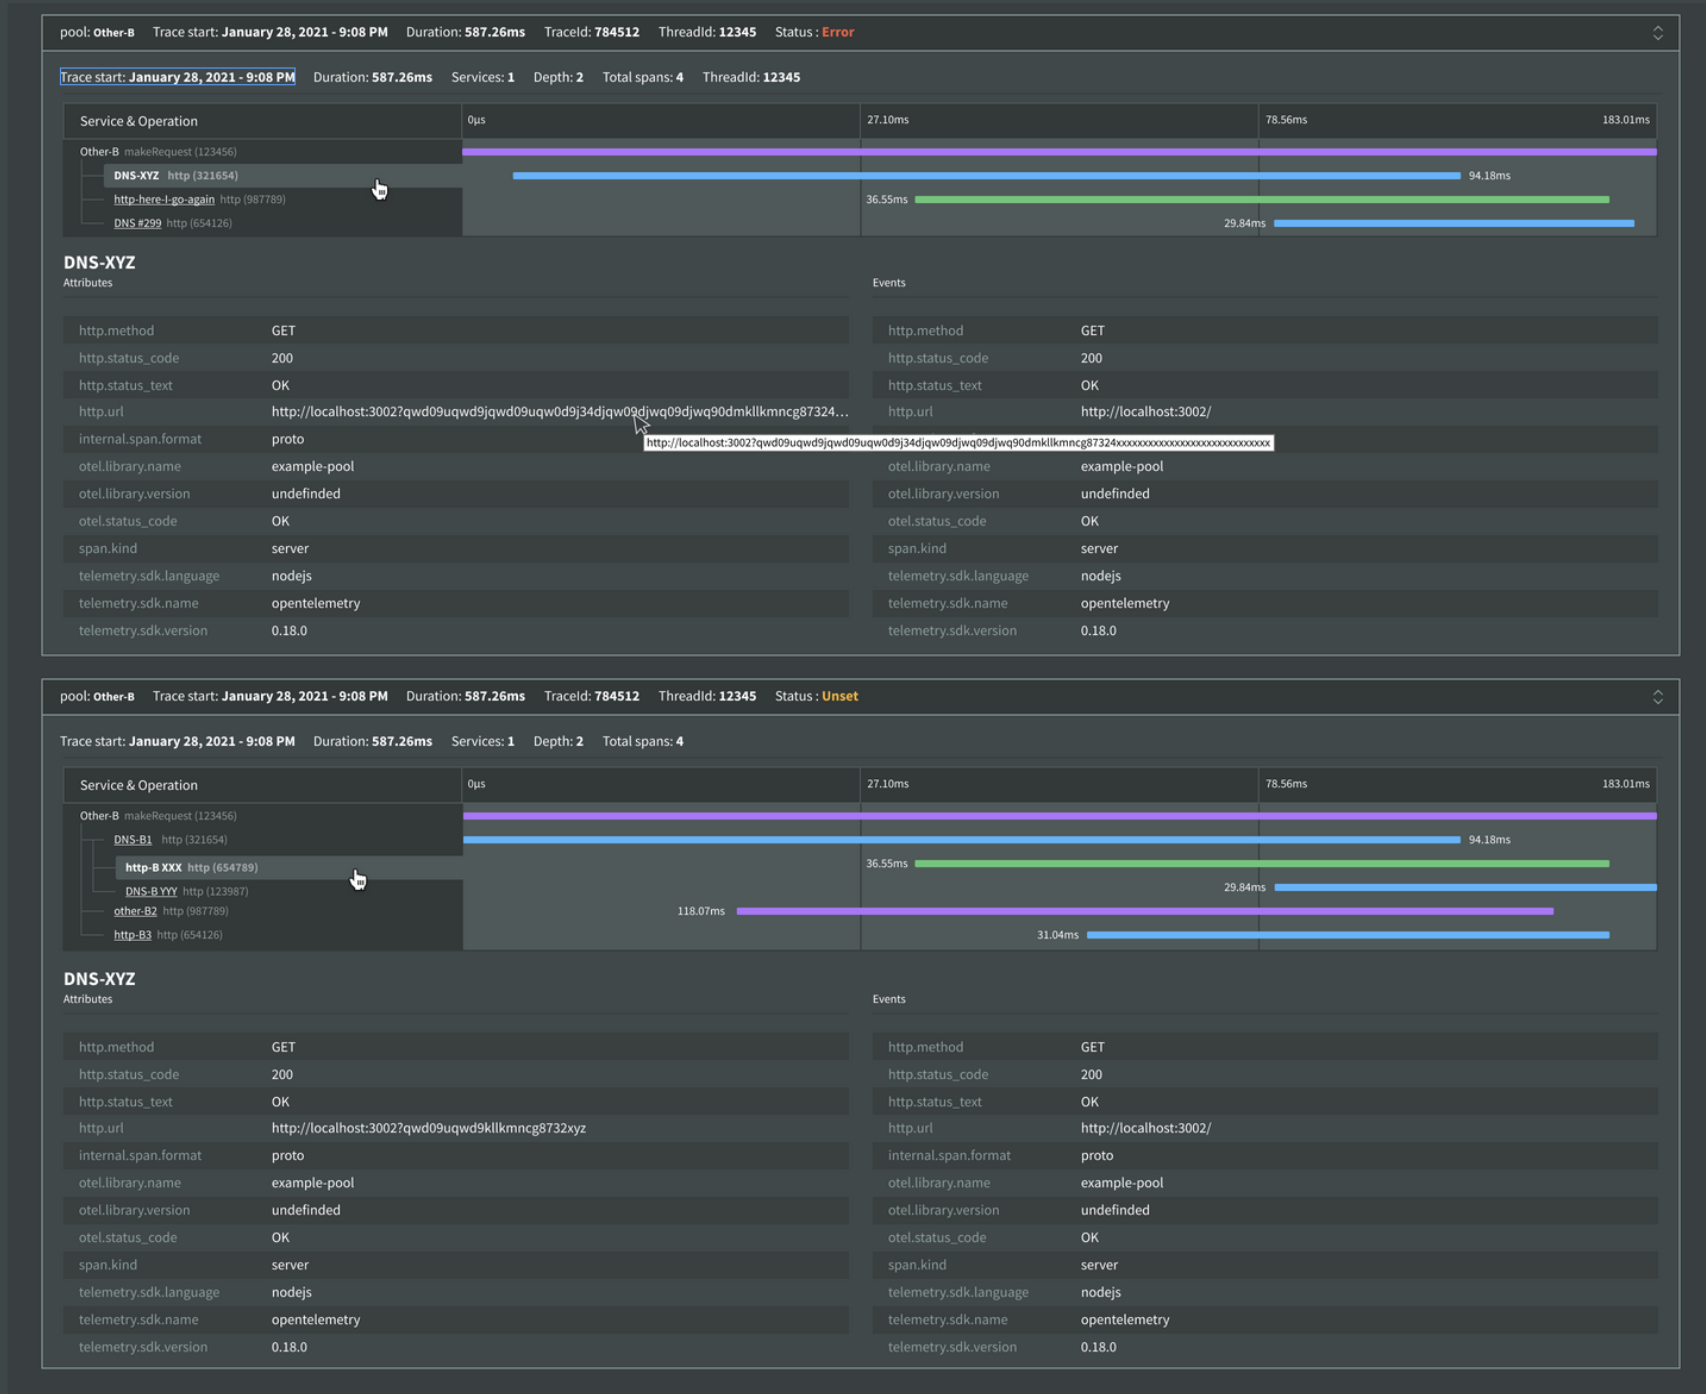 Img 2 - Tracing Expansion - N|Solid
As we explain, we follow the standards. With enterprise applications in mind, we create N|Solid to be resilient and achieve less overhead. We can add details to single app pieces. N|Solid can dig to the lowest level, and we can communicate with other APMs (Opentelementry*).
What is HTTP tracing?
It is a feature that provides a way to determine what exactly is happening with a request; this includes any form of authentication, which handler was used, and how long each step took in the pipeline. This functionality helps diagnose unexpected or undesirable behavior.
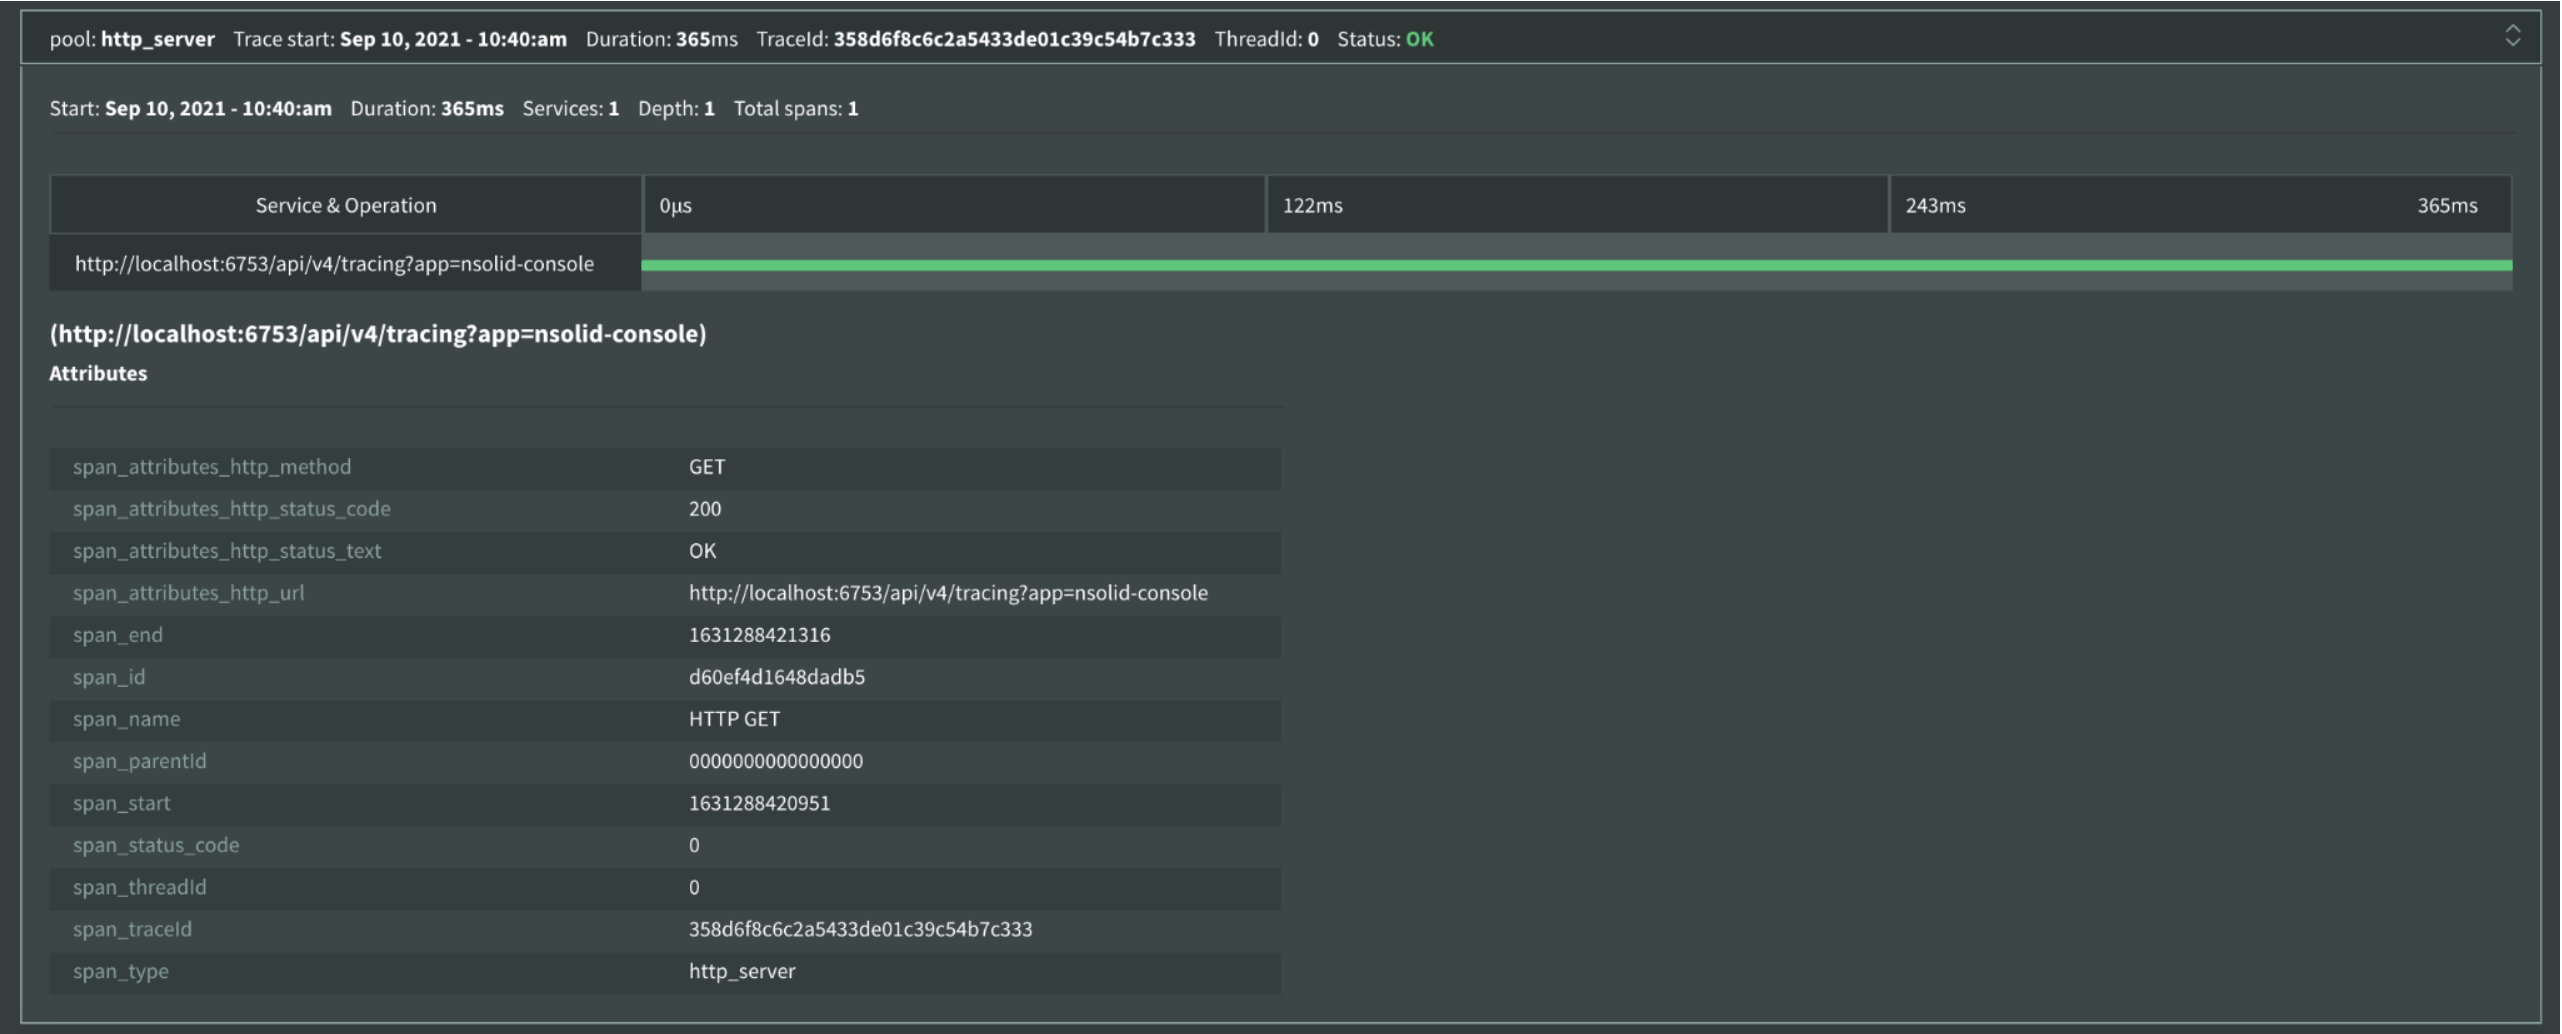 Img 3 - Tracing Result List View - N|Solid
- Advantage: Enables the ability to debug latency and other issues in applications.
- Benefit: Faster time to resolution of issues.
HTTP tracing gathers throughput and the lifecycle of any HTTP, DNS, or other request types.
- Debug latency issues monitor your services and more with the collected information.
- See in a timeline graph the density of the number of tracked spans.
- Inspect each span for more detail on the compiled trace.
- Filter the results by the attributes of a span and delimit them to the time range.
Demo Video — HTTP Tracing in N|Solid
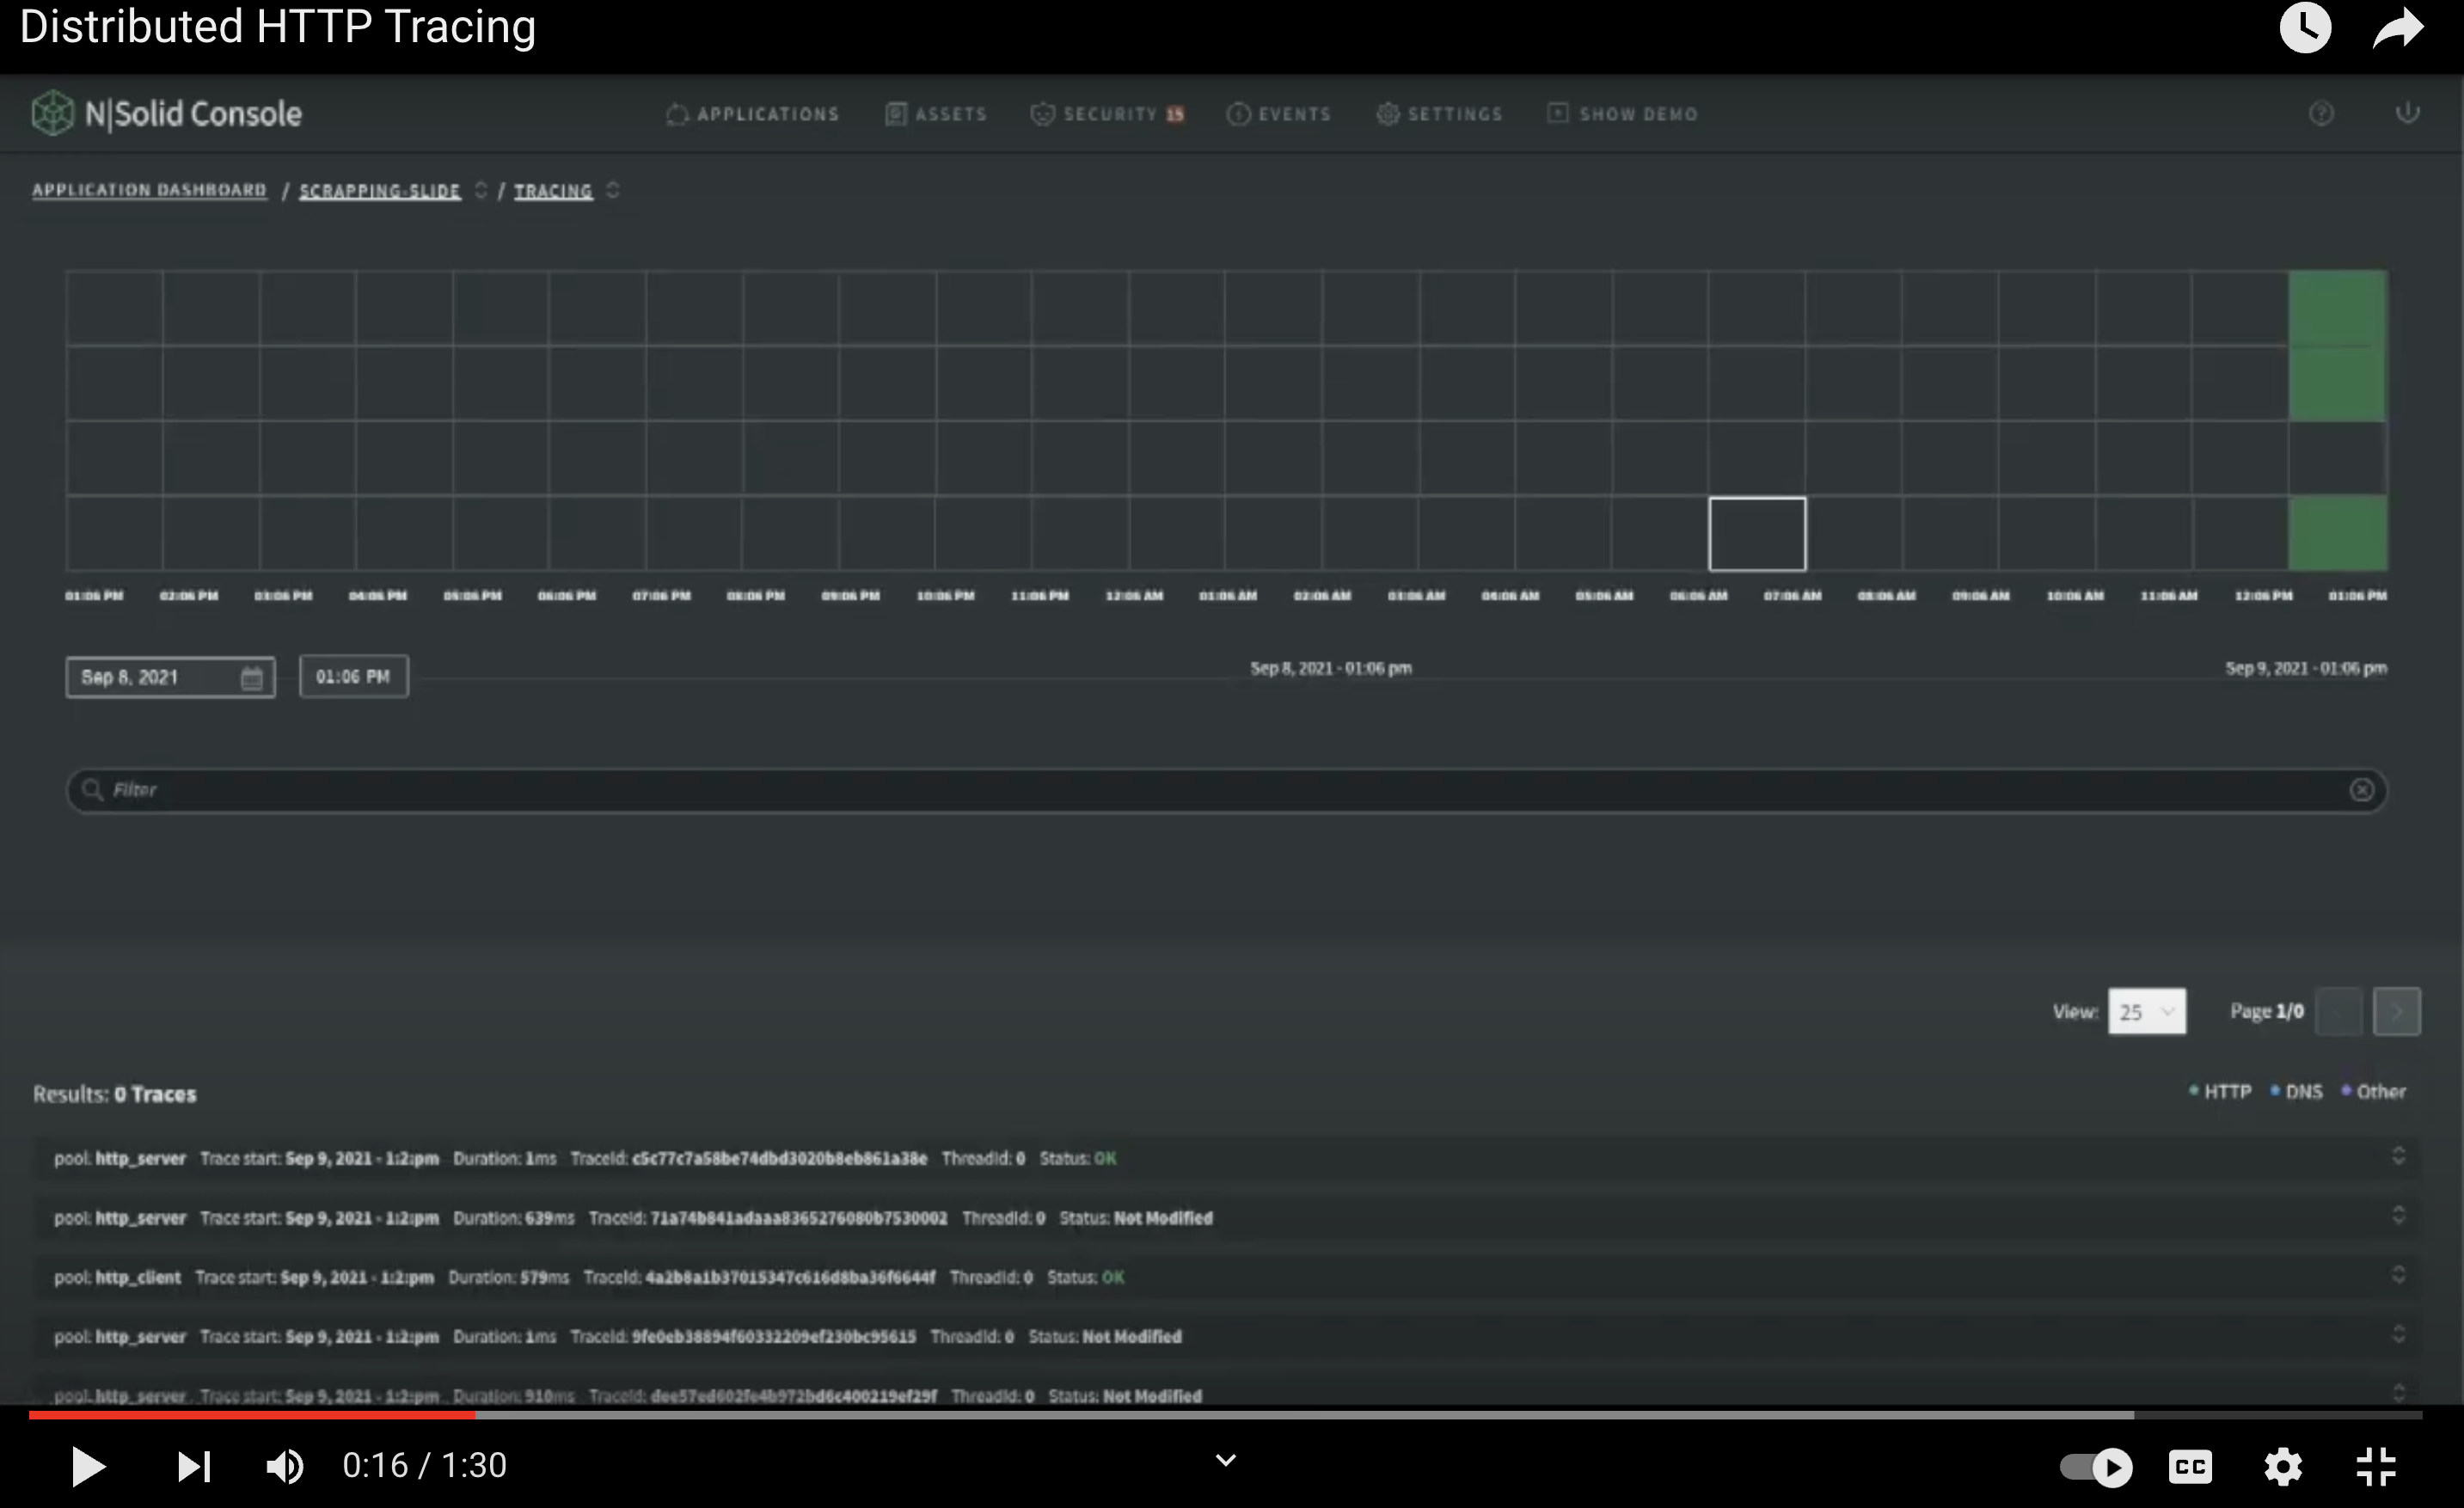
__NOTE: __ For a better experience, you can activate the closed captions in the video, they are available in English.
By activating Tracing, we can check the date and time. And you can apply filters to select traces according to HTTP, DNS, or Other. You can find a dropdown in the display with date, duration, services, Depth, and total span.
Right there, you can review the service, operation, and response. Also, you can check the attributes.
In the tracing filters we can choose Id, hostname, tags, attributes_http:method, attributes_http_status_code, attributes_http_status_text, and many more.
In this demo, we choose attributes_http_status_text to filter the traces that meet that parameter.
Want to try N|Solid?
Do it right now! 🏃🏿♂️🏃♀️, We release in Openjs World 2022 some codes to redeem 50% in 8 or 12 processes in our SaaS version.
50% OFF USING:
- 8 processes OPENJS-8T
- 12 processes OPENJS-12T
Or sign up for our FREE option for 4 processes and get started with N|Solid!
To check out the top 10 features and more in N|Solid, sign up to create your account or sign in at the top right corner of our main page. More information is available here.