CPU Profiling in N|Solid [3/10] The best APM for Node, layer by layer
Analize your Application in Detail with CPU Profiles
Review your applications in detail with CPU Profiles in N|Solid and find opportunities for Improve code. You can use the CPU Profiler tool in N|Solid to see which processes consume the most percentage of CPU time. This functionality can give you an accurate view of how your application is running and where it is taking up the most resources.
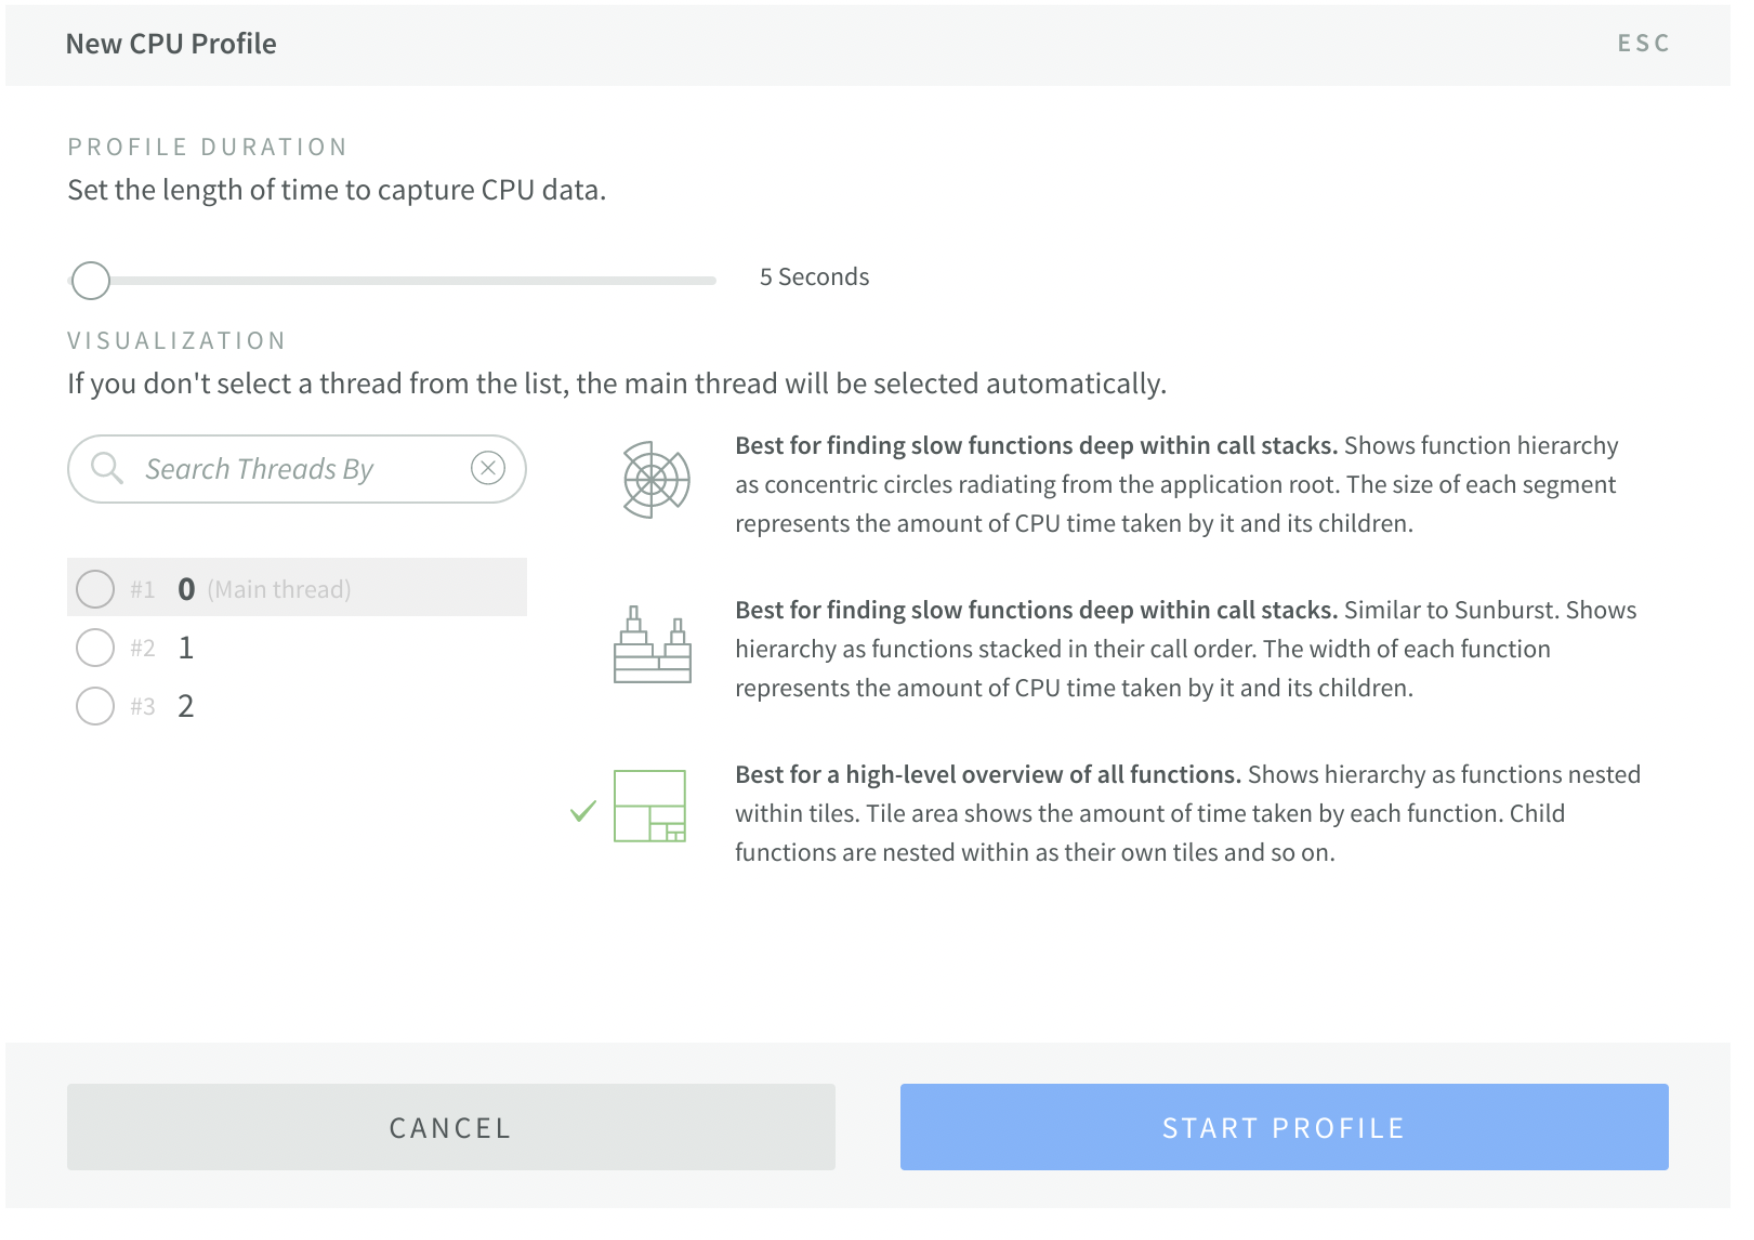 Img 1 - New CPU Profile - N|Solid
The CPU Profiling is an effective way to understand what’s happening in your application or processes. A CPU Profile requires visualization, it’s impossible to understand without; that’s why N|Solid includes the Sunburst Chart, Flame Graph, and Treemap.
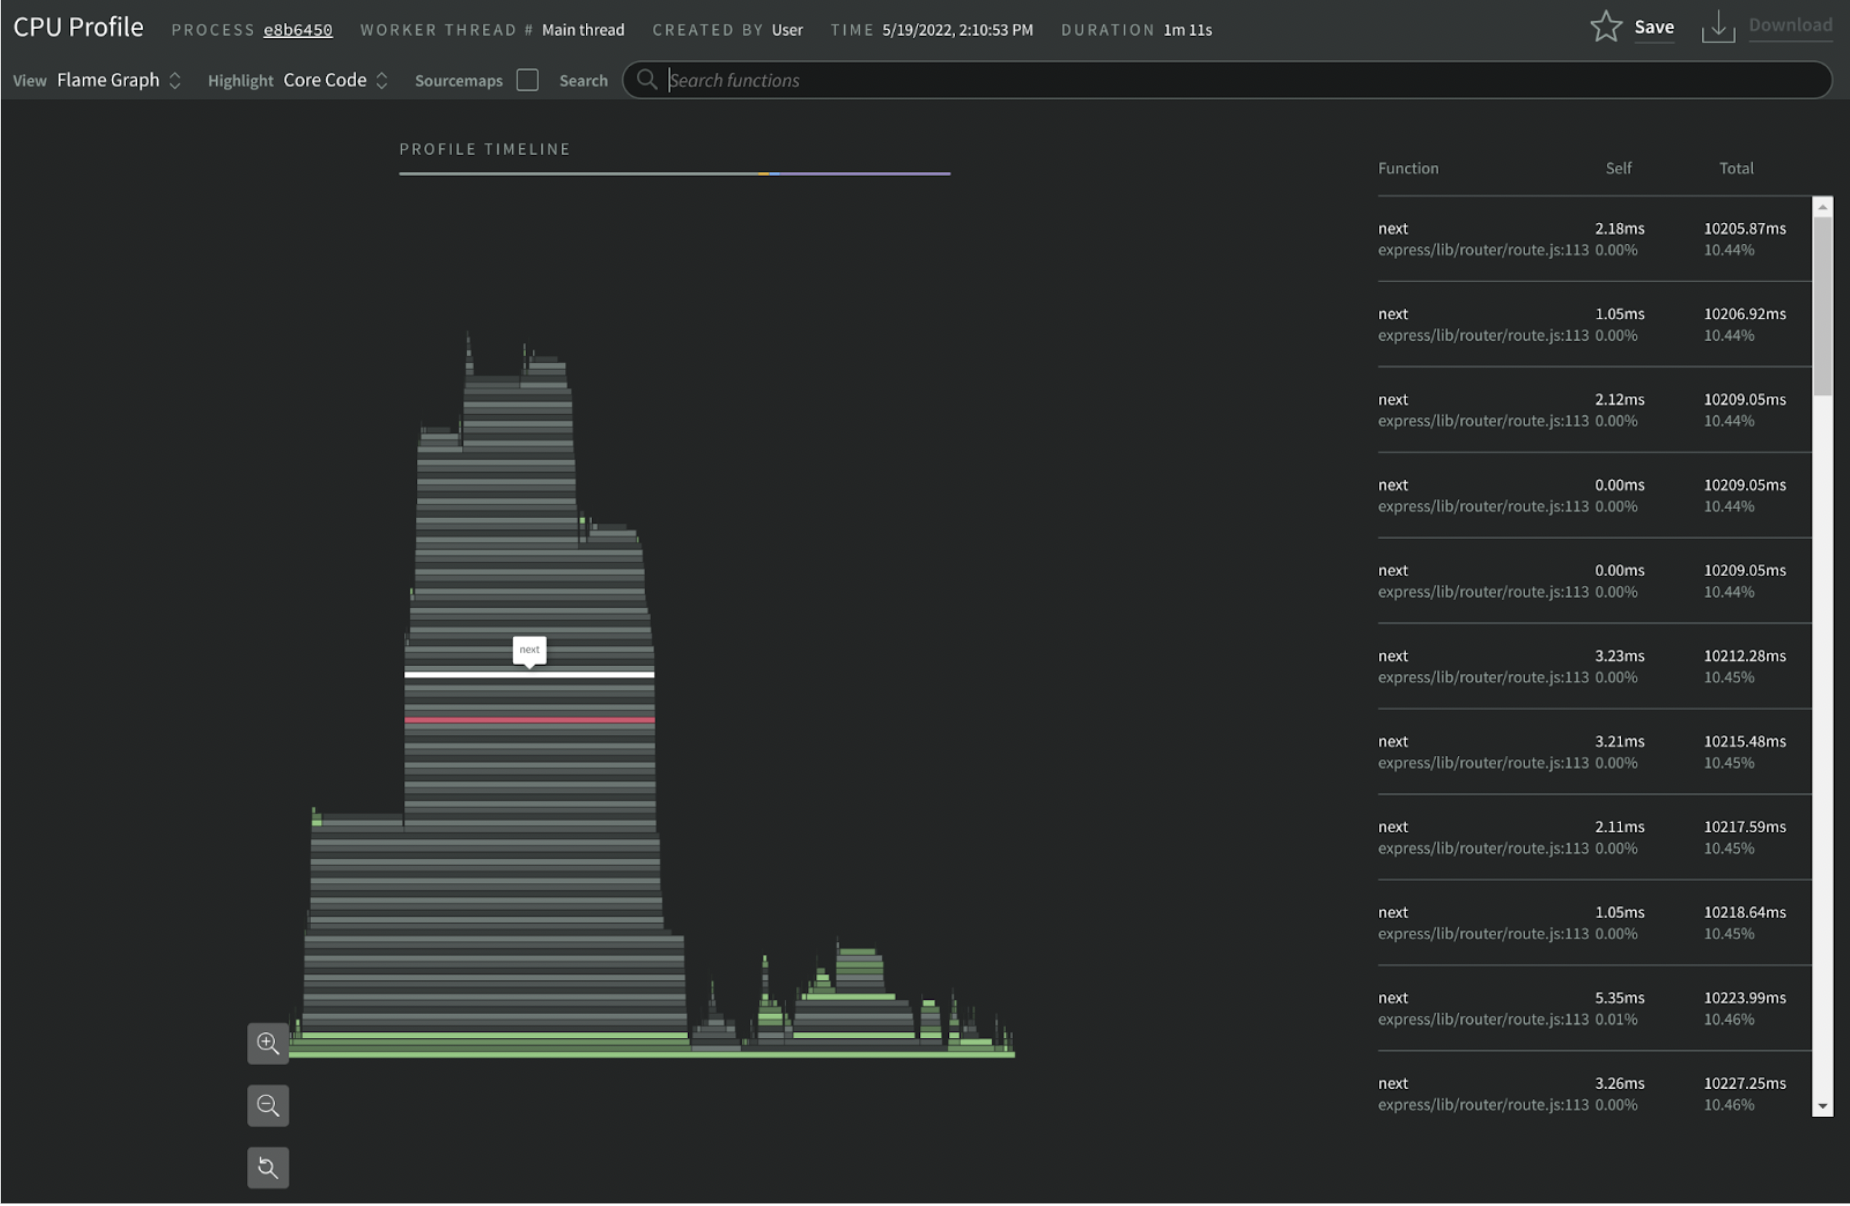 Img 2 - Flame Graph - CPU Profile - N|Solid
With N|Solid you can look at different visualizations to help us understand issues and impact. The most common visualization is the Flame Graph with two dimensions Y axis (Time), X axis, which shows pinpoints of a specific function.
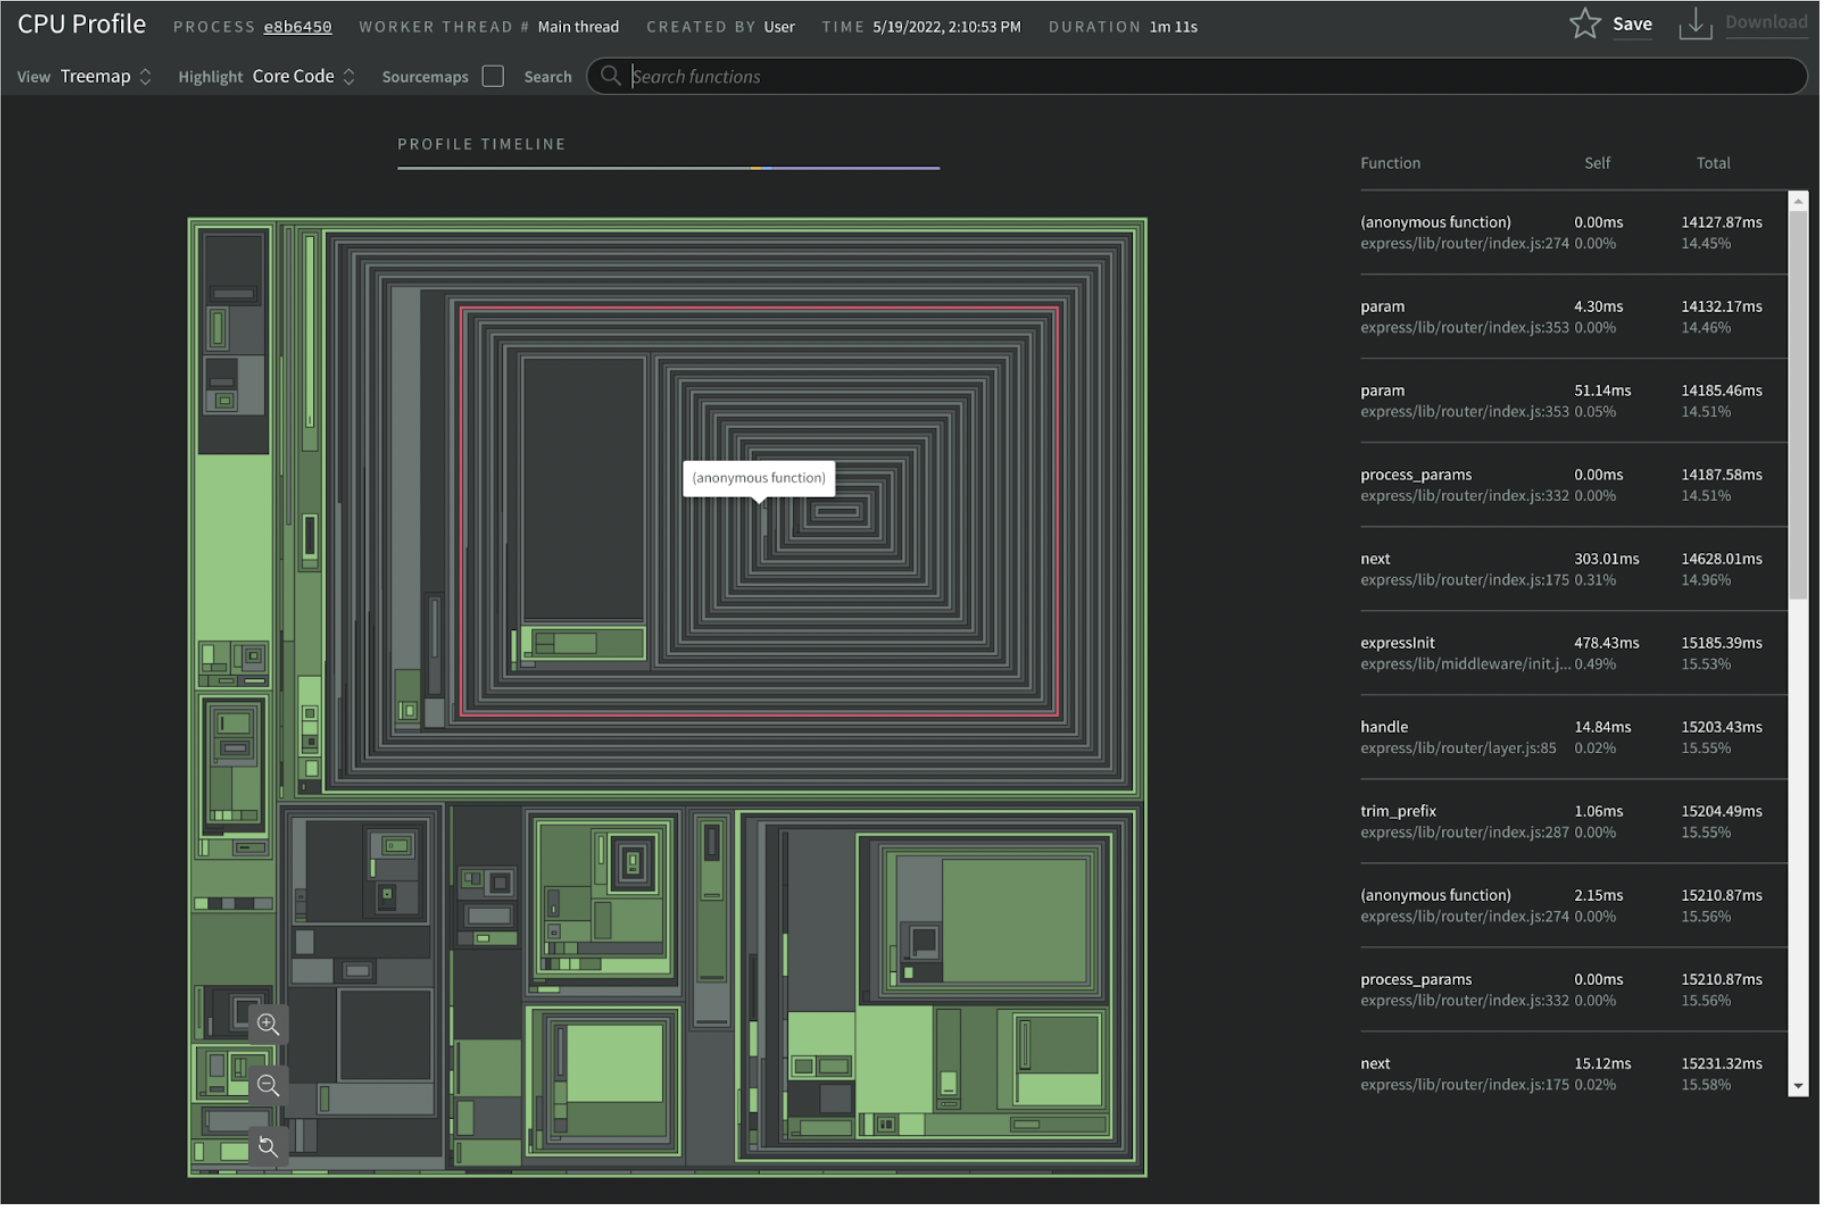 Img 3 - Treemap - CPU Profile - N|Solid
This functionality shows us not only What the slowest code has been executed at the time of the CPU, but also code that has an excessive execution and even code that calls things unnecessarily. Which execution stack calls the most time. This feature allows you to use other types of visualization such as Sunburst(dif representation of data), or a Treemap if we prefer this visualization (with the same information).
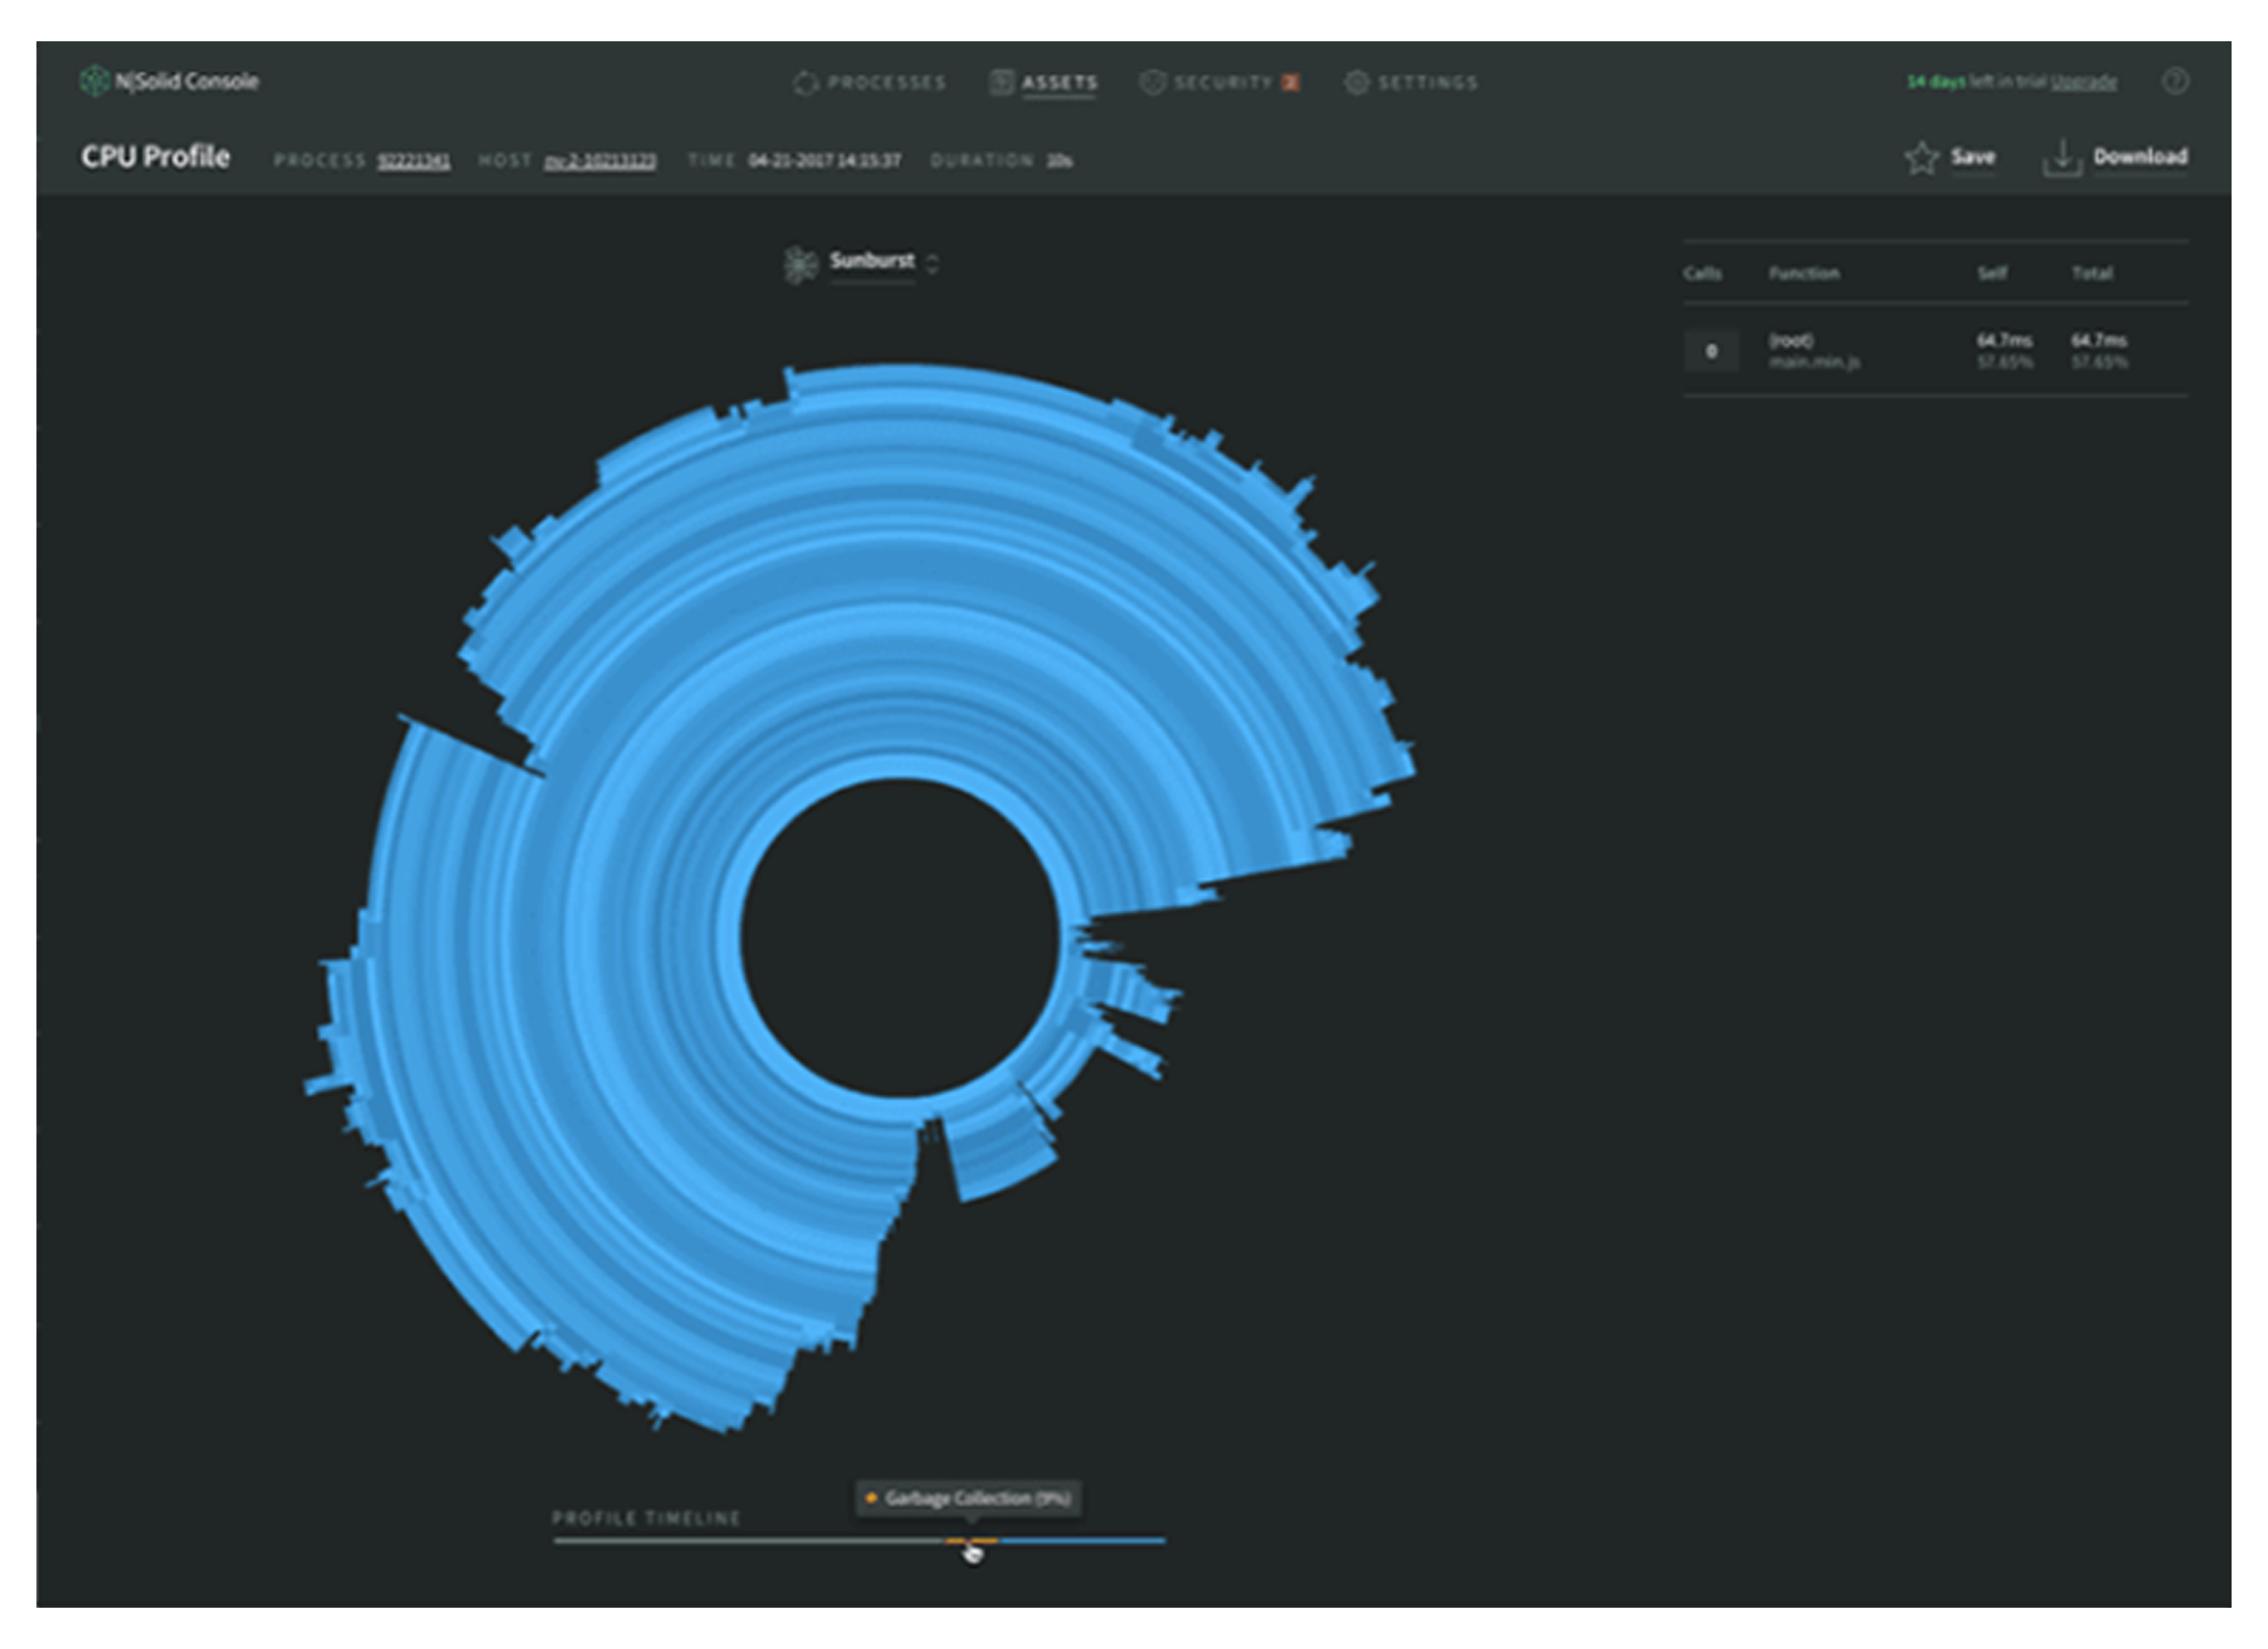 Img 4 - Sunburst - CPU Profile - N|Solid
The uniqueness of N|Solid is the ease of taking the CPU profile and how we filter the profile to generate the Flame Graph that’s easier to reason about. We can take CPU profiles of a worker thread on the fly, that’s mean we can create a CPU profile for each thread. ***No other software in existence could take a Worker Thread in production.
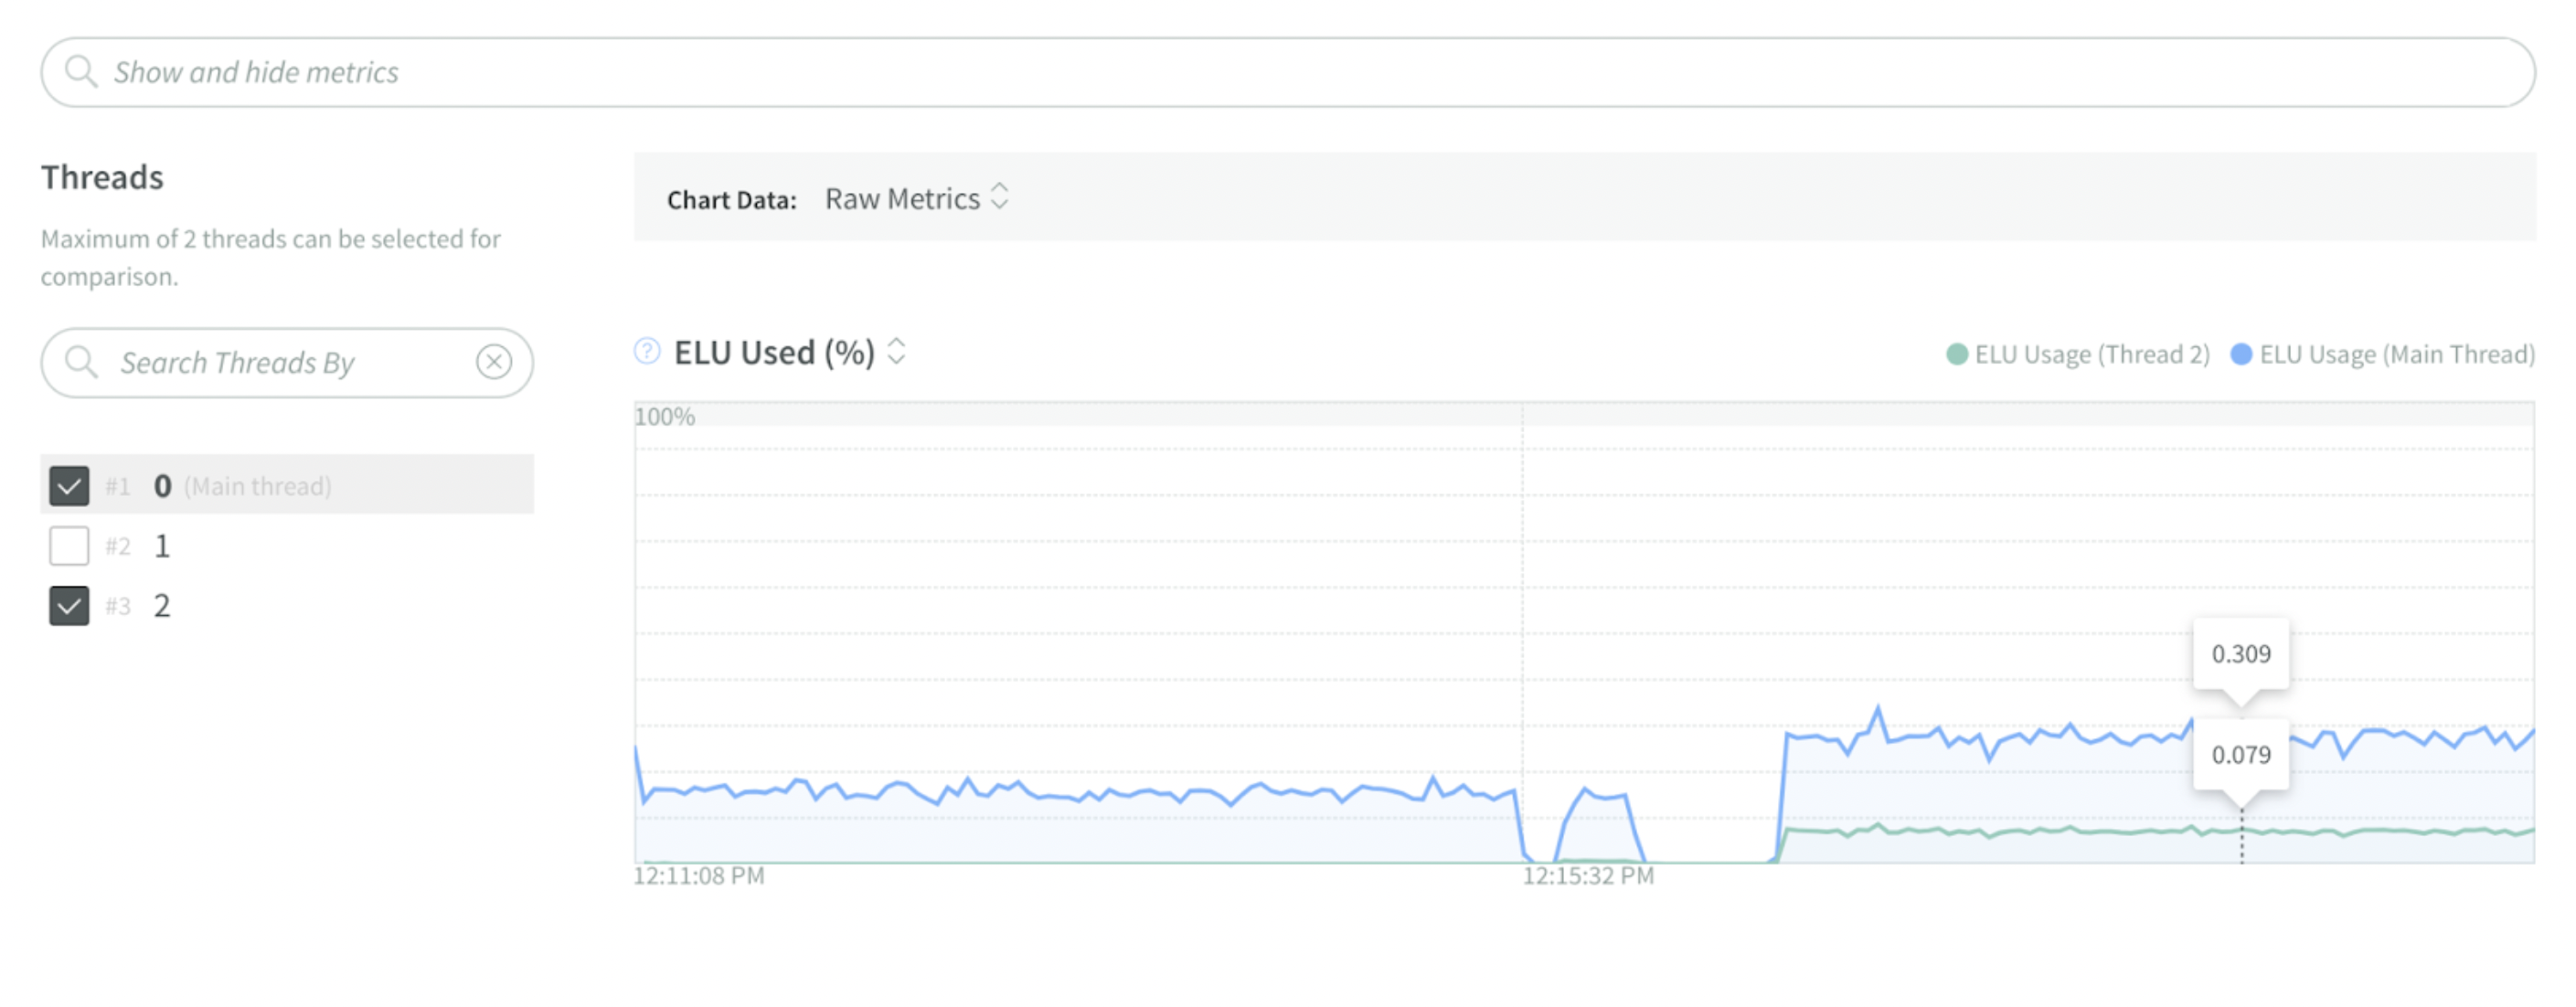 Img 5 - Worker Thread Comparison -CPU Profile - N|Solid
CPU Profiling —Zoom in—
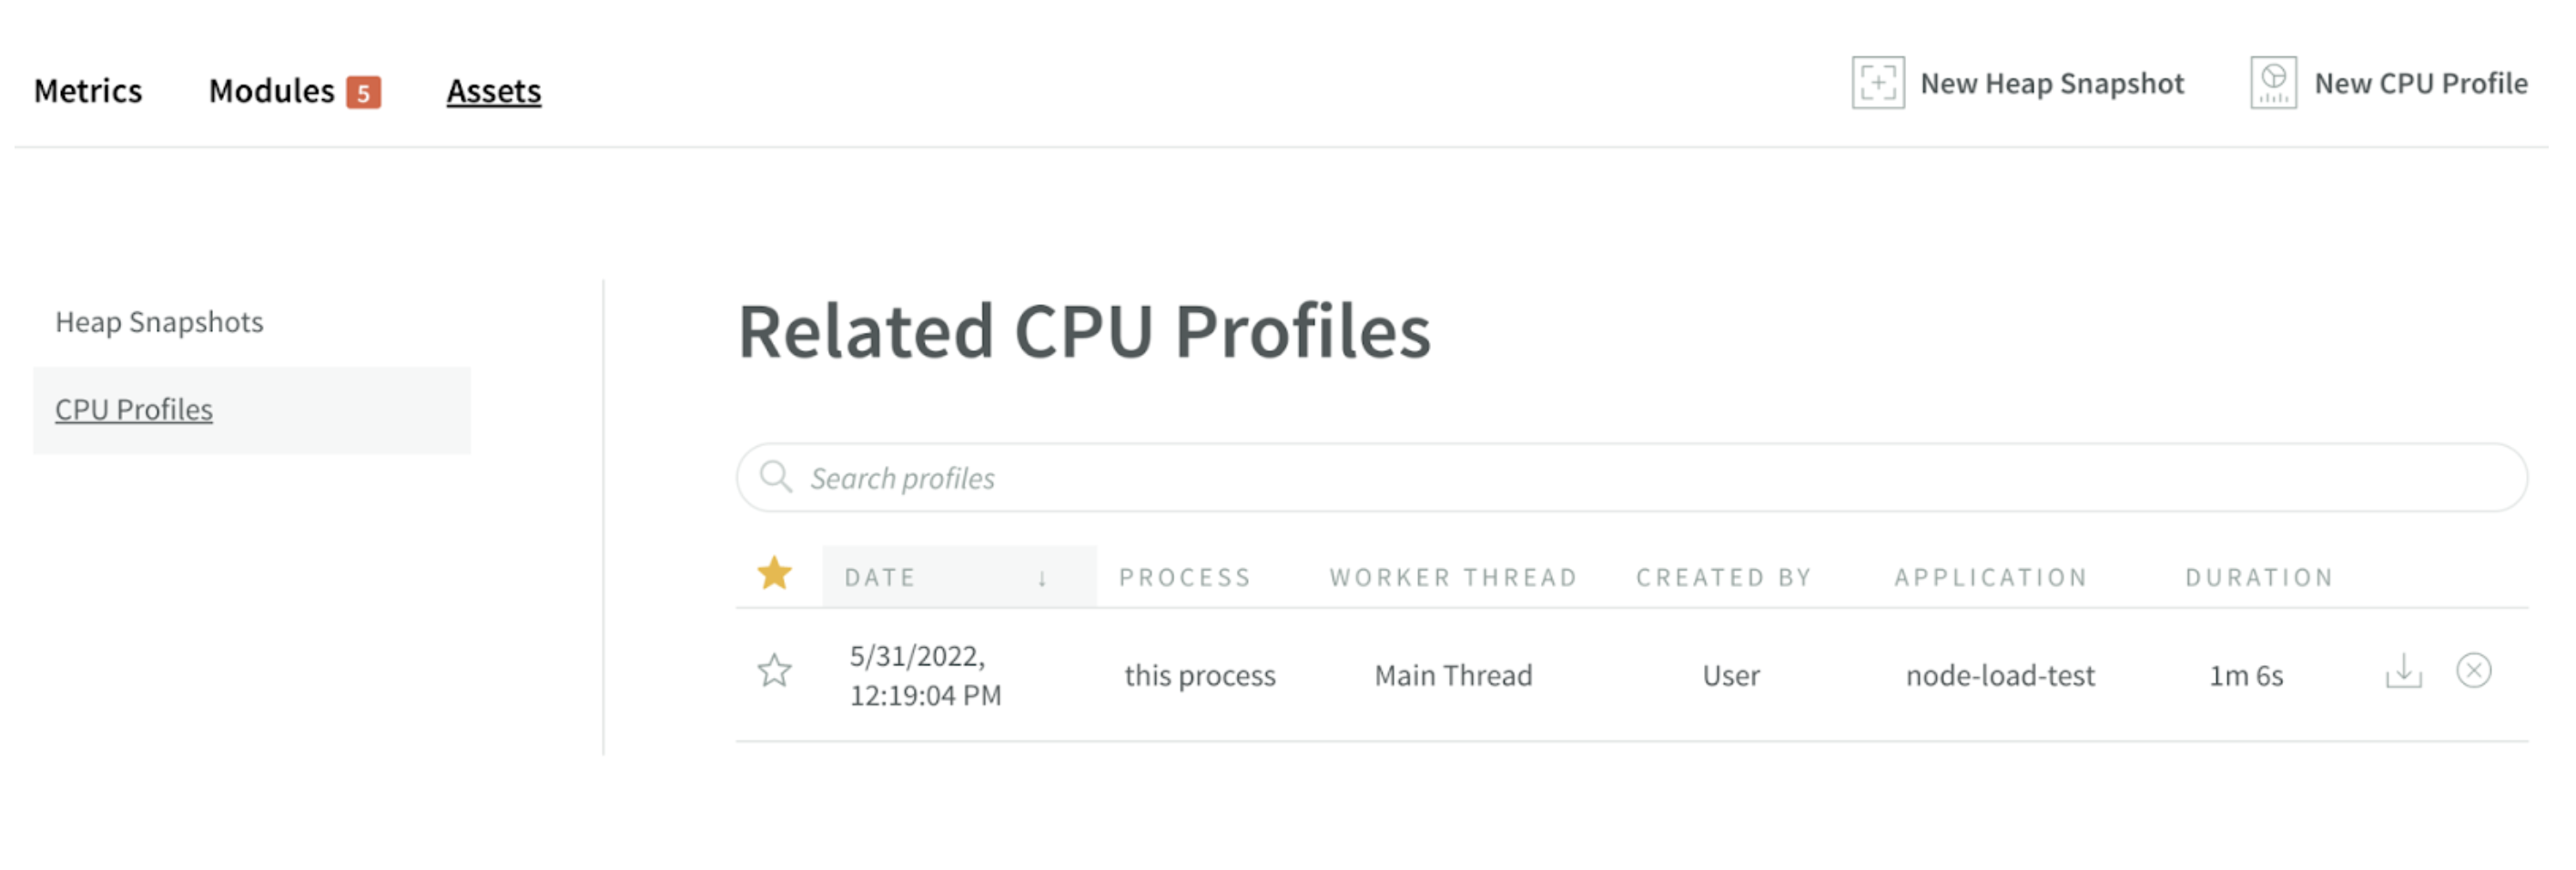 Img 6 - Process Assets -CPU Profile - N|Solid
- Advantage: Shows what functions consume CPU% and how resources are allocated.
- Benefit: Identify opportunities to improve the speed of applications.
CPU Profiling allows you to understand where opportunities exist to improve your Node 'processes' speed and load capacity.
- Capture and address performance bottlenecks that are inhibiting peak Node.js performance.
- It shows what functions consume what percent of CPU time. This information can give you a better understanding of how your application is executed and how exactly resources are allocated.
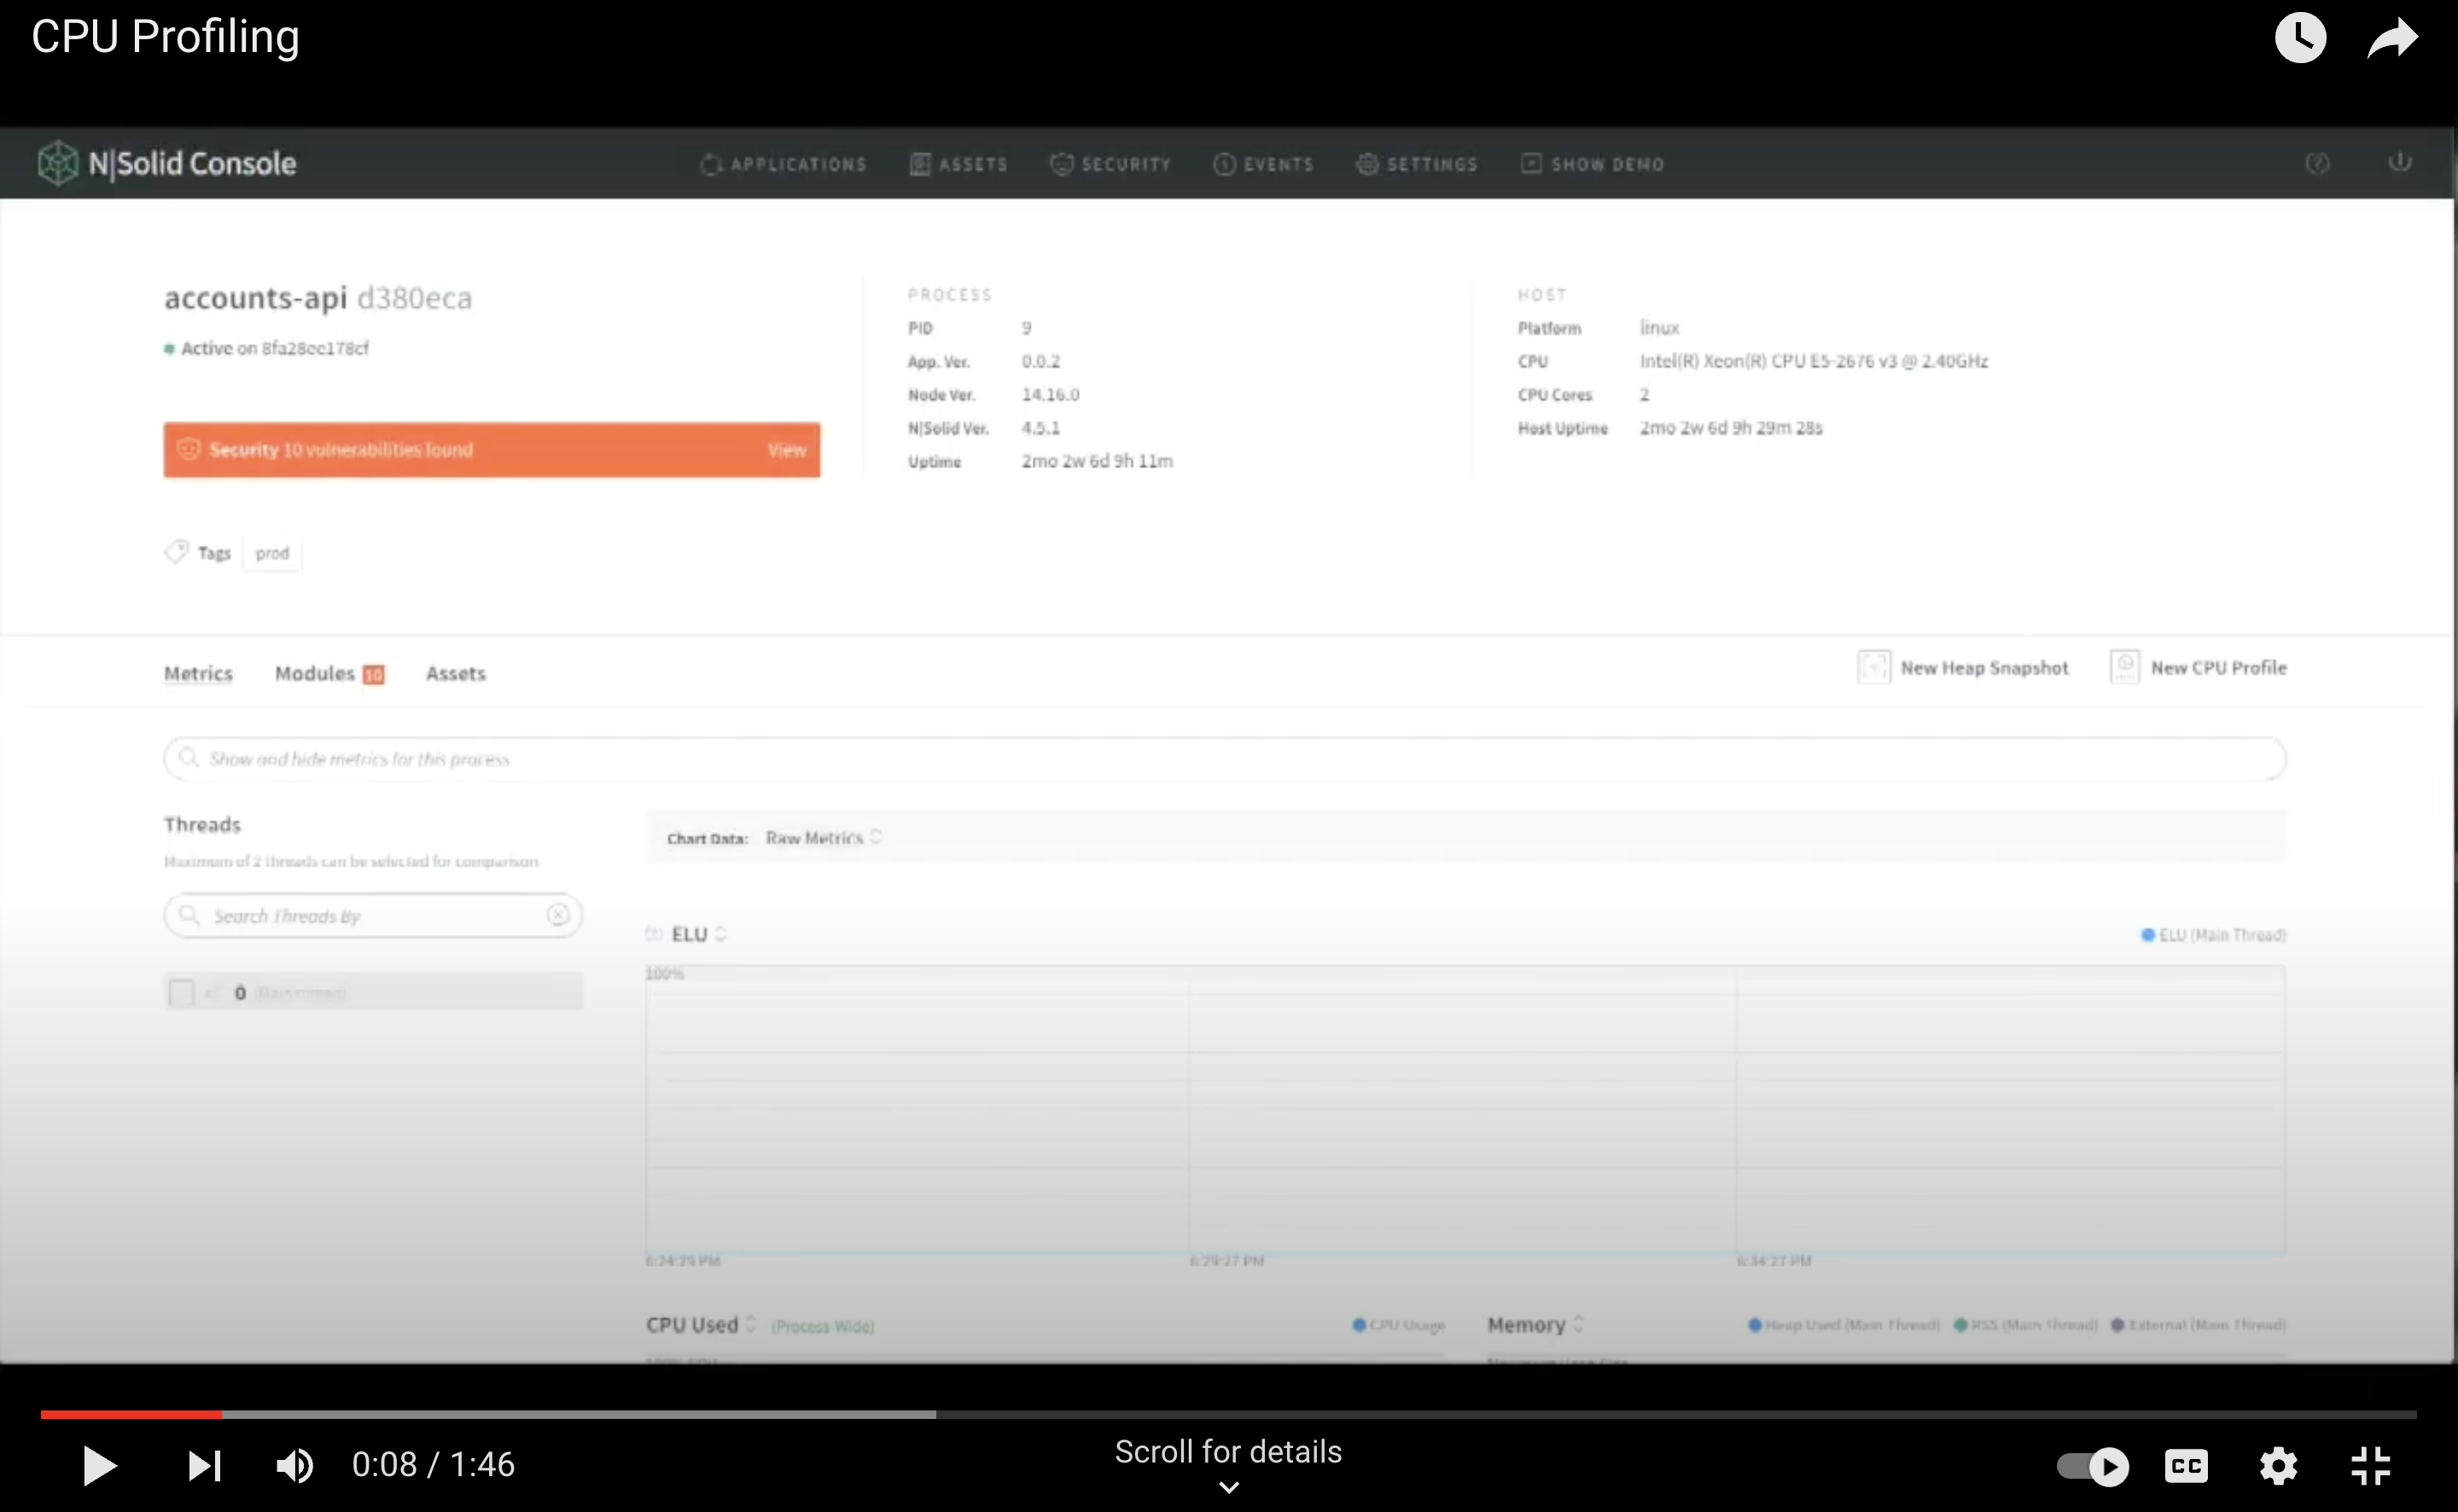
Demo Video — CPU Profiling in N|Solid
__NOTE: __ For a better experience, you can activate the closed captions in the video, they are available in English.
By selecting under the menu where you find Metrics, Modules, and Assets, you can select CPU Profiles.
It will show us the Related CPU Profiles, according to date, process, worker threads, who created the CPU Profile (the user), on what application, and the profile duration.
Additionally, you can download and close said profile or highlight it if you enable the star. When downloading the profile, you can view it in the N|Solid Console, as a treemap, where the User Code is highlighted; by navigating with your mouse, you can review the functions and the total milliseconds and performance percentage.
Additional, in the highlights, you can select:
- None
- User Code
- CoreCode
- 3rd Party Code You can select Sourcemaps or search with Search Functions. You can switch to one of these visualization options: Sunburst, Flame Graph, and Treemap.
Want to try N|Solid?
Do it right now! 🏃🏿♂️🏃♀️, We release in Openjs World 2022 some codes to redeem 50% in 8 or 12 processes in our SaaS version.
50% OFF USING:
- 8 processes OPENJS-8T
- 12 processes OPENJS-12T
Or sign up for our FREE option for 4 processes and get started with N|Solid!
To check out the top 10 features and more in N|Solid, create your account in sign up or sign in, in the top right corner of our main page. More information is available here.
