Amazing new features in N|Solid V4.6.0.
We are very excited at NodeSource with the arrival of N|Solid Version 4.6.0. 🚀
In this release you will find a bunch of cool functionalities that will make your life as a developer and software team, easier. With even greater precision you will be able to monitor your Node.js projects better than ever!😱💥
Key highlights in this release are:
- New Applications dashboard
- HTTP & DNS Tracing
- CPU and Memory Anomaly detection
Note: These new capabilities would not be possible without our team of Node navigators who are Node.js experts and active Open Source contributors. We celebrate the amazing work of the NodeSource Engineering and Product Teams!
Now, It's time to break down these new features layer by layer!🤓
APPLICATION DASHBOARD
Philosophically, N|Solid has always focused on monitoring processes —the minimum unit of an application— as this is a unique value to software teams utilizing Node.js. In a typical scenario, as I launch a process, it provides key metrics and associated behaviors -and that's why N|Solid has always relied on analyzing process by process—, and we still believe this is critically important... but we wanted to deliver more value.
Based on our customer feedback requesting N|Solid to provide more metrics and visibility beyond the process we have decided to expand our product. We now incorporate the global visualization of the application, providing a global view with a summary of the processes in your application, including CPU Average, Event Loop Utilization Average, Throughput, Heap Used Average and more.
This update required a new view: Application summary. This view provides a view of all included processes and applications. An example would be where two or more processes are running in an application but each process needs to be viewed individually and also with related metrics. Now with N|Solid you can diagnose the state of an application even more quickly without leaving aside the view of the processes and their metrics.
In previous versions of our product, our focus was on providing process metrics, but it was the user who determined whether the application was behaving properly or exhibiting anomalies. This was based on providing the depth of information only N|Solid could, surpassing the scope and detail of other APM's, so users could develop conclusions according to their needs.
We continue to strive to provide even deeper insights to enable better software. With N|Solid 4.6.0. users have visibility at the application level and at the individual process level plus new functionalities to facilitate the analysis of information at both the application and process level.
N|Solid Console Updates
The N|Solid Console now allows you to see the list of applications with even more detailed information about each application. Previously, the product provided information about code vulnerabilities and number of processes. Now we provide details for the entire application, not only for a specific process.

Img 1. Application Dashboard — Principal View
Application Summary
Application status is based on the percentage of certain metrics, above certain values. Now you have impressive information about the console, versions of the console, the runtime, the number of processes that you have connected, those processes that are allowed, the users, and the renewal date of the subscription that you currently have.
When going into detail of each of the applications on the application status, now you can see the number of vulnerabilities, access to the scatter by specific application, and you can also review the event list by application or the number of worker threads.
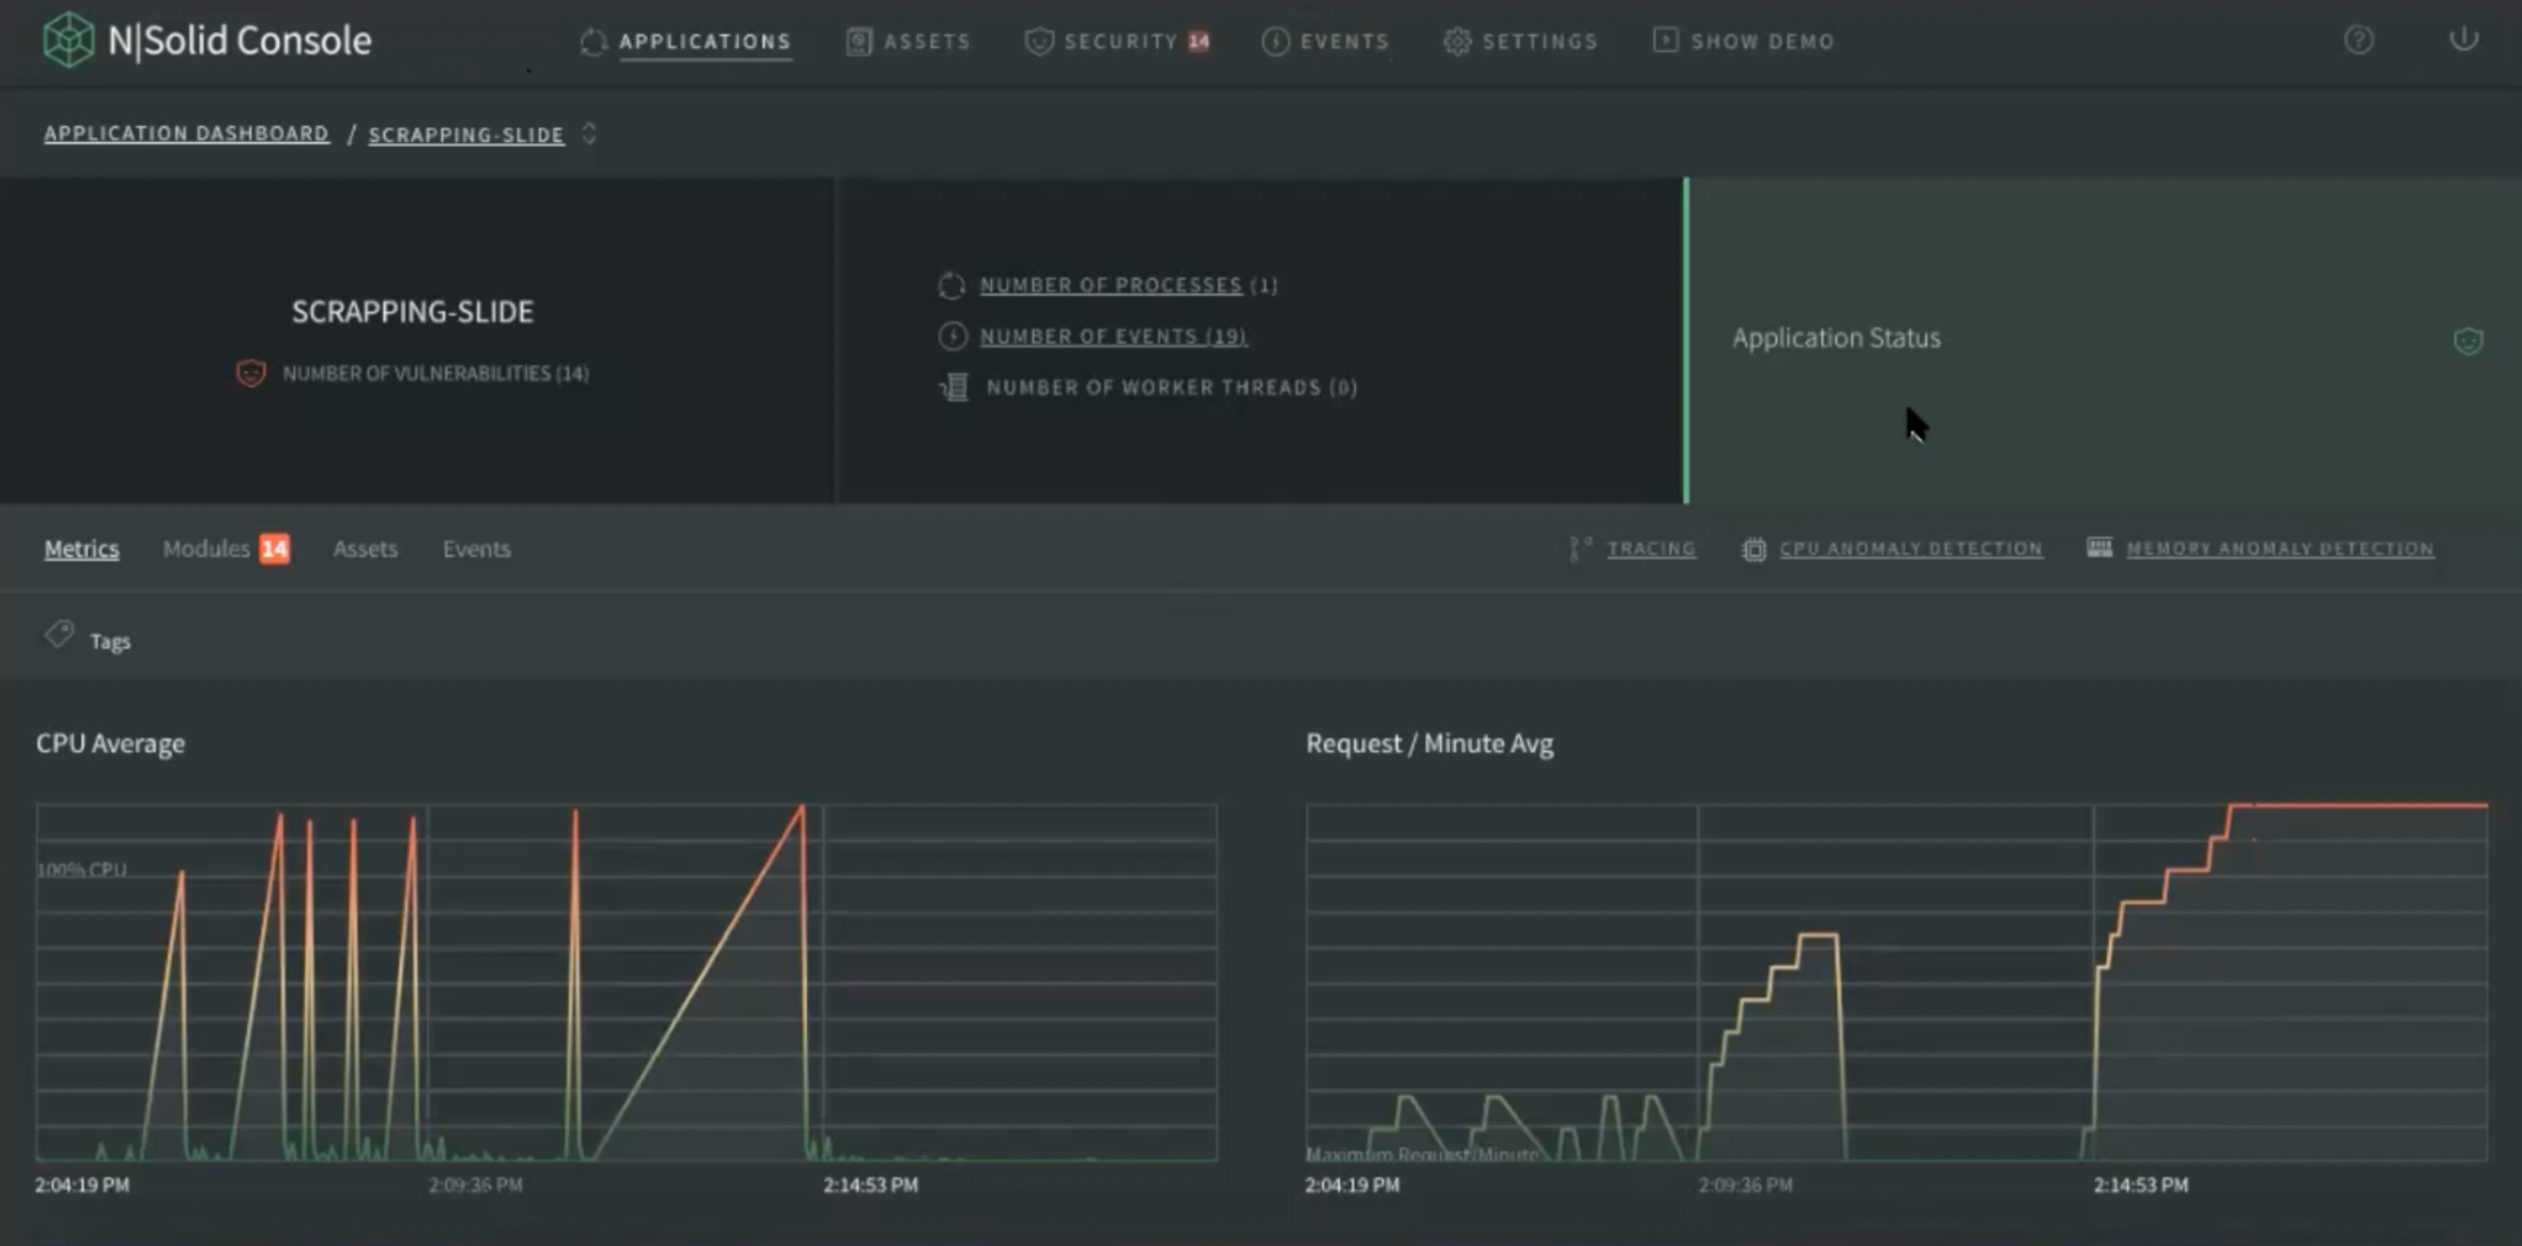
Img 2. Application Dashboard — Application Status View
From the application you have access to the tracing, CPU anomaly and memory anomaly per application. In each of these areas users receive specific information about that application through navigation tags:
- Metrics
- Modules
- Assets
- Events
Metrics
In the metric information, our first view shows us 4 core metrics:
- CPU Average
- Request / Minute Avg
- Throughput
- Event Loop Utilization Average
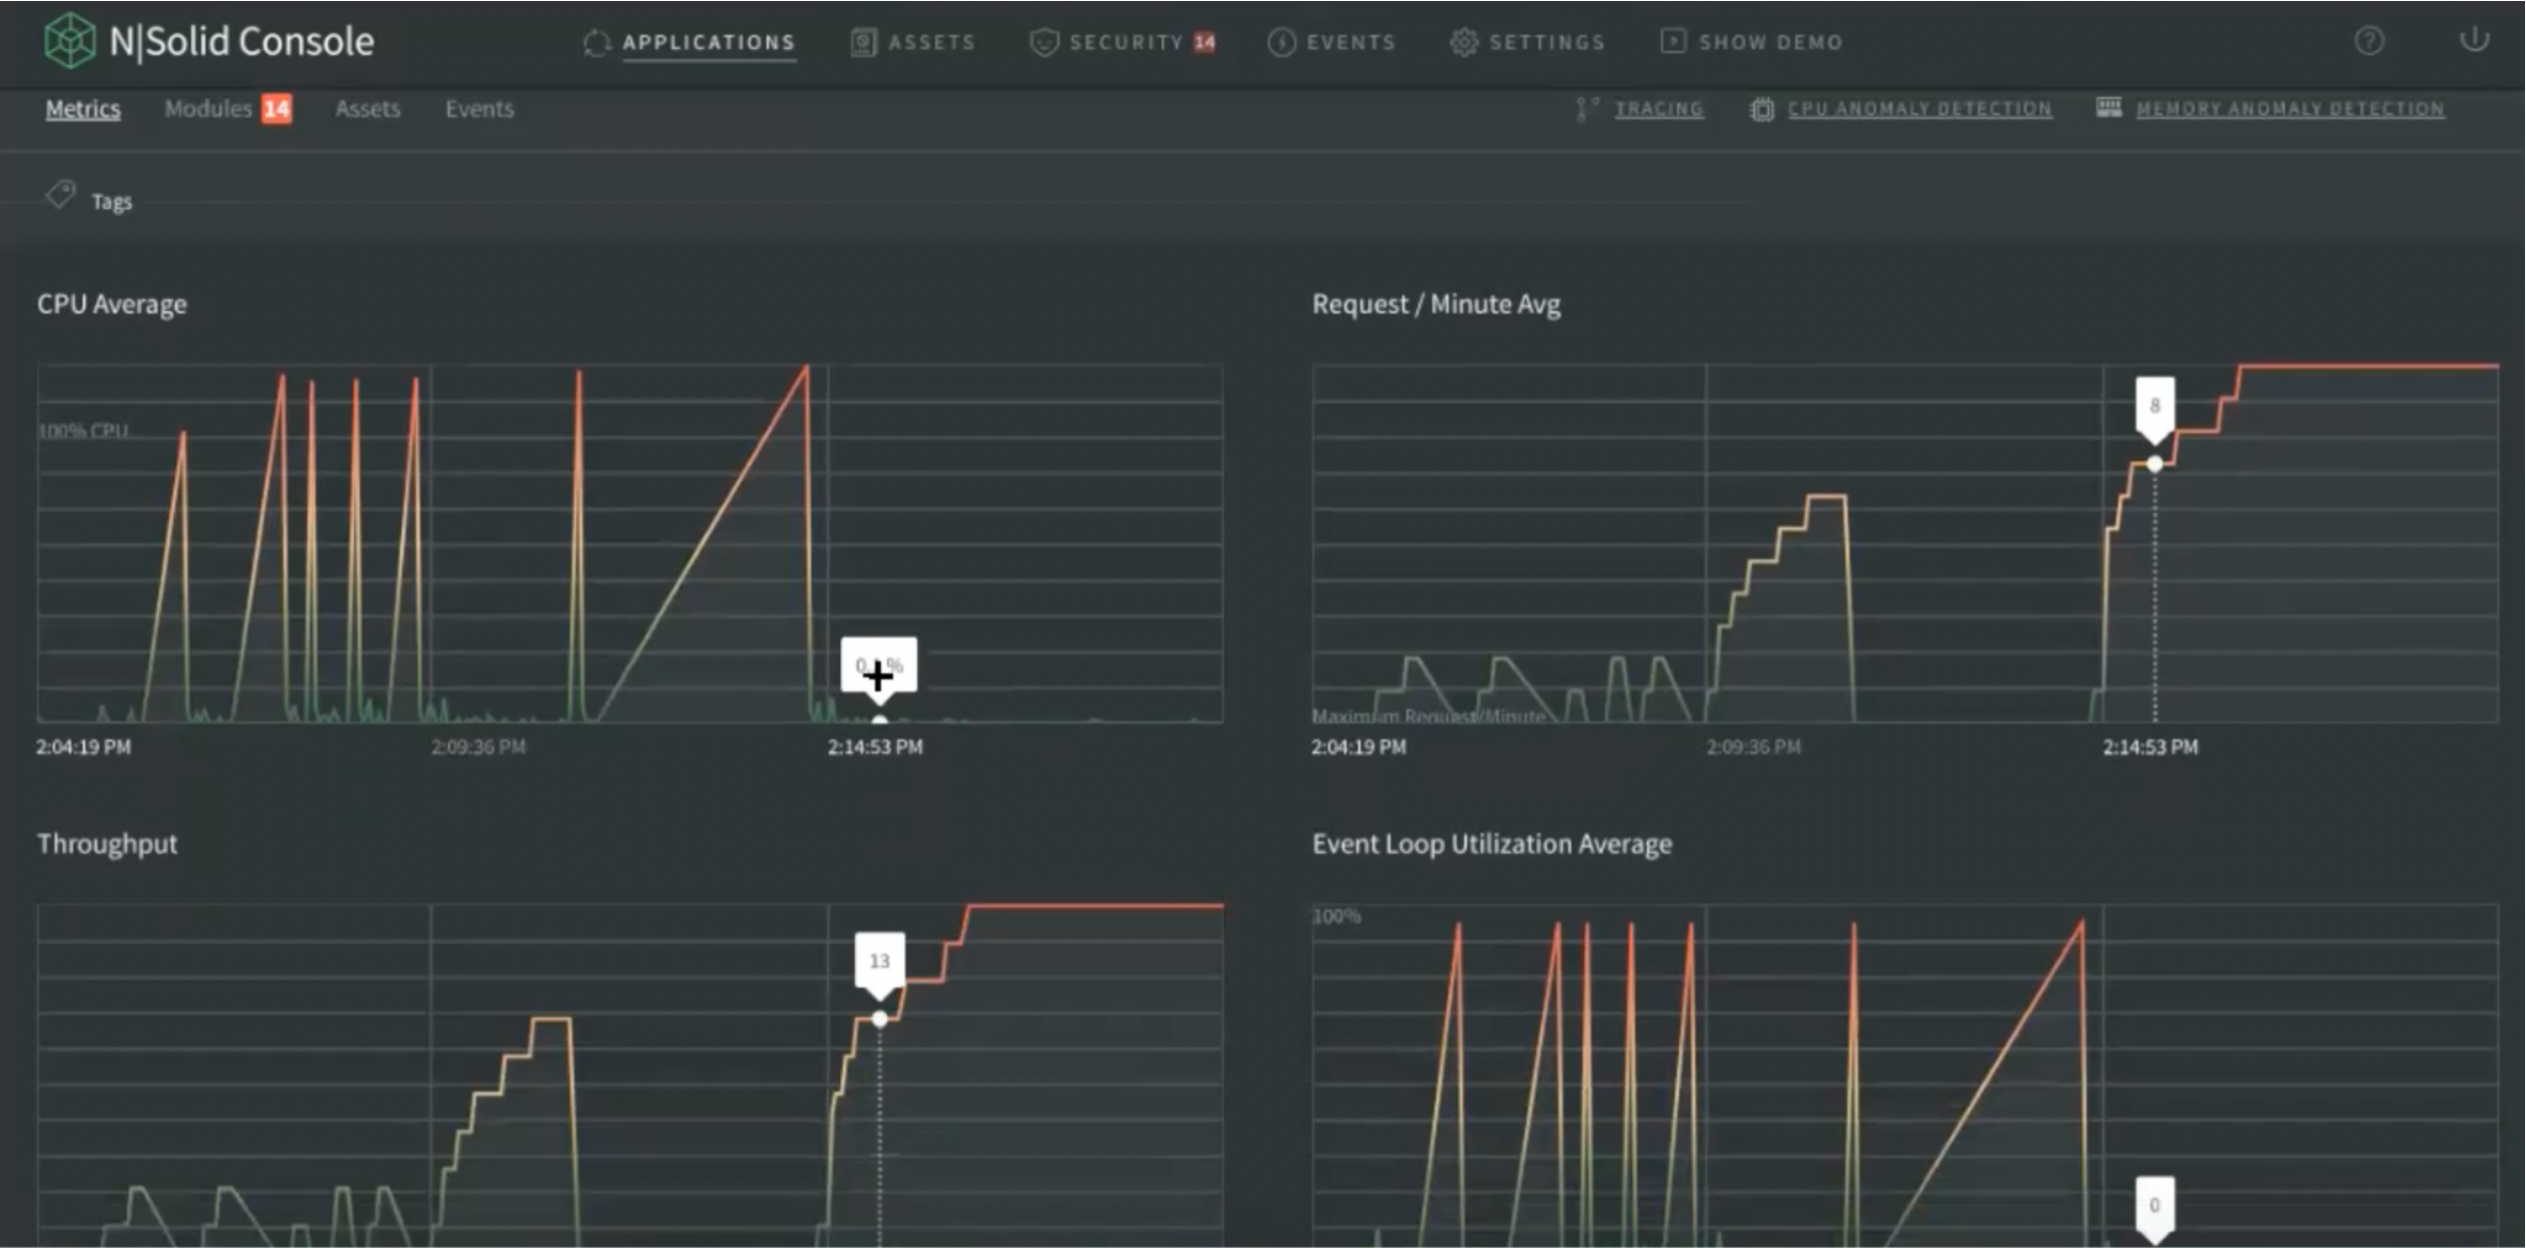
Img 3. Application Dashboard — View Principal Metrics View
In the second instance there are more detailed metrics -which you can add- and you can build your custom dashboard which will be on the cloud as long as you keep the session. Once it is refreshed, there is the opportunity to choose new custom metrics to rebuild the dashboard.
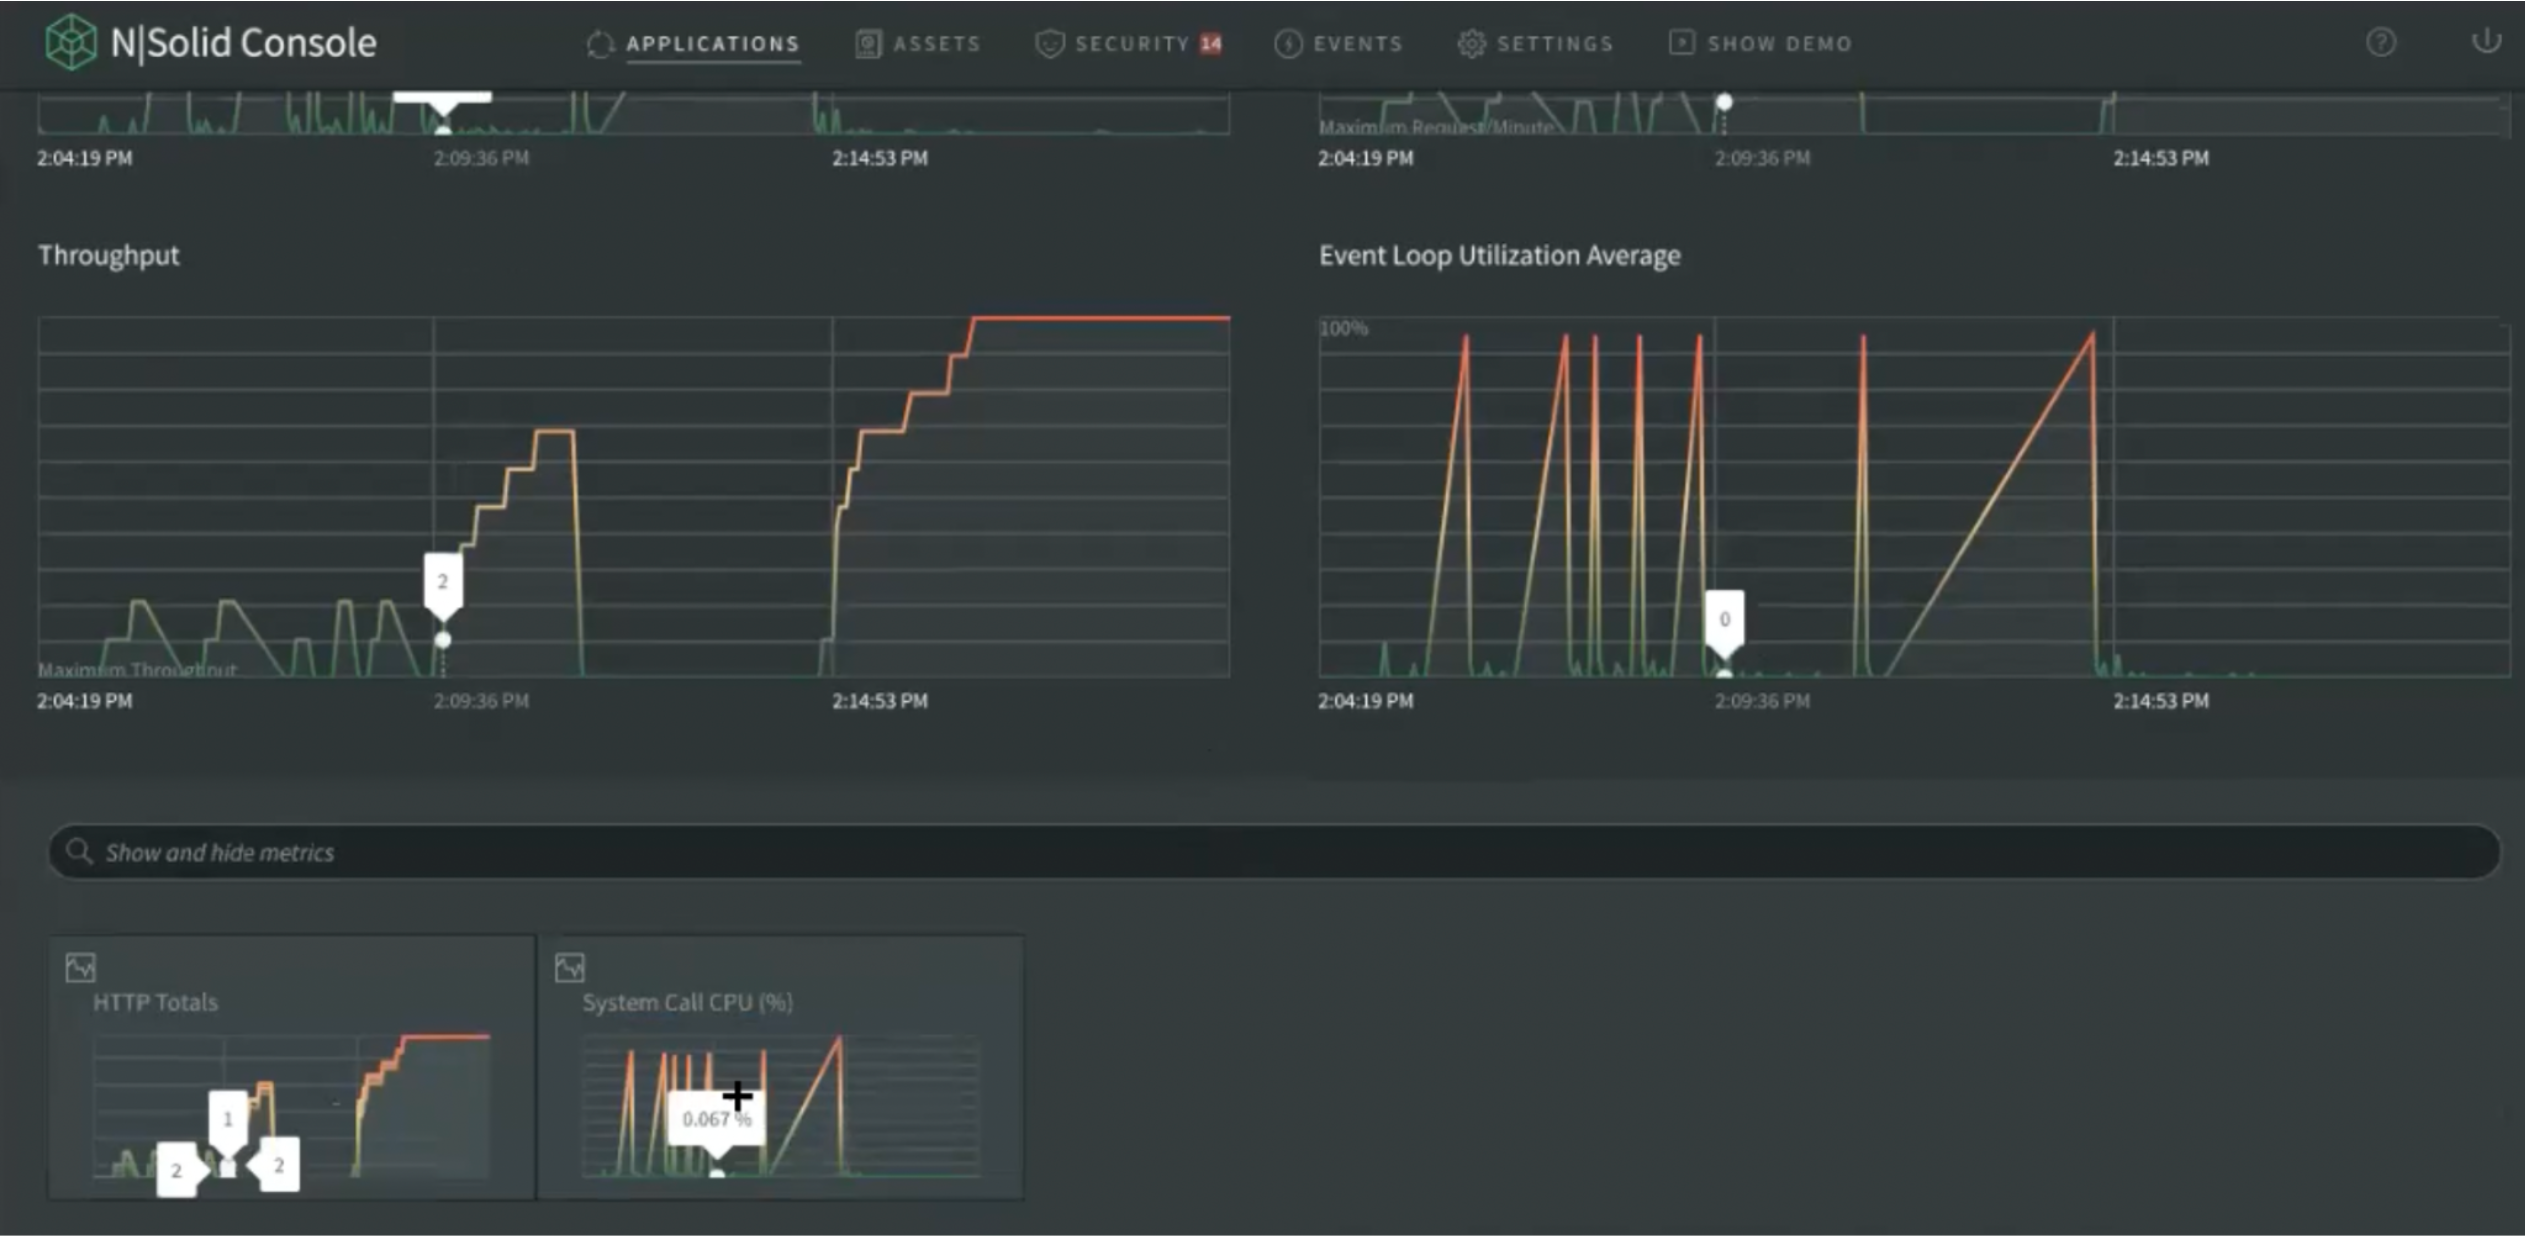
Img 4. Application Dashboard — Extended Metrics View
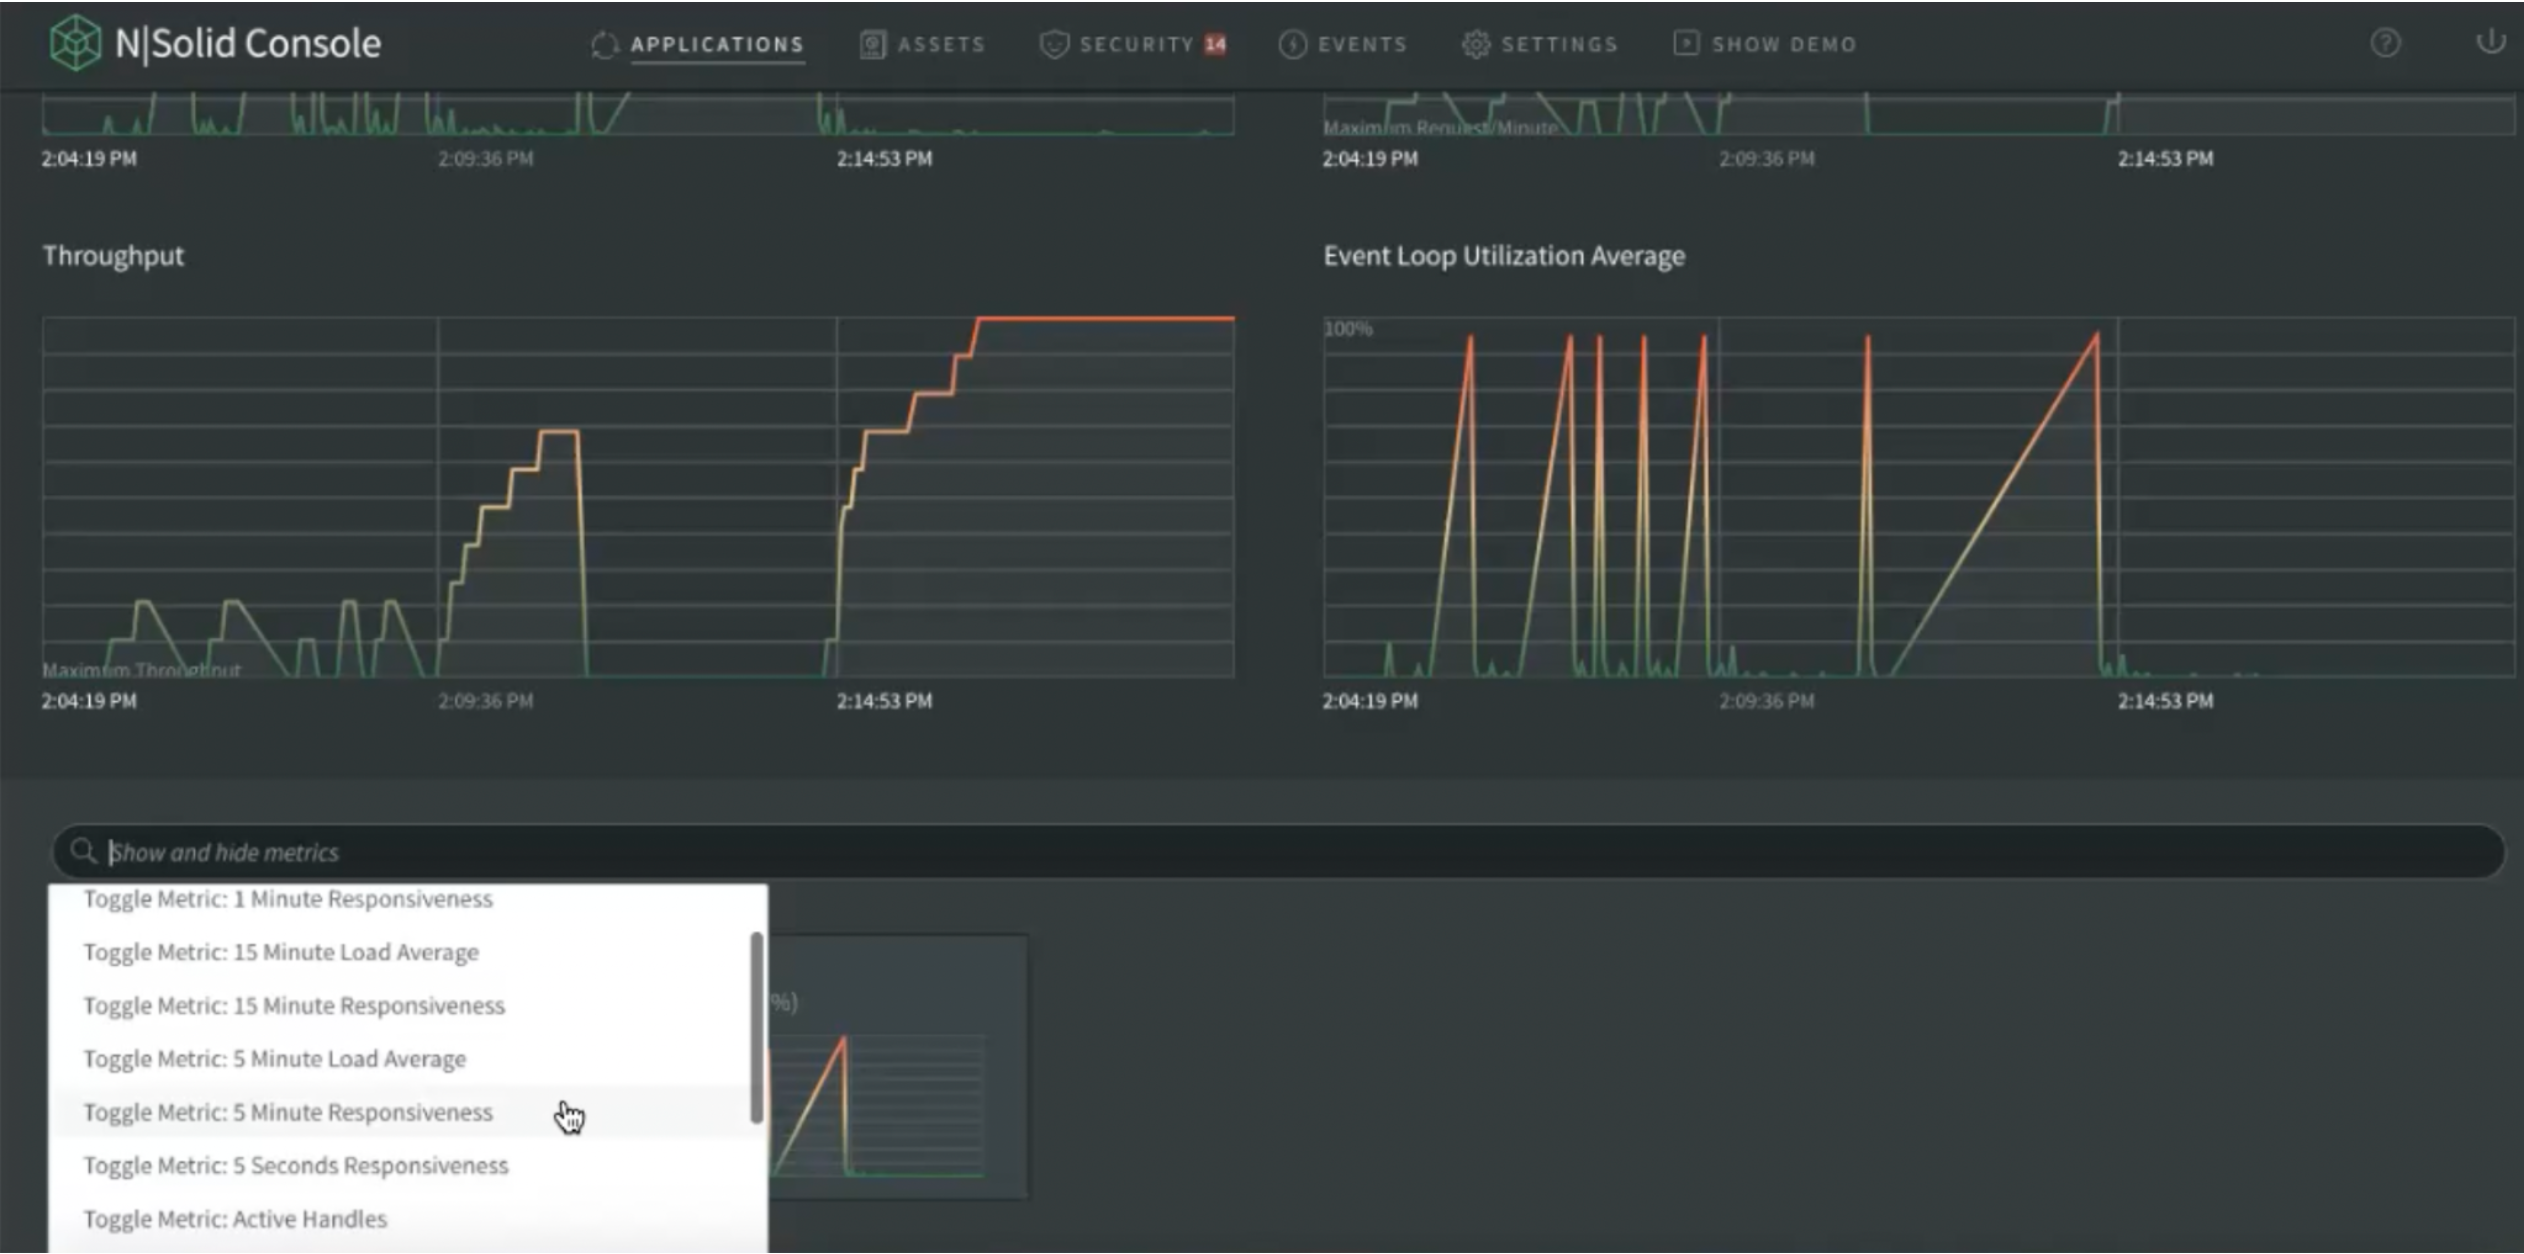
Img 5. Application Dashboard — Custom Metrics View
If desired, the view can also be enlarged to view it in greater detail. If you prefer to see numerical values, simply close and delete directly from the metric to customize the view.
Tags
They are clickable, the information of the metrics is filterable by each of the tabs. By default there are the metrics of everything, regardless of the tag you are in.
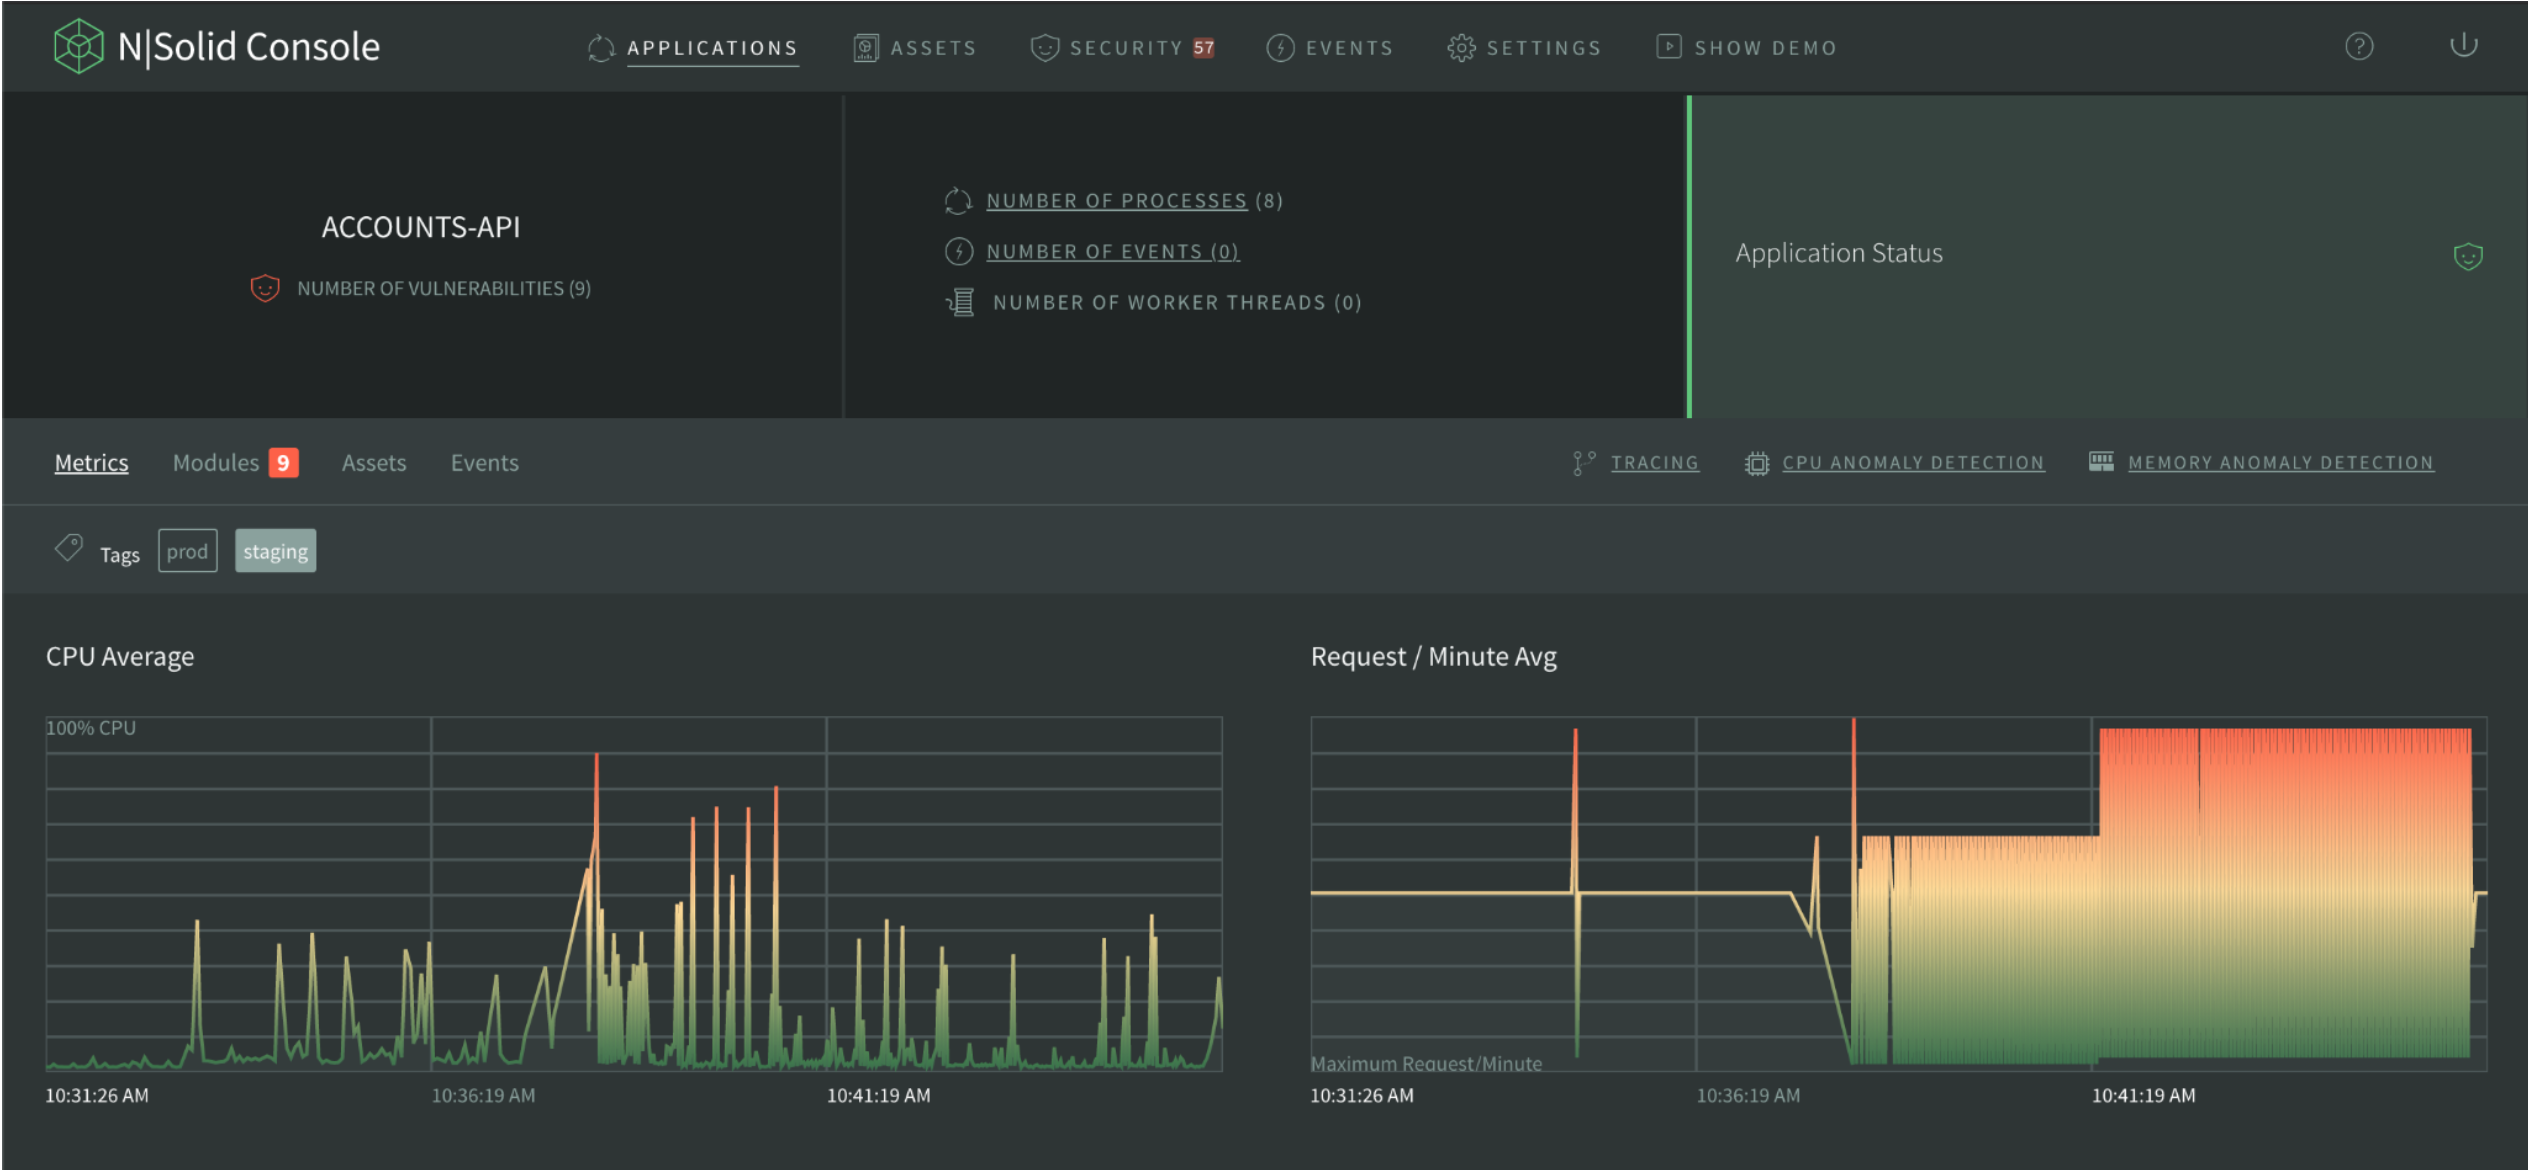
Img 6. Application Dashboard — Add Tags View
If you select a specific tag or several, it will filter accordingly. If you clear or deselect them all, it will show the data, but without filtering.
Modules
It is the same Process Detail information N|Solid has previously provided, but is an improved view of the packages that each of the processes you are running in the application. Now you can differentiate the processes by version, even if they have the same name.
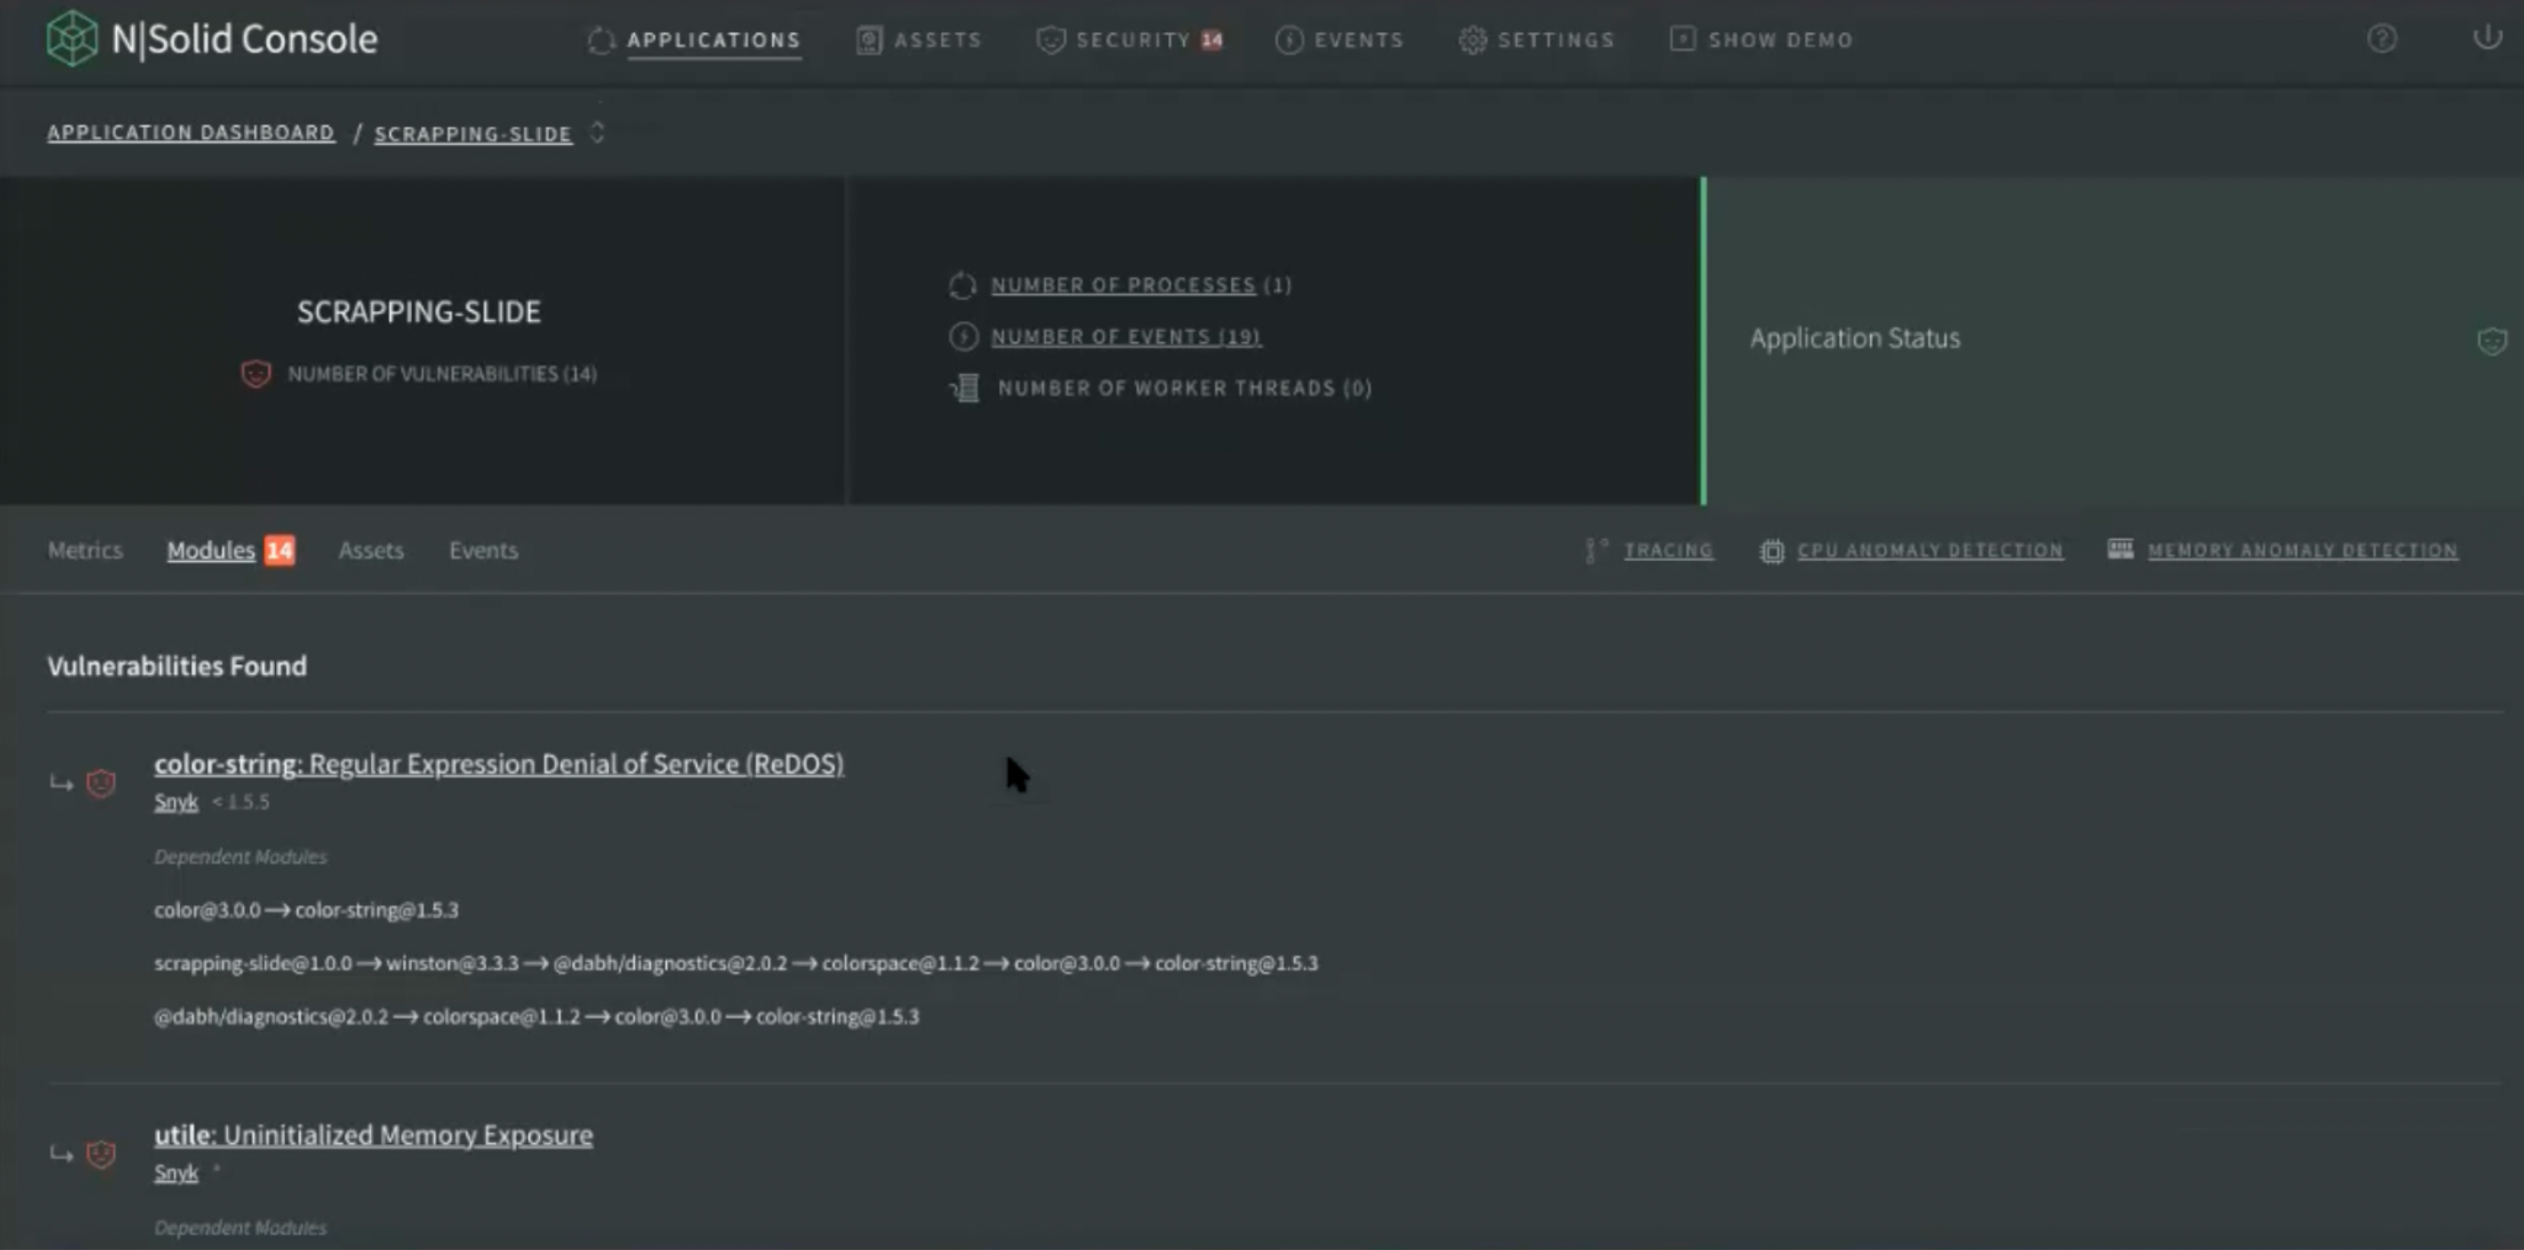
Img 7. Application Dashboard — Modules View
For example, if you were running Express in two different versions, both will appear in this view with the same name, because they are different packages, just like Process Detail.
Users can dive in to see the details of a vulnerability, and can view the application summary in return and look at the vulnerabilities or number of dependencies. In this view the list of packages, the NCM (Node Certified Modules) report, and any vulnerabilities or the number of dependencies are available.
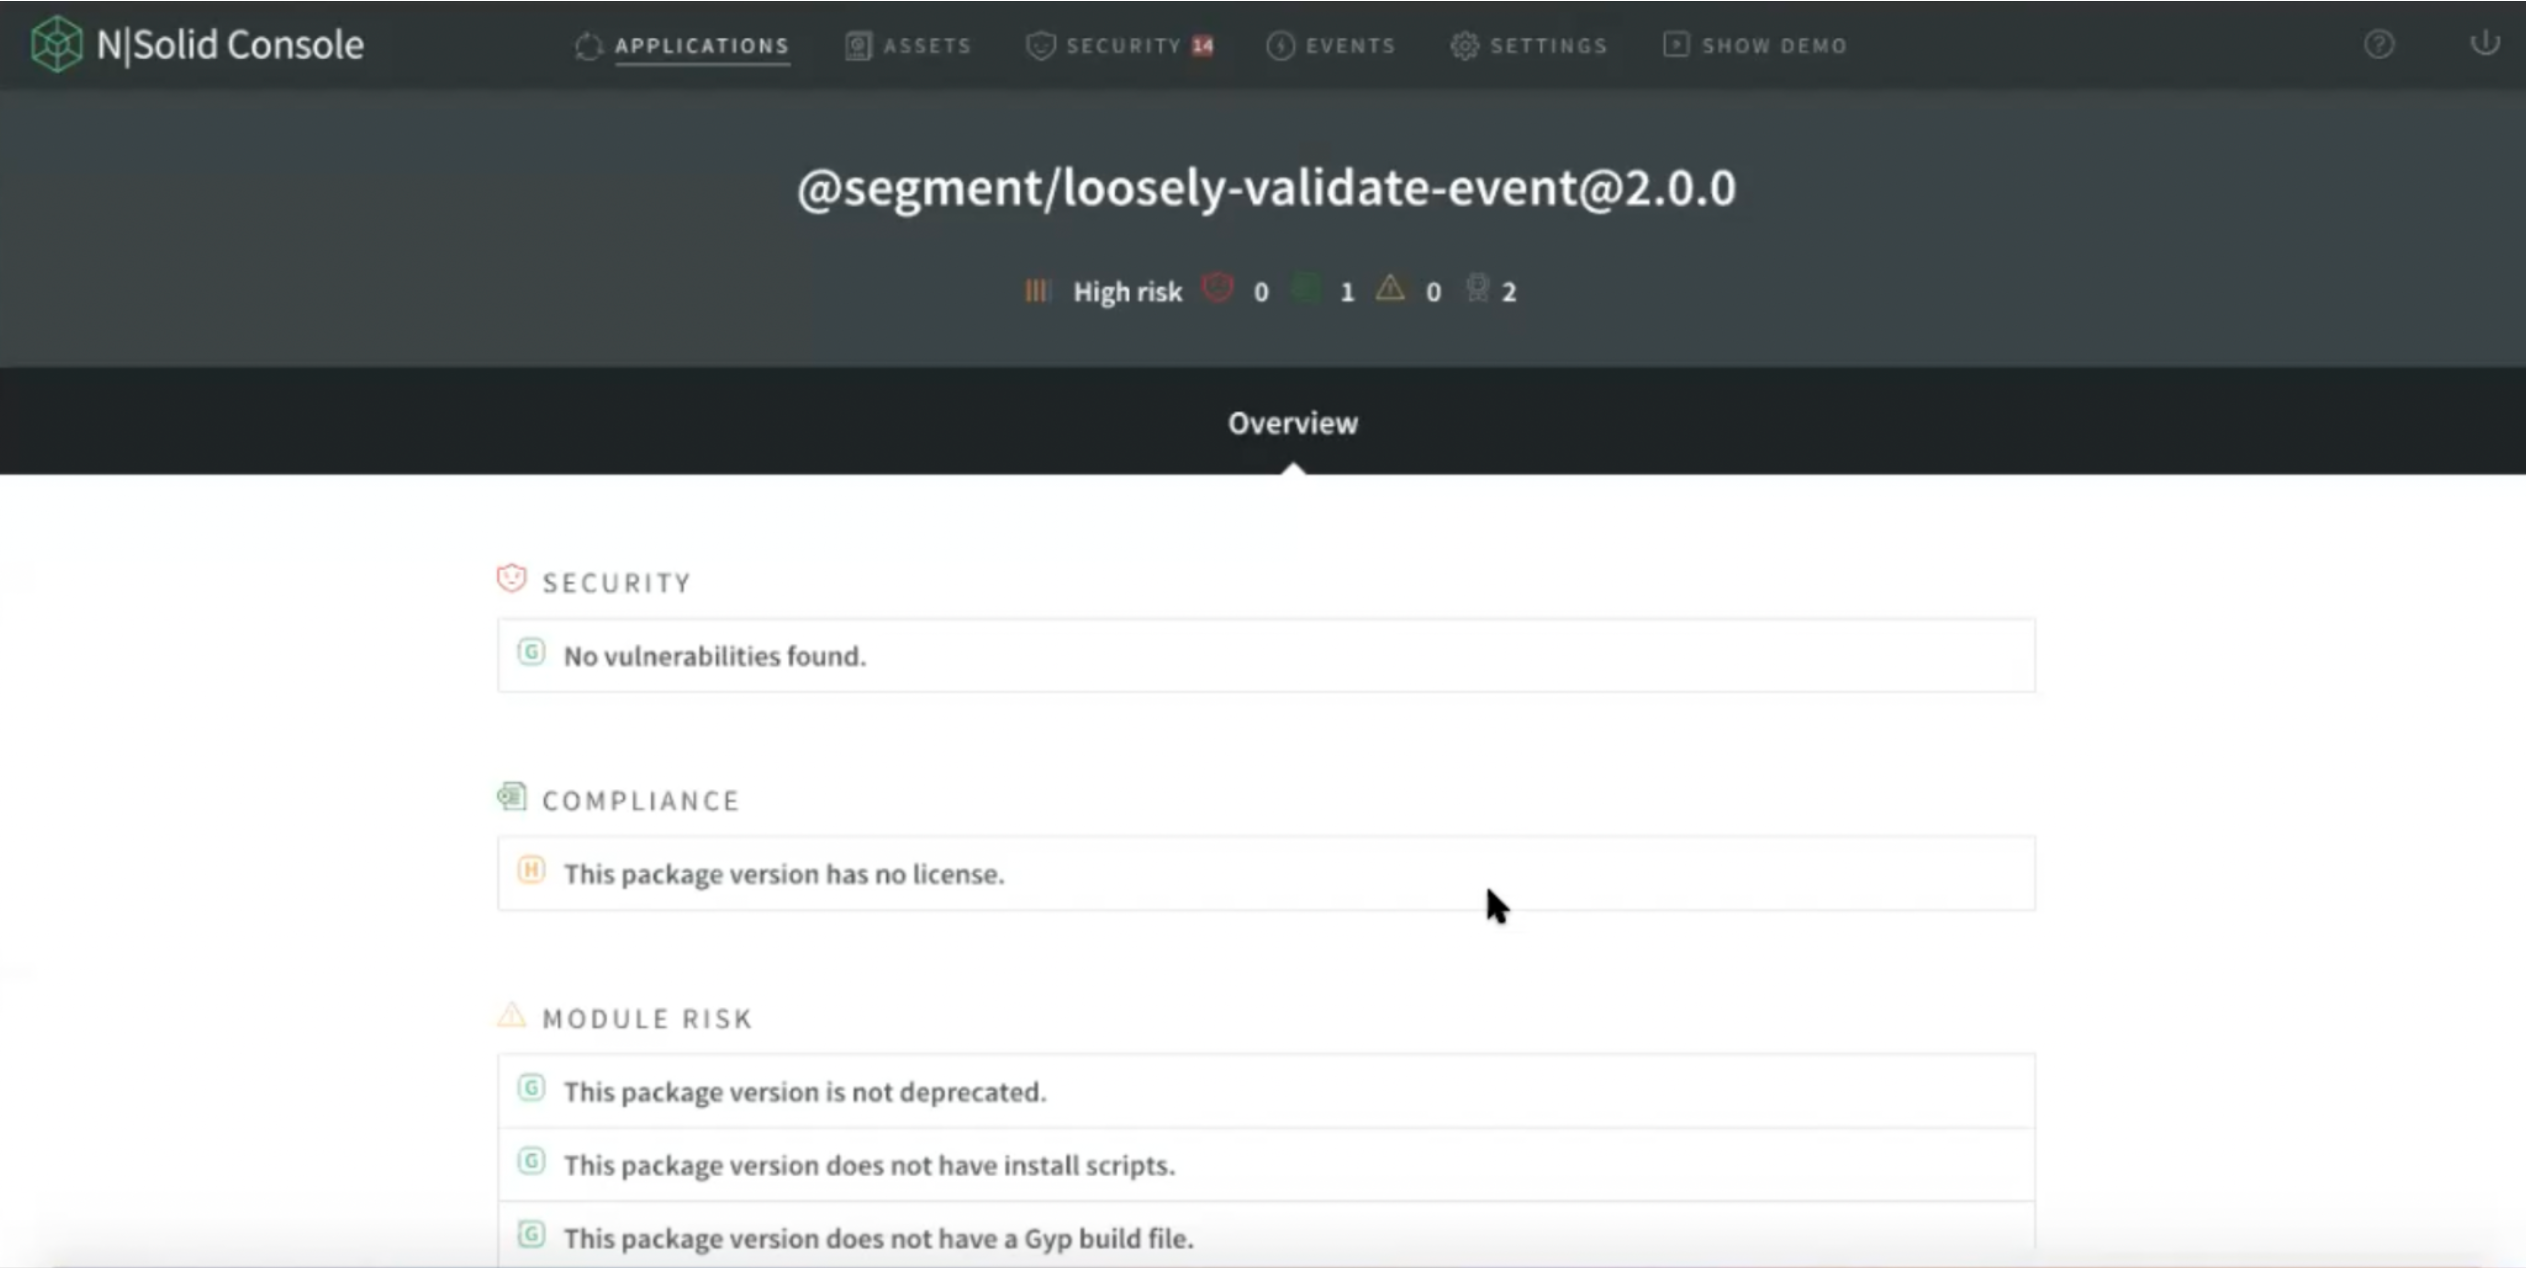
Img 8. NCM Report — Process Detail View
When reviewing the details of the NCM report, users will access a complete report that works the same as Process Detail. The difference is that here you have everything per application, all of the processes connected to that specific application number.
Assets
Again, it’s the same flow that we have in Process detail, including list of Assets, CPU profiles or Heap Snapshots related to that specific application. By selecting one, users can view it specifically.
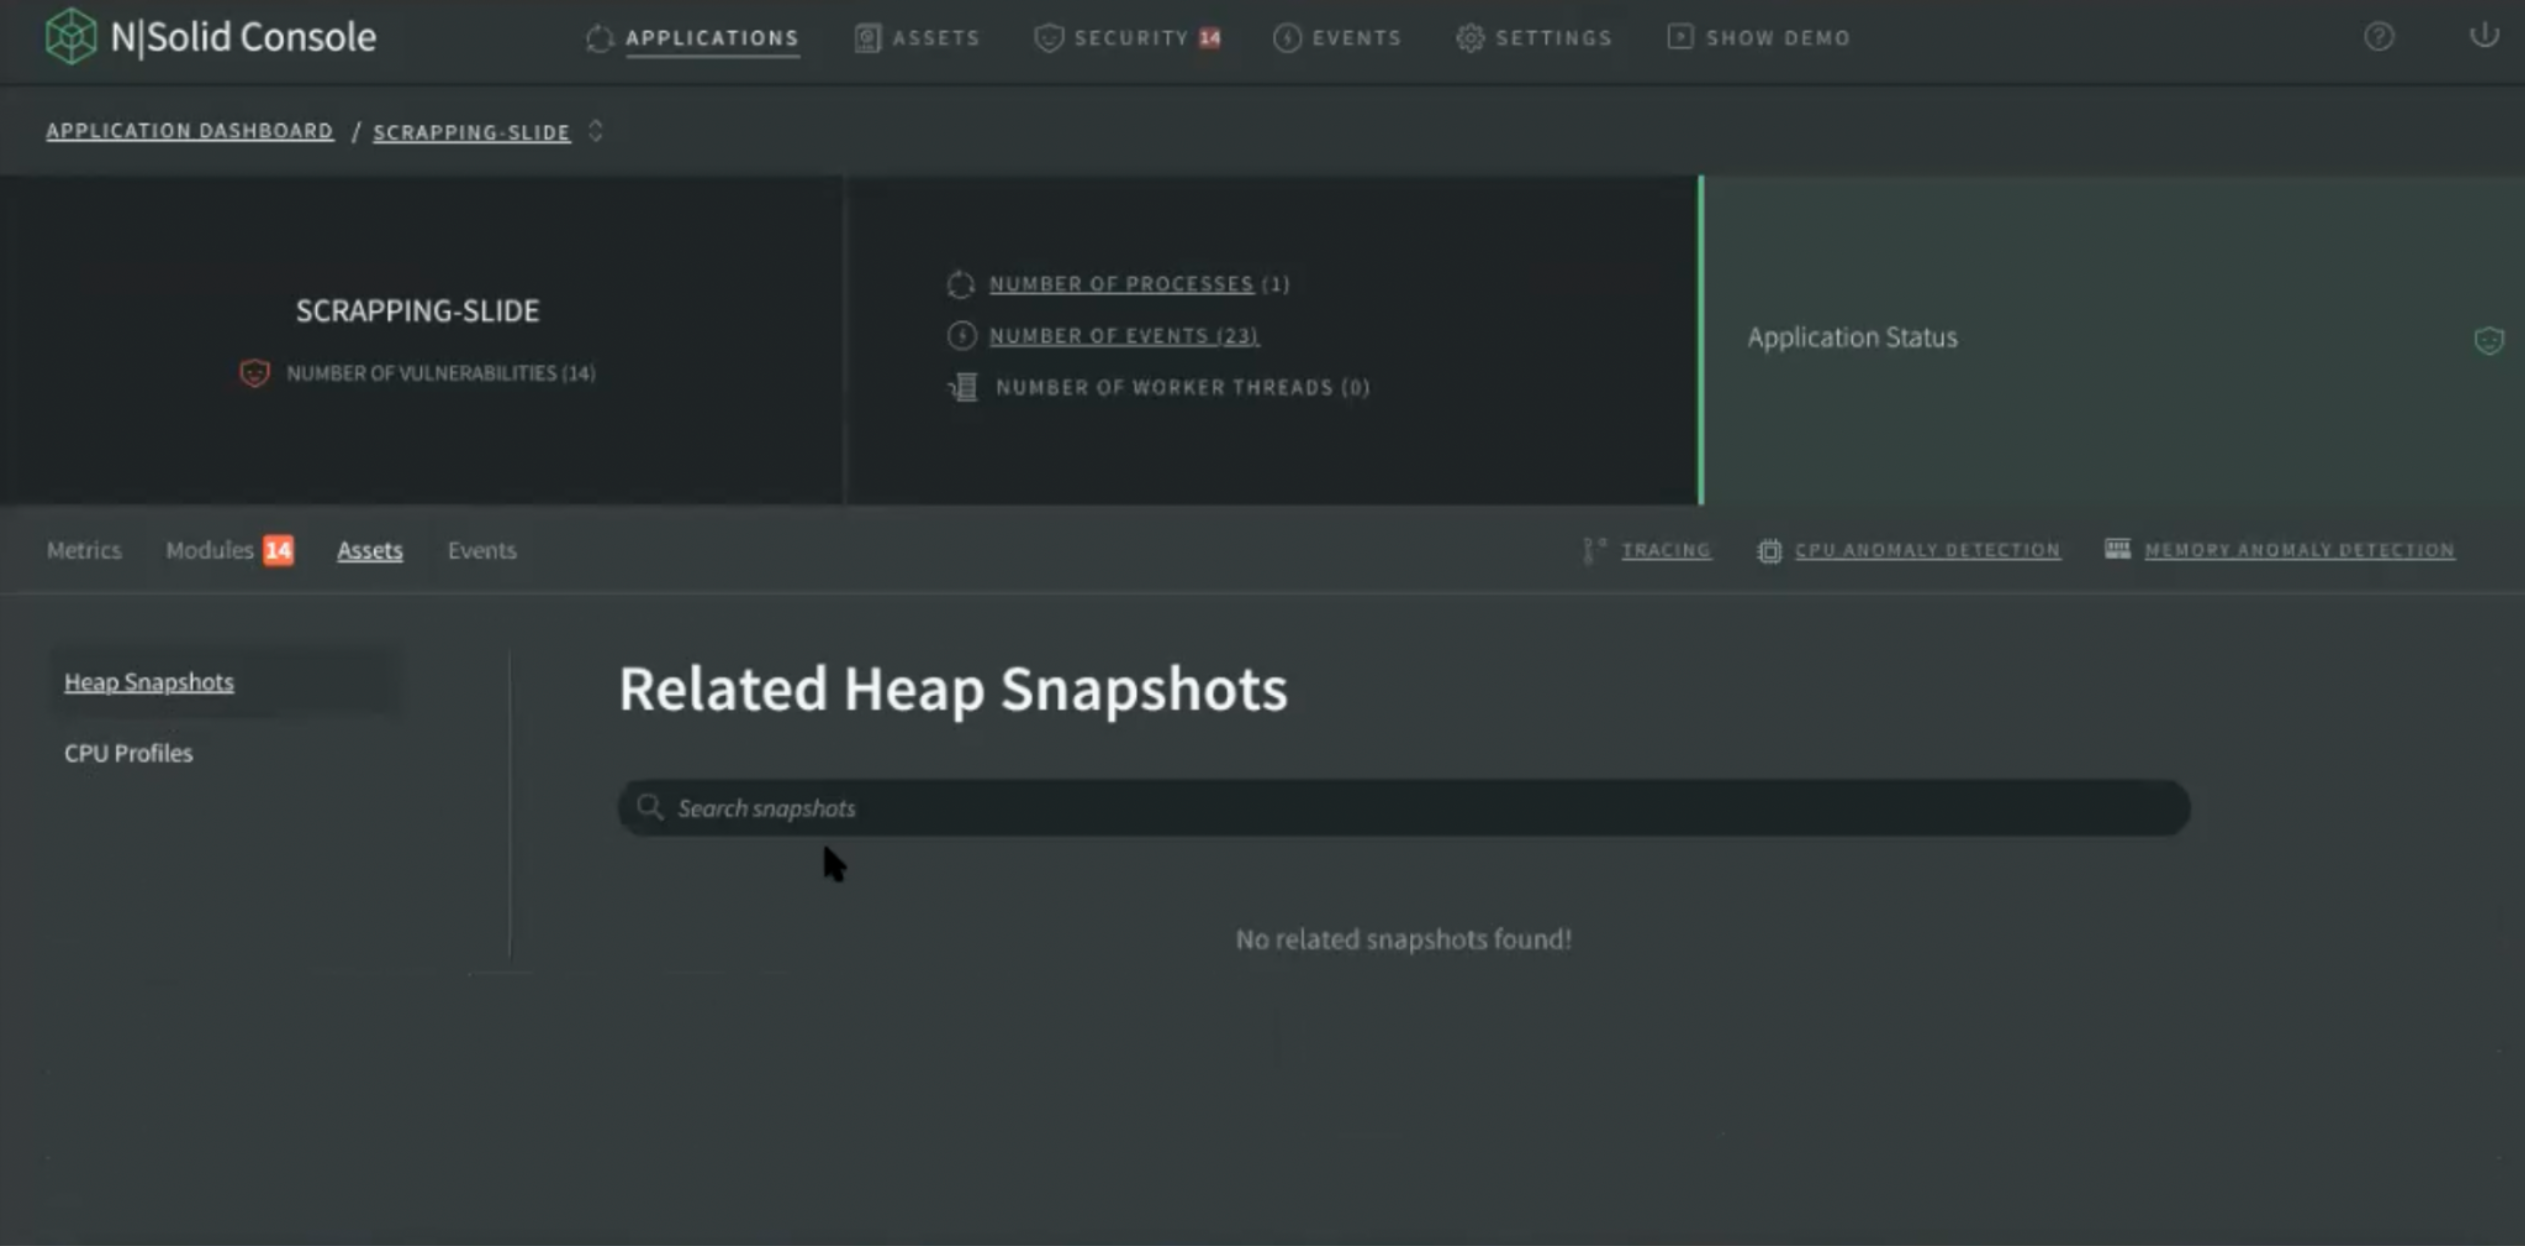
Img 9. Application Dashboard — Assets View
Visually there is a similarity because we want to maintain graphical coherence to relate process detail and application exactly in the same way, now with more information.
Events
This is a new tag showing the primary 25 events that an application has. To see more detail there is an extended view.
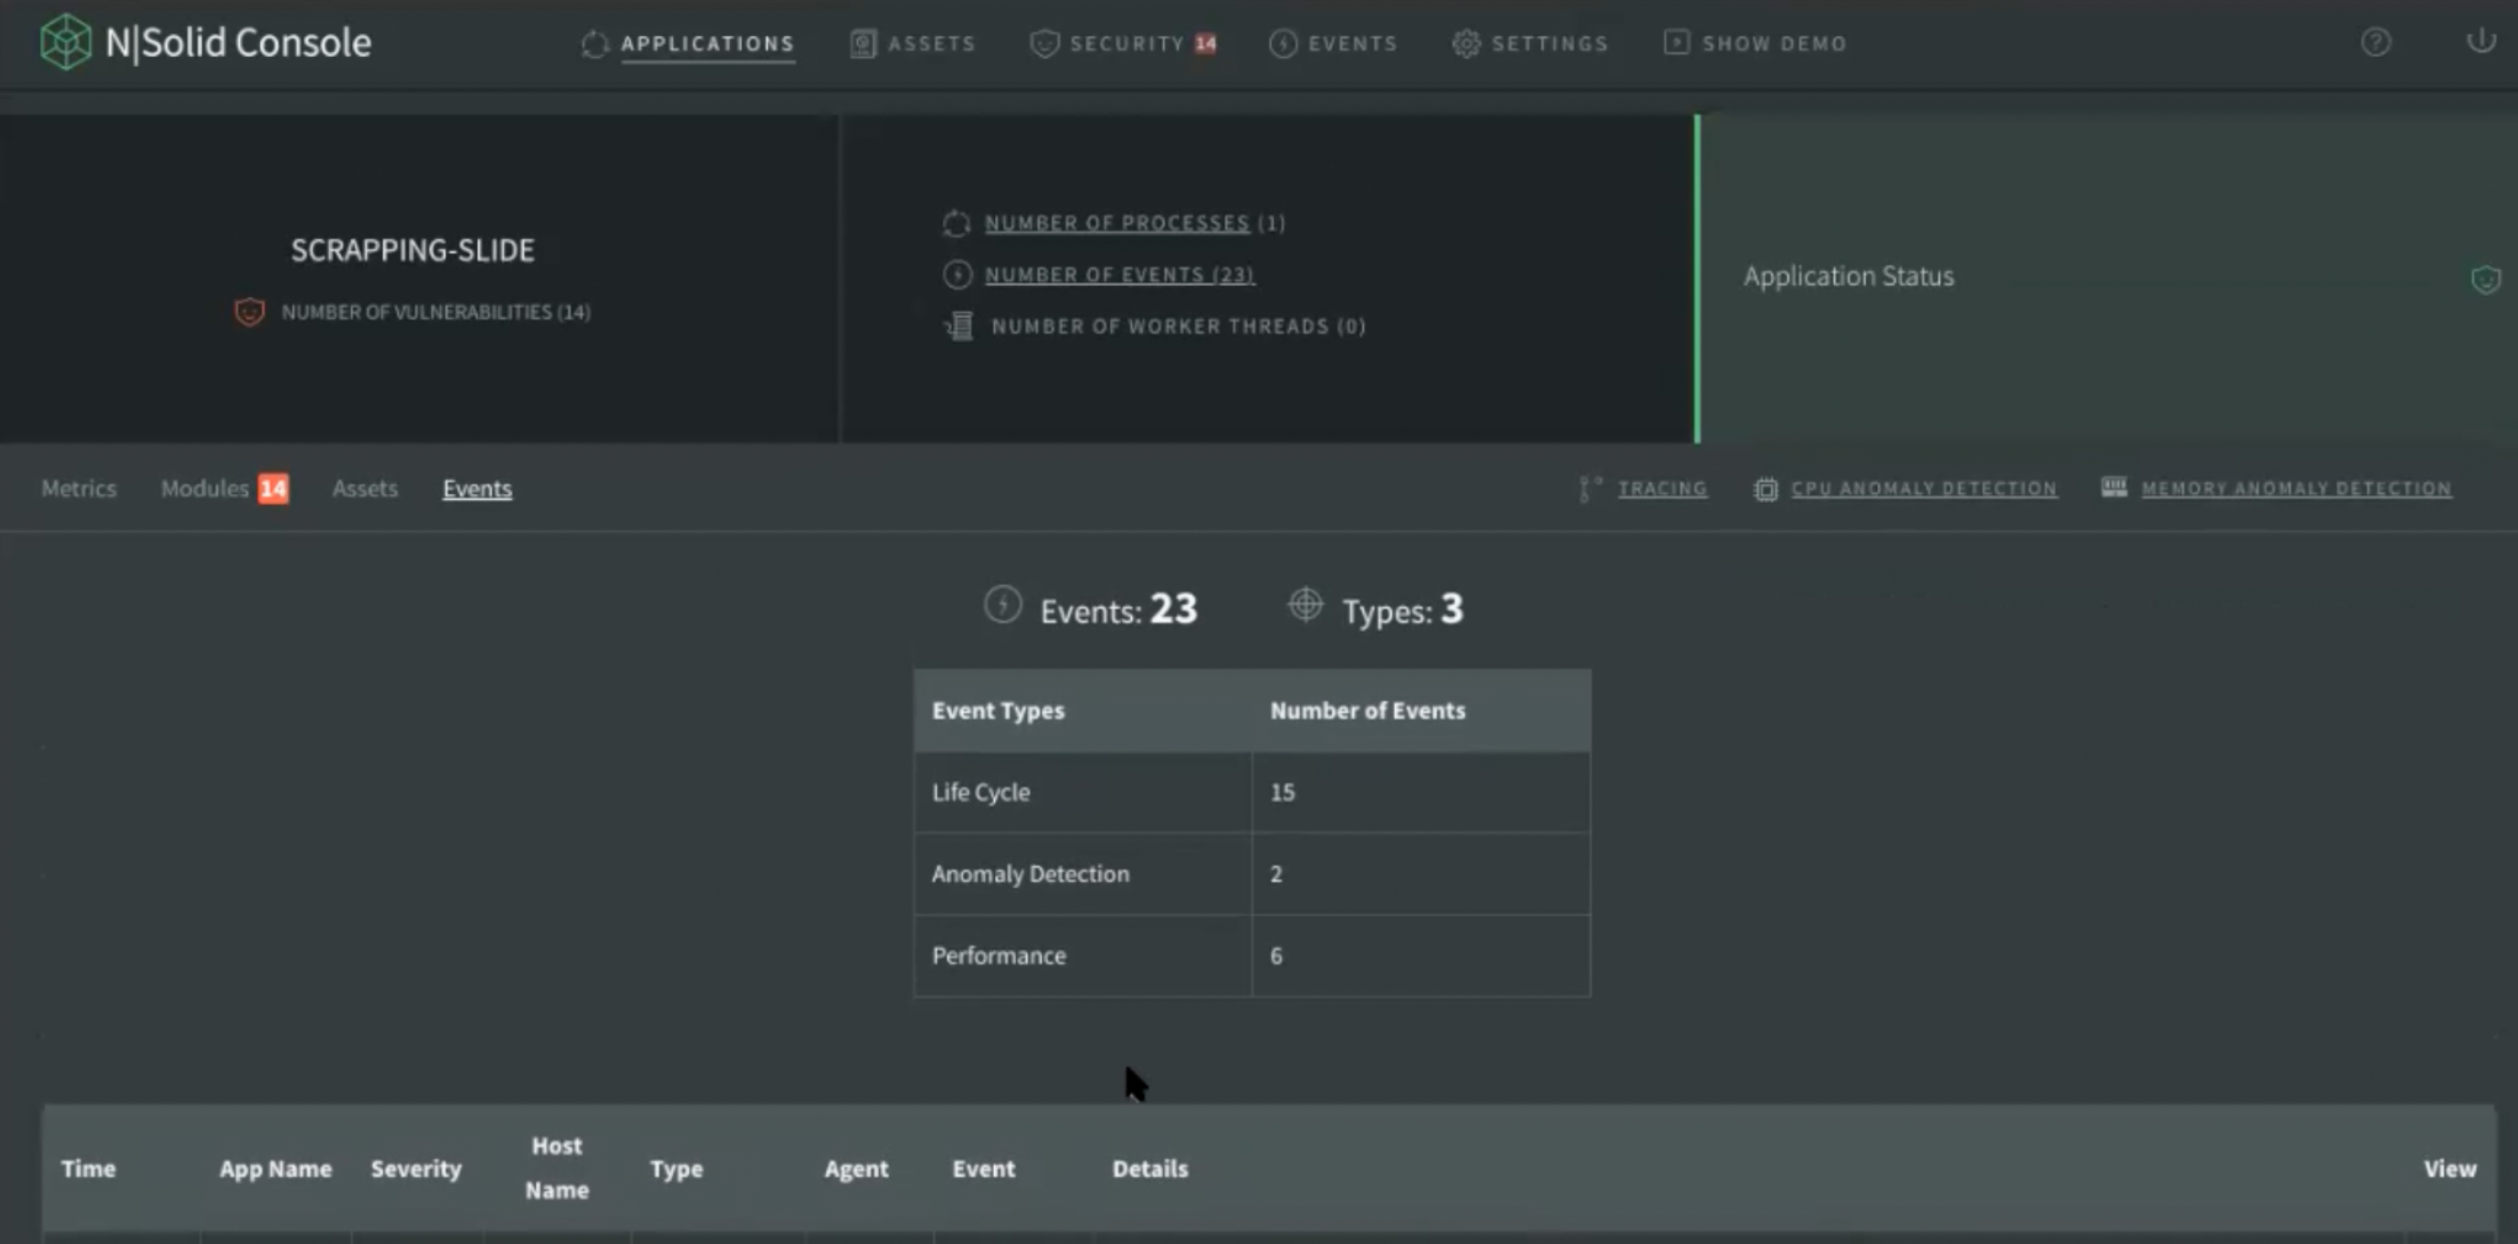
Img 10. Application Dashboard — Events View
Users can also select to view the summary of events, and you can filter by date, agent ID, host name, application, type or by severity.
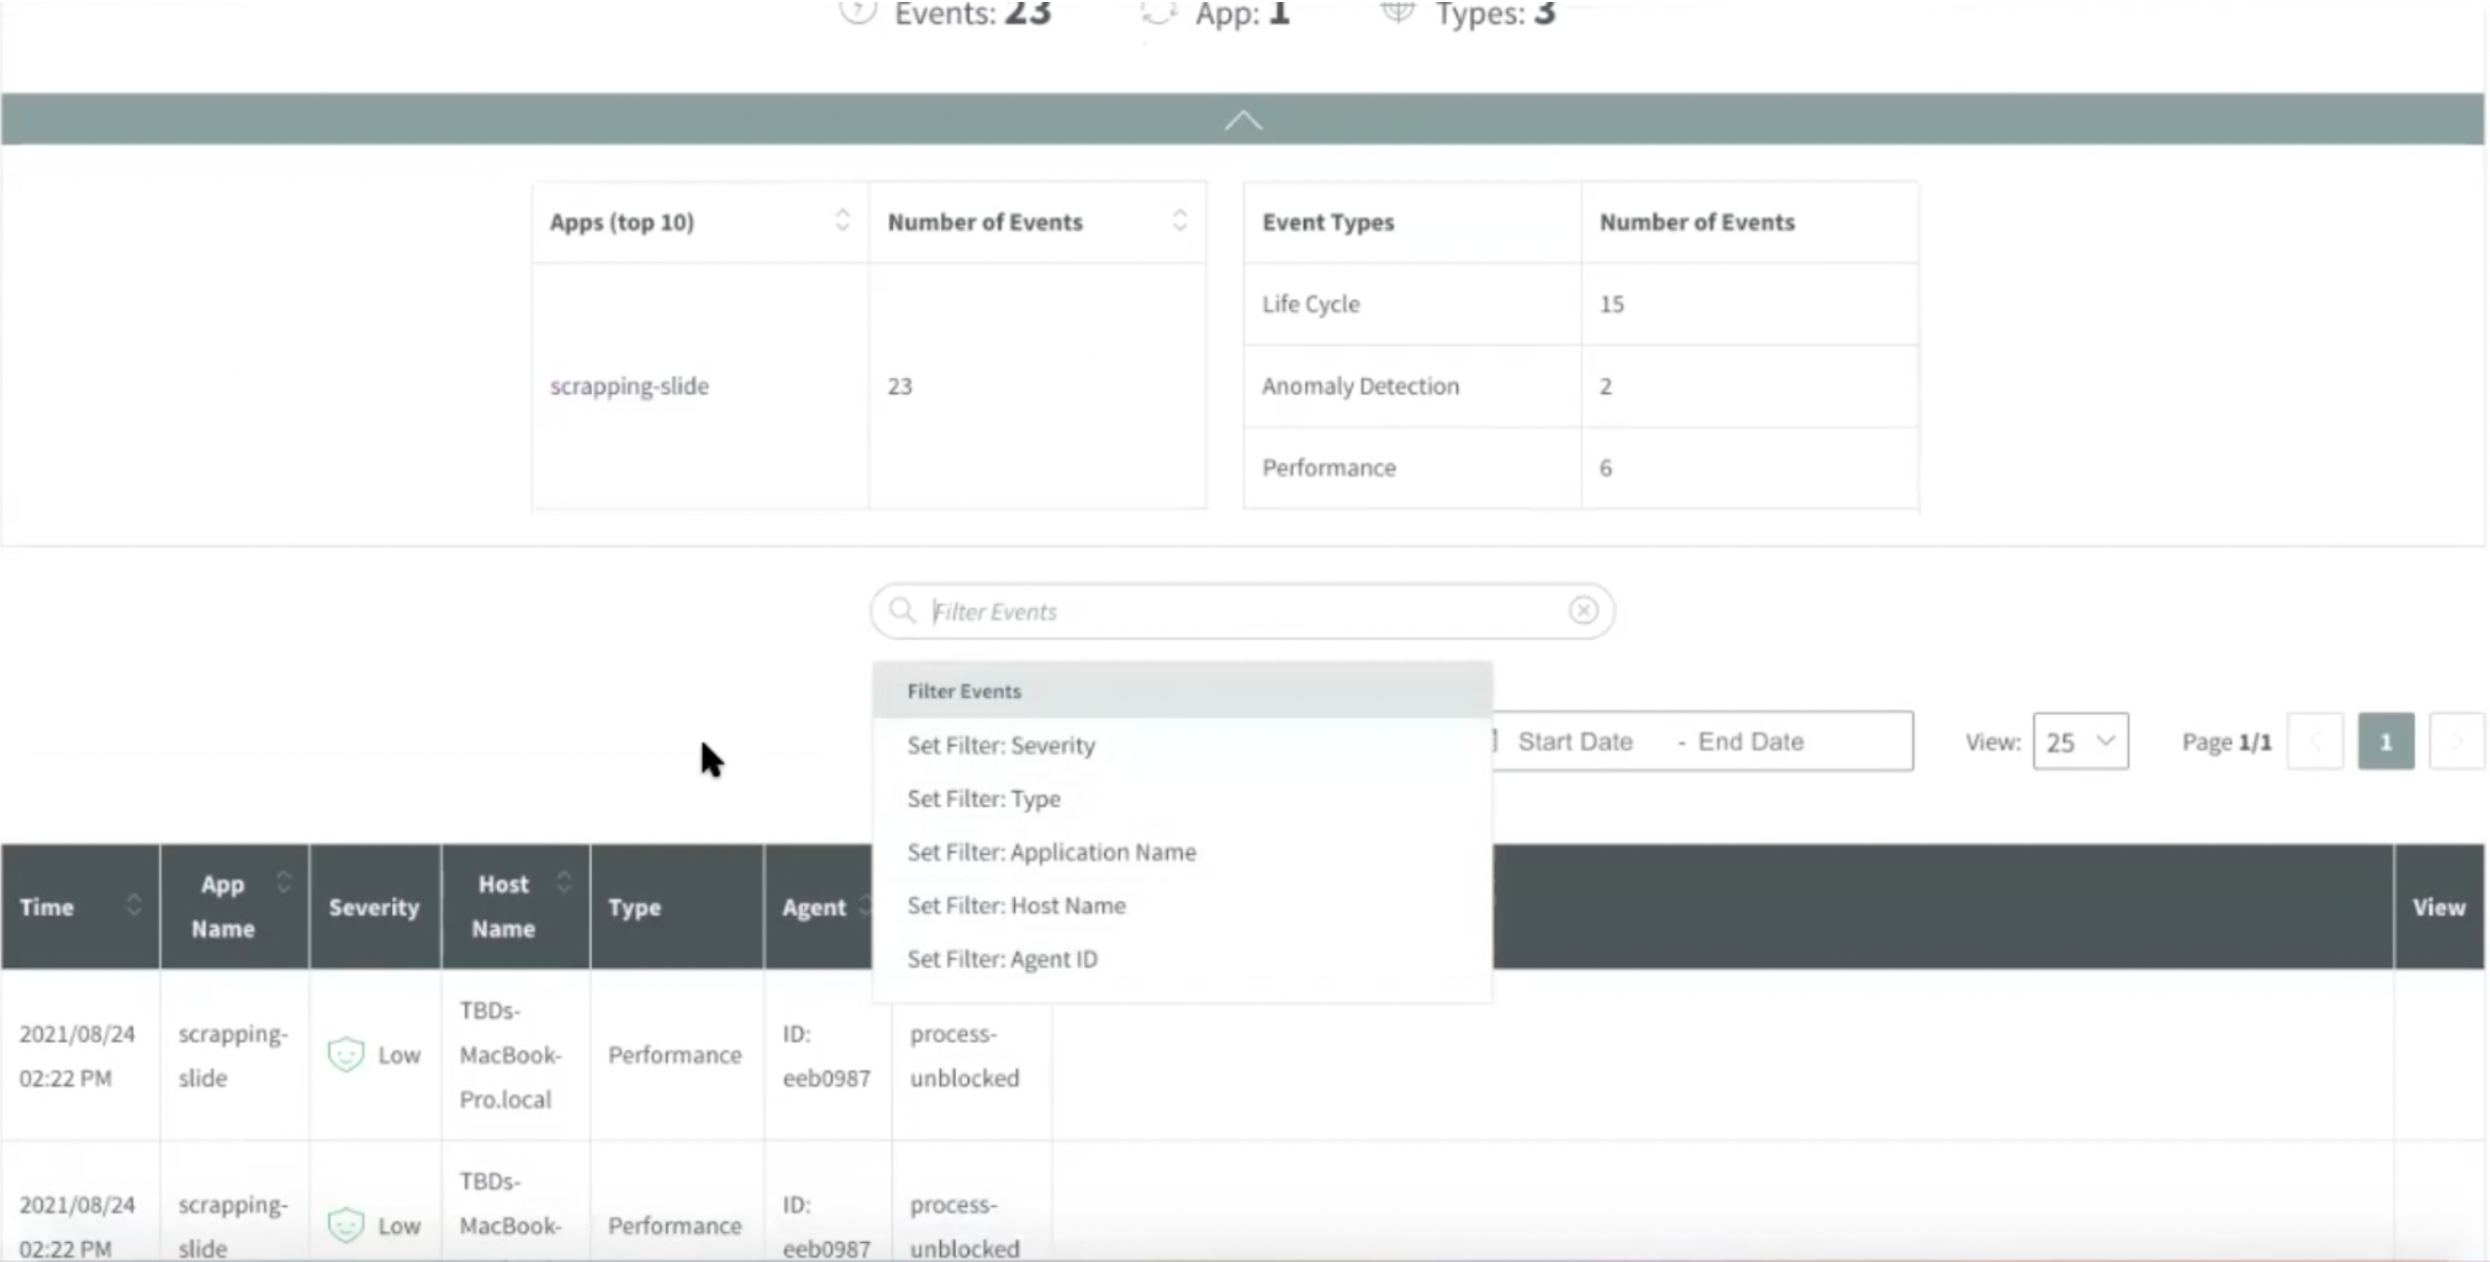
Img 11. Application Dashboard— Events Summary
Directly in the application, for example in image ‘Scrapping Slide’, you can navigate from the directory without having to return to the list of applications or returning to the Application Dashboard.
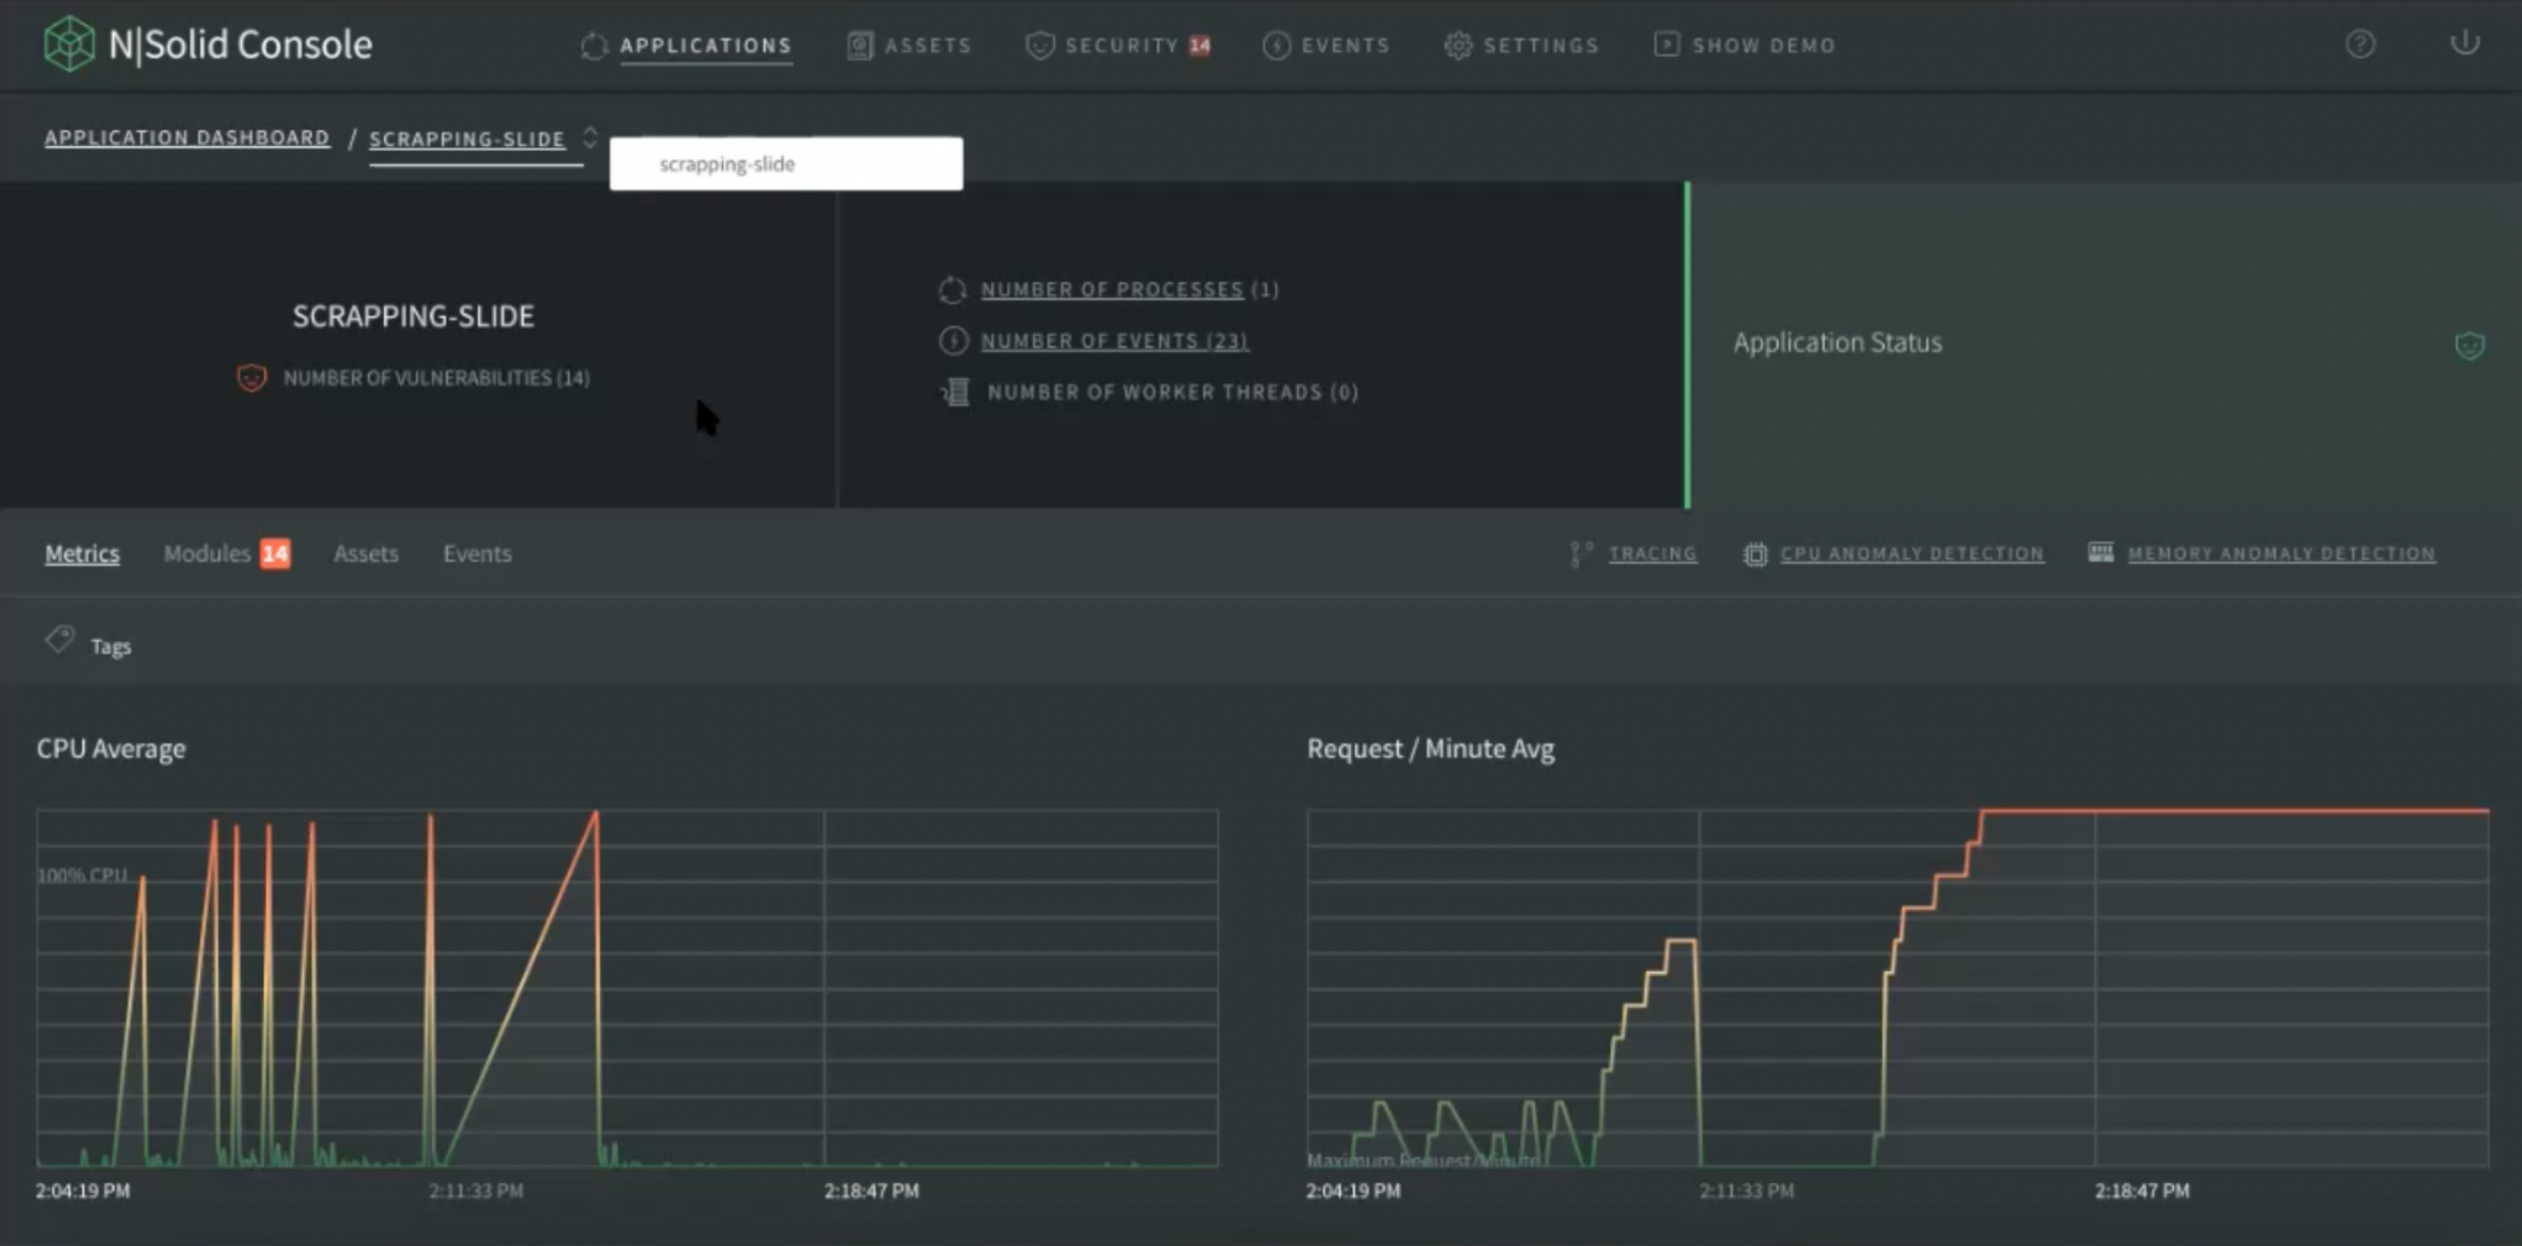
Img 12. Application Dashboard — Navigation by Menu View
TRACING
Tracing [https://opentelemetry.io/] is a new functionality in our product, N|Solid, and is implemented following an industry standard in distributed systems that has been promoted, even at a multilanguage level. Users should expect an OpenTelemetry compliant API in N|Solid that will allow to manually instrument their code.
Our first step has been to implement automatic tracing in our product. Most of other APM's support automatic tracing of HTTP out of the box without instrumenting their code (they usually just need to require some specific module and use it before launching the actual http server), our tracing is different because for HTTP and for DNS you don't need to add anything to your code, we directly listen to the core of Node, and automatically capture the information.
When tracing is activated in N|Solid, it provides the visibility of what your application is doing at the HTTP and DNS level. Information for every http transaction and dns request is collected, allowing to know, for example, which specific http requests are taking longer to process or whether a DNS server is too slow resolving specific domains.
Additionally, our tracing is performance oriented, our focus is that the observability we provide should be the least expensive in terms of resources for the user. To obtain the observability of the processes, we spend fewer resources without having a high impact on CPU or Memory. #CompetitiveAdvantage
About the tracing functionality in N|Solid
In this area it shows you each of the traces that were generated to an API that you have running with N|Solid. With traces we mean the requests that have been made to this API.
In this feature, we want to show how long each one of these requests has taken, and define that if that request exceeds a certain time limit, painting it a different color. If the duration range is above the limit, the colors indicate -from green to red on that scale- the range of time of that request. You can select the boxes to modify the trace filter so the generated traces appear inside the box.
The histogram works as follows:
- X axis represents the time (in principle the last 24 hours)
- Y axis represents the duration of the traces (latency of http or dns requests).
Each box represents the density of traces within the time range and duration range. The darker the box color is, the higher the number of traces in a specific time period and with a specific duration range.
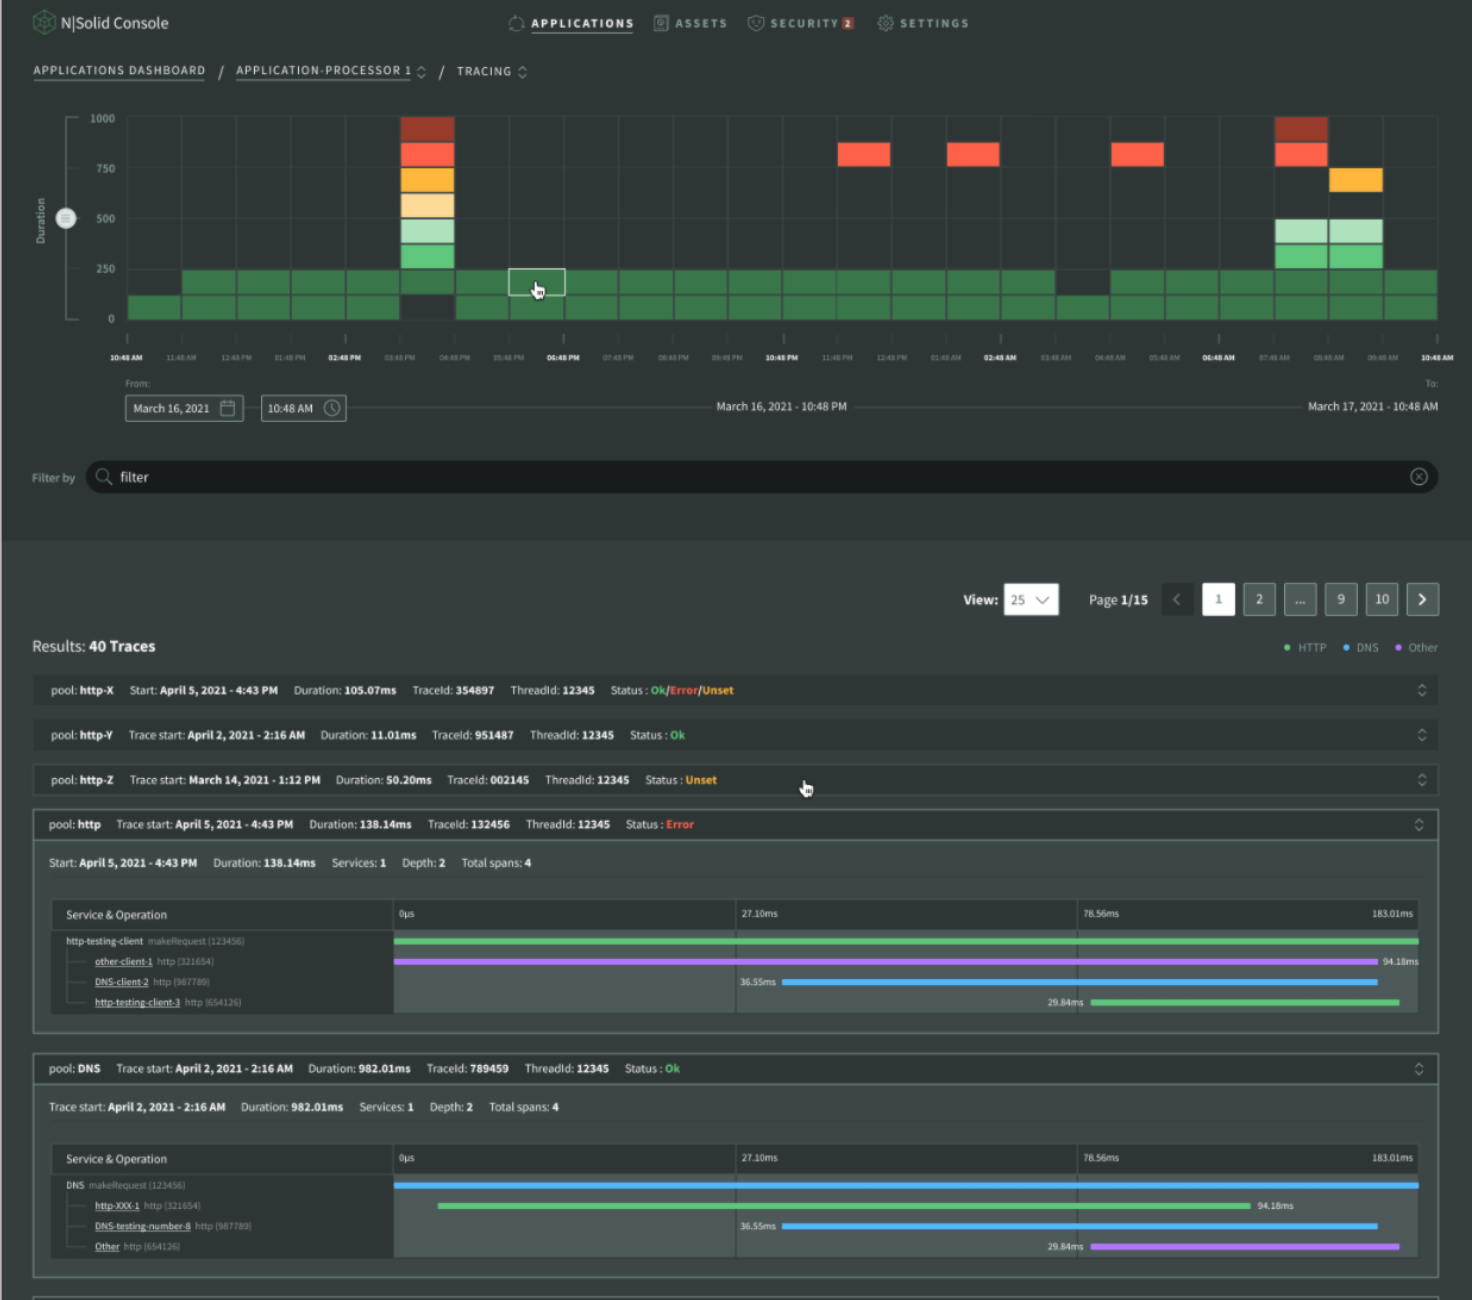
Img 13. Application Dashboard — Application processor — Tracing
At the bottom we can see the range of dates, which are initially 24 hours from the moment I consult the application, to the visualization, counting 24 hours backwards. If you start playing with the calendar to move the dates and time, it moves the range, but always having 24 hours as a parameter.
The trace or request can be seen in the results list, each request has its status, request number, duration, the time they were made and which function executed the request.
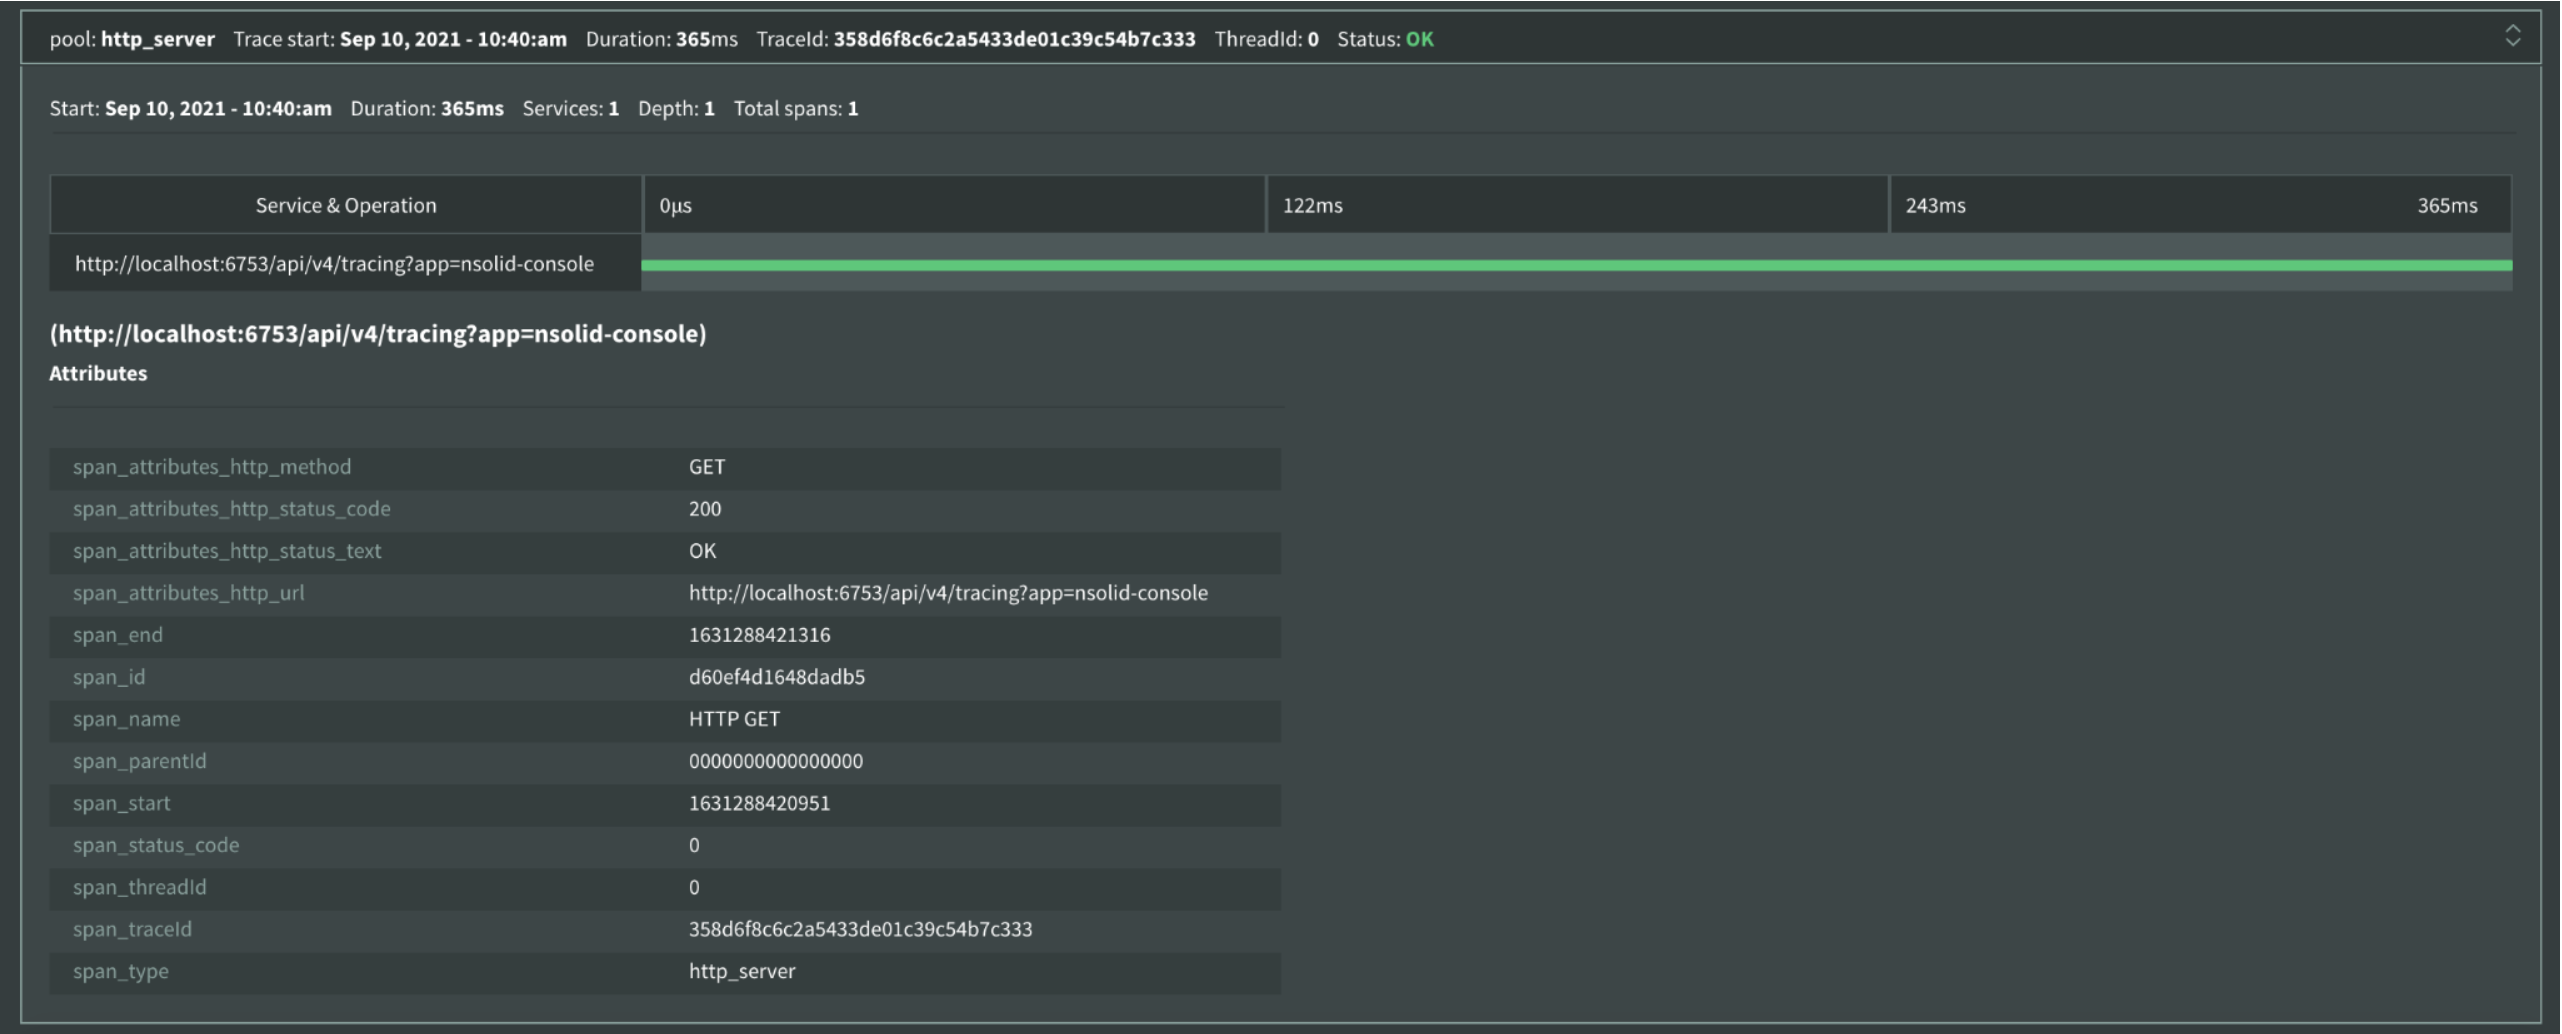
Img 14. Tracing — Result List View
A differentiation is made by colors: those that are HTTP are painted green, those that are DNS are painted blue and any other purple. In more detail we can see the request can have a related child (node), and these also have a duration time –that is why they are graphed and also show their attributes. In status it gives more detailed information about the request.
CPU AND MEMORY ANOMALY DETECTION
To explain this functionality in a more simple way, the tool lets you know when an anomaly happened and why, and review the details of what could be the root of the issue. To go deep into diagnostics you can use additional tools already available, like CPU Profiles or Heap Snapshots. Let's learn a little bit more about each functionality in N | Solid 👇
CPU Anomalies
Anomalies for CPU can be two types, the ones on the left happen after specific CPU usage thresholds are passed, for example CPU utilization that exceeds 30%.
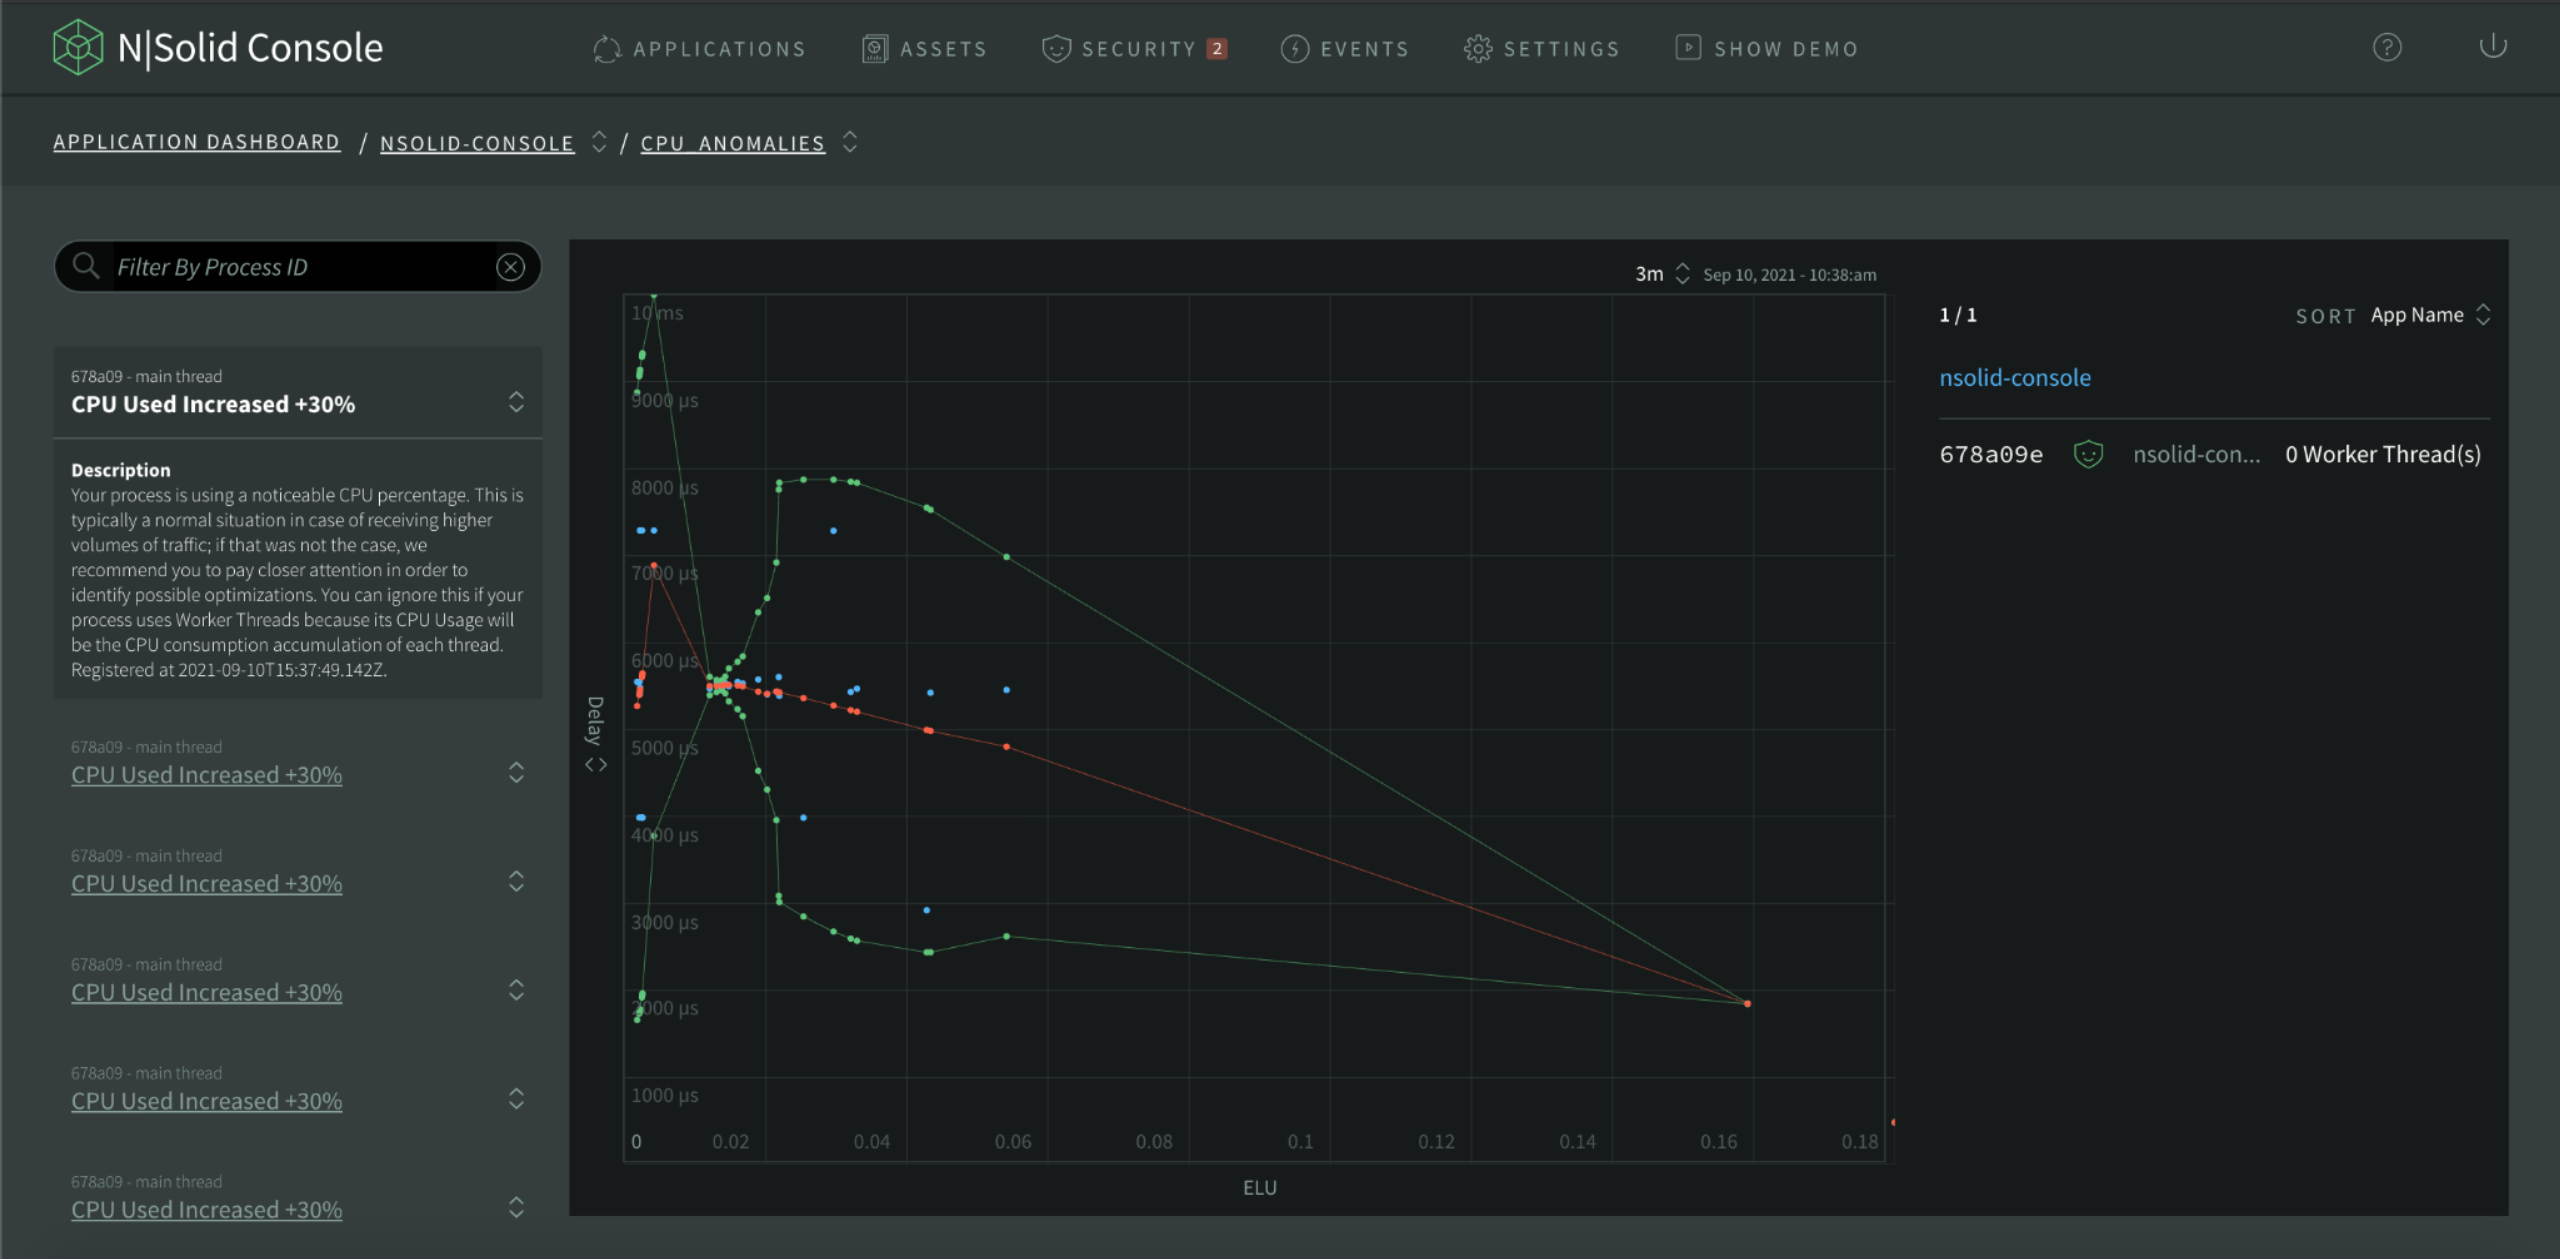
Img 15. CPU Anomalies — CPU Used View
The scatterplot of the middle and right panel list, plot anomaly information coming from the runtime running your application processes based on the Event Loop Utilization metric against other metrics.
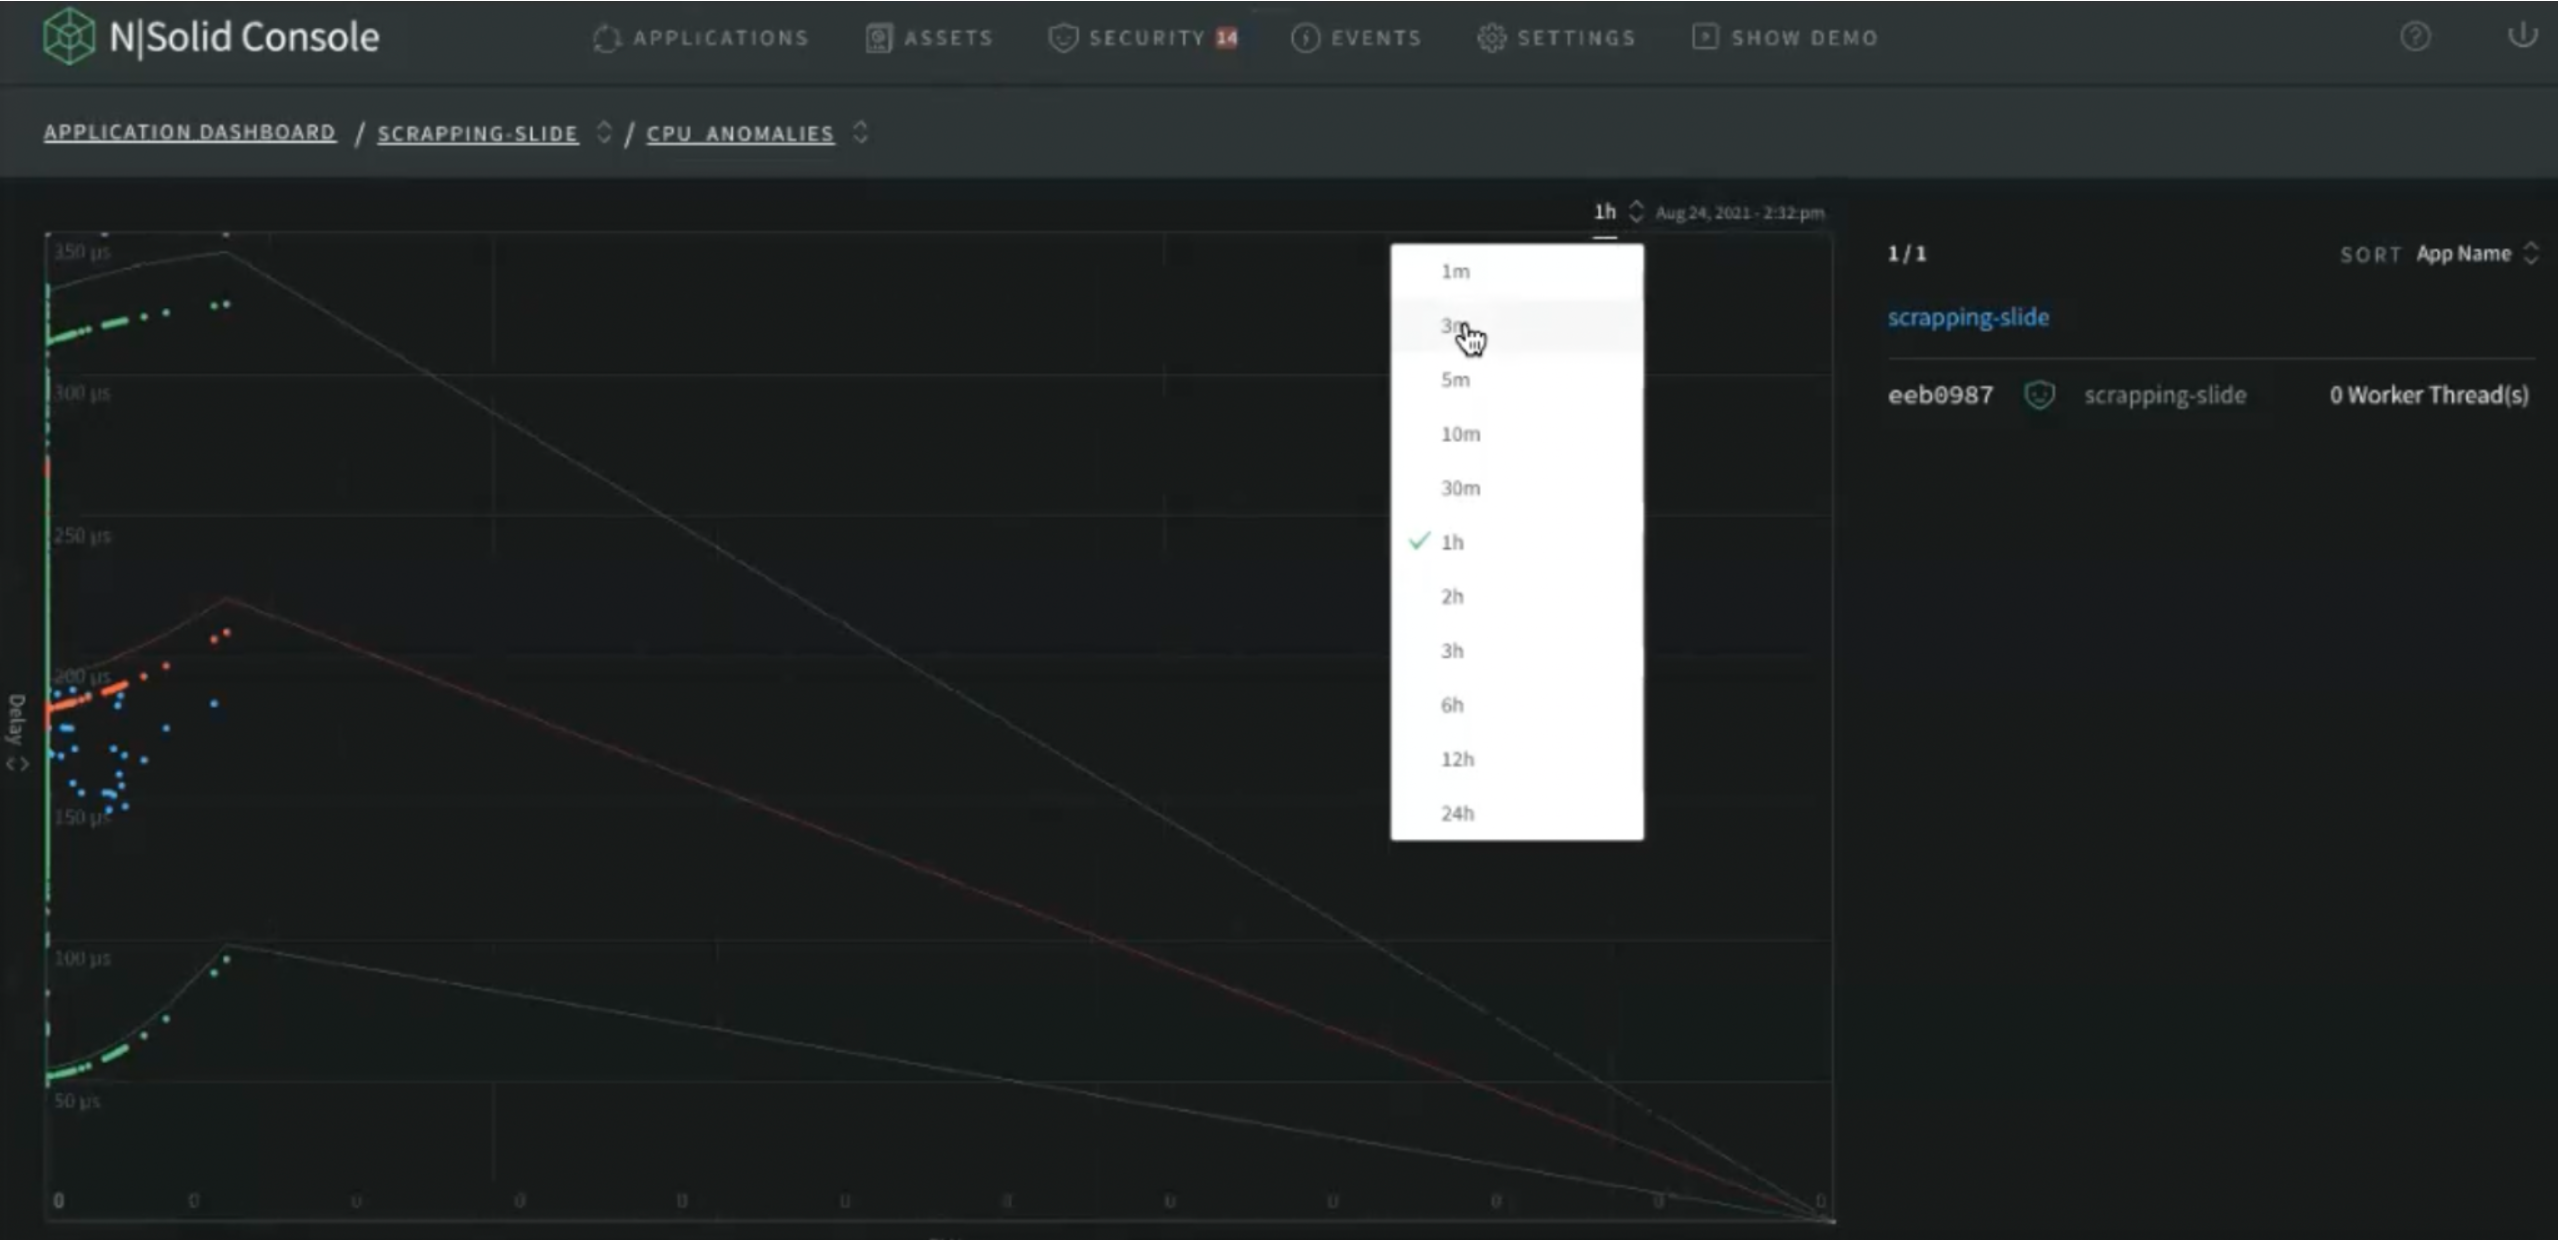
Img 16. CPU Anomalies — Select Time View
In order to correctly identify an anomaly it is important that the detection method be accurate. CPU is no longer enough of a measurement to scale applications. Other factors such as garbage collection, crypto, and other tasks placed in libuv's thread pool can increase the CPU usage should not be indicative of the application's overall health. Even applications that don't use Worker threads are susceptible to this issue.
In addition, there is no cross-platform way of measuring the CPU usage per thread, which doesn't mean that the CPU is useless. CPU and event loop utilization (or ELU) is crucial to see if an application is reaching hardware limitations. But not being able to gather metrics on a per-thread basis drastically limits our ability to determine when the application is reaching its threshold.
** Note:** ELU (Event Loop Utilization) is the ratio of time the event loop is not idling in the event provider to the total time the event loop is running, and is equal to the loop processing time divided by the loop duration.
With that being said, N|Solid Console provides an ELU-based Scatterplot, which utilizes the most reliable metric to use as a baseline for comparison.
The ELU Scatterplot
The Scatterplot is an animated graph that provides an overview of your applications' performance across all or a subset of connected processes, when a specific process has at least one active worker thread, the process will be highlighted.
Using ELU as the axis to compare metrics across multiple processes is a reliable way to identify anomalies without false positives. With this information anomalous processes can be automated to take CPU profiles, heap snapshots, etc.
In the N|Solid Console, go to the applications dashboard and click CPU ANOMALY DETECTION.

Img 17. N|Solid Console — CPU Anomaly Detection View
The blue dots are the raw data. Red line is the regression line (estimated average), yellow and green are the errors from the regression.
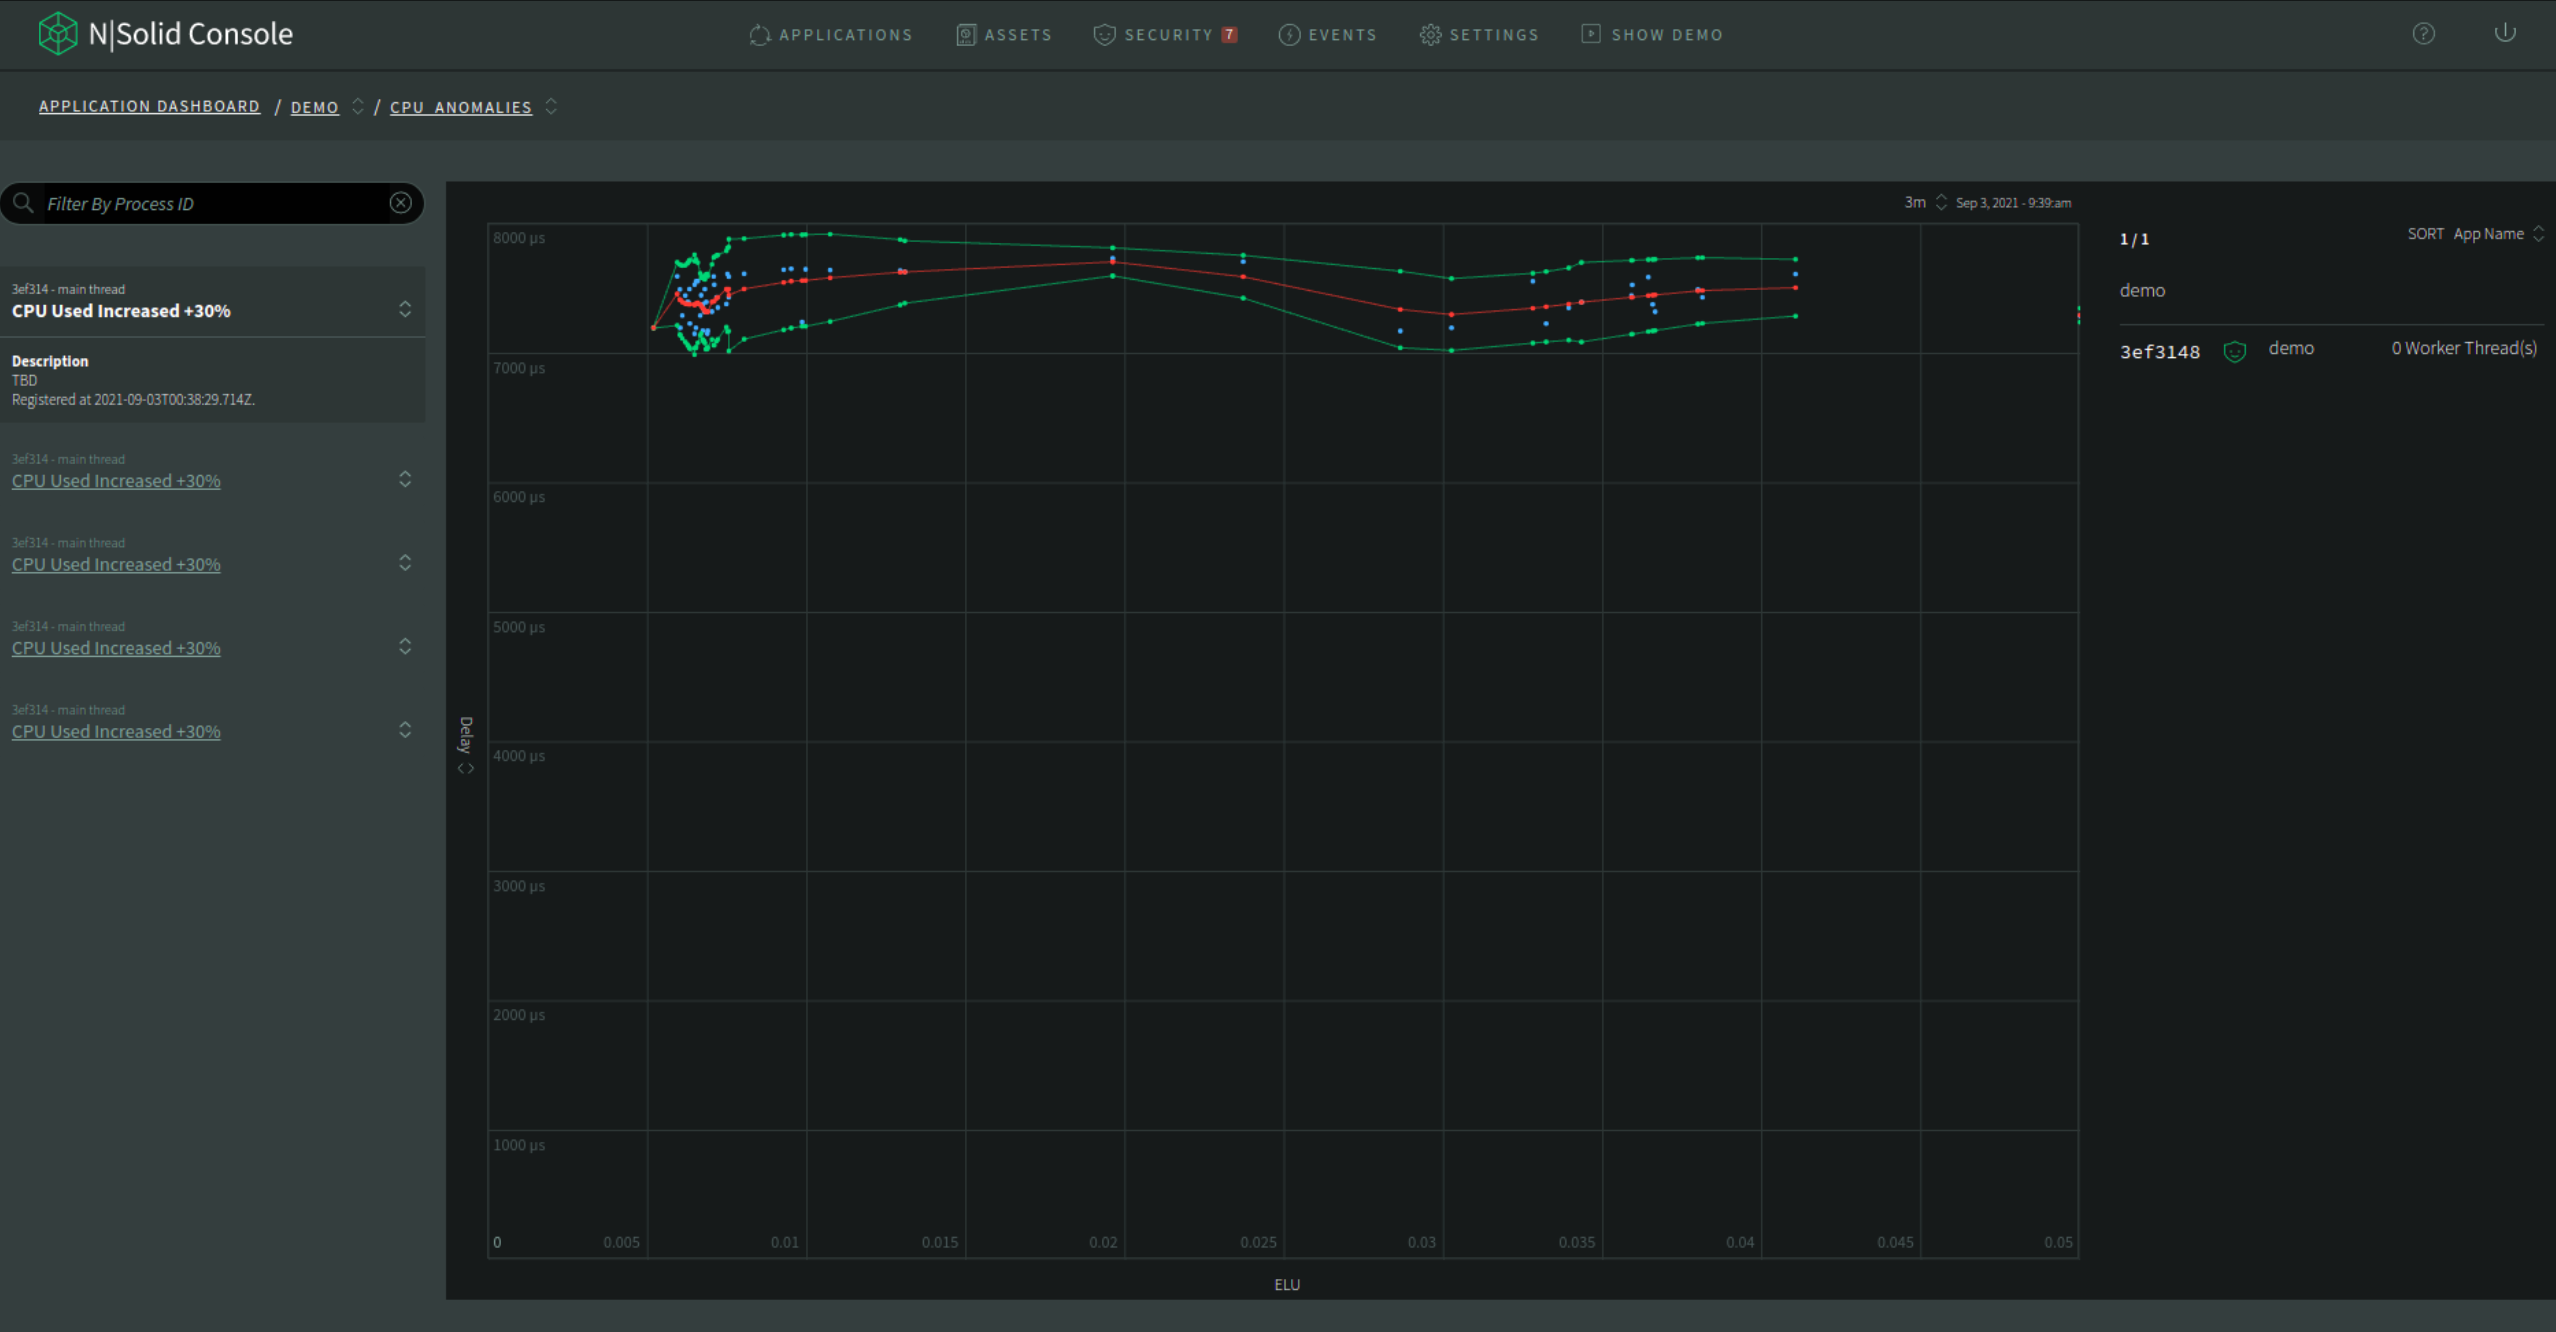
Img 18. CPU Anomalies — Regresion View
The default y-axis value is delay, which equals to (providerDelay + processingDelay) / 1e6 in microseconds.
-
The blue dots: The blue dots are the raw data from all the applications. All the application raw data are the same color. It only highlights the points from the same application when a single point is hovered with the mouse.
-
The red line: The red line is the moving average of all the raw data (blue dots). There is no application-specific information to show when those points are hovered.
-
The yellow and green line: The yellow and green lines are the error margin for the moving average (red dots).
CPU Anomalies List
At the right side, there's a list of CPU anomalies which can be filtered by agent ID. To see the details of an anomaly, click the title of an item.
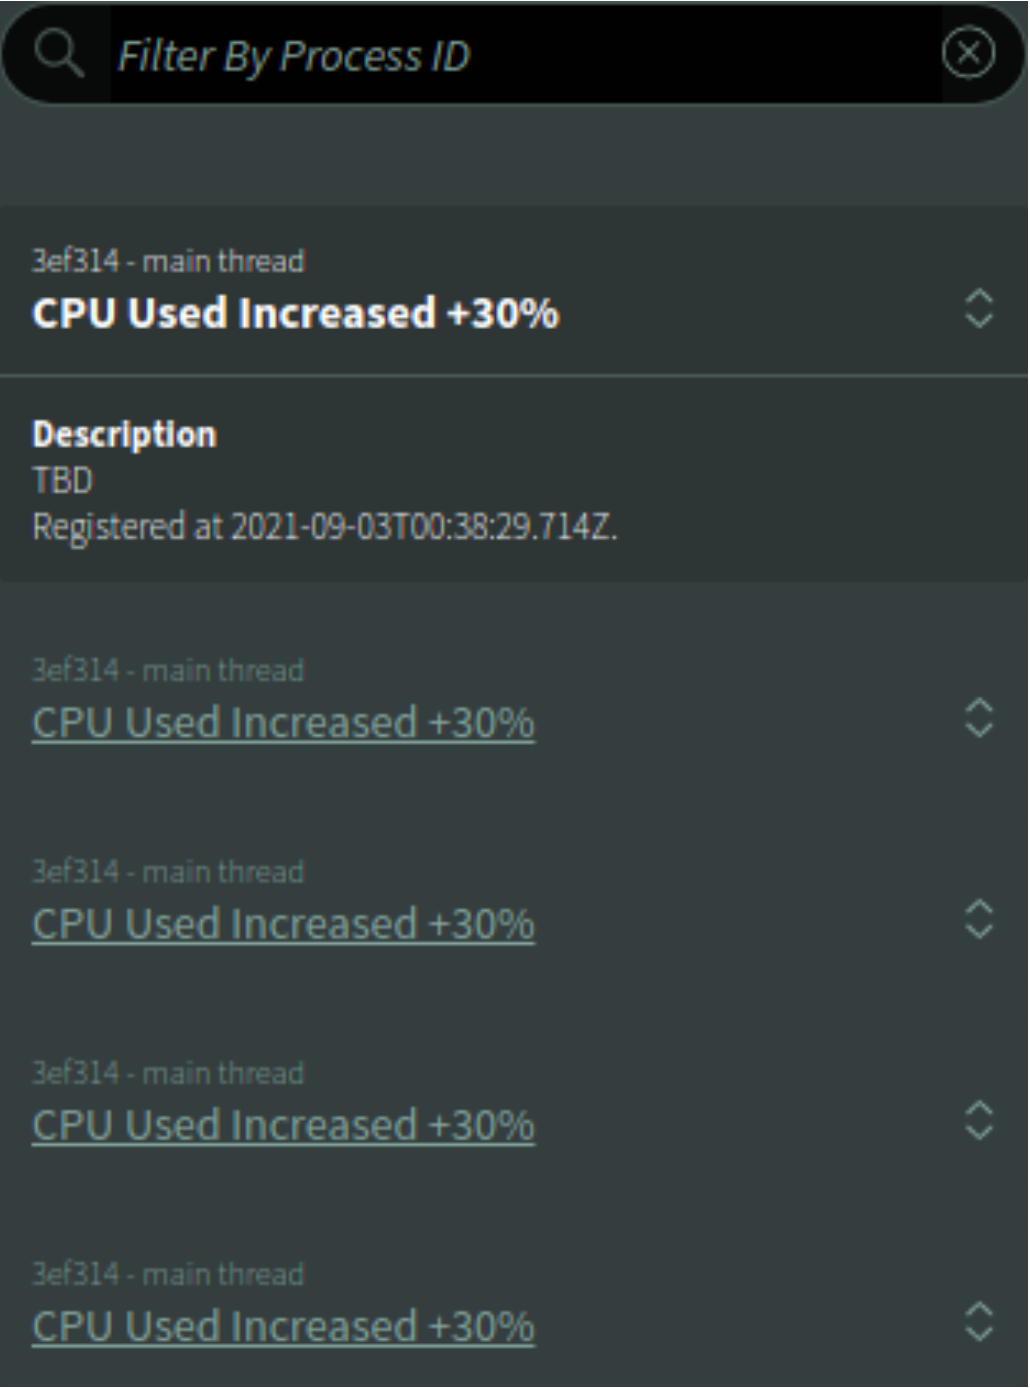
Img 19. CPU Anomalies — Events Tab View
Note: If you are redirected from
Eventstab, the corresponding anomalies will be shown.
Memory Anomalies
In this mode, the specific process and threads that exceed the different thresholds defined internally are shown on the left side with a brief explanation of what could be happening. We have determined that an application anomaly can be analyzed faster if different metrics are taken into account, like in the image below.
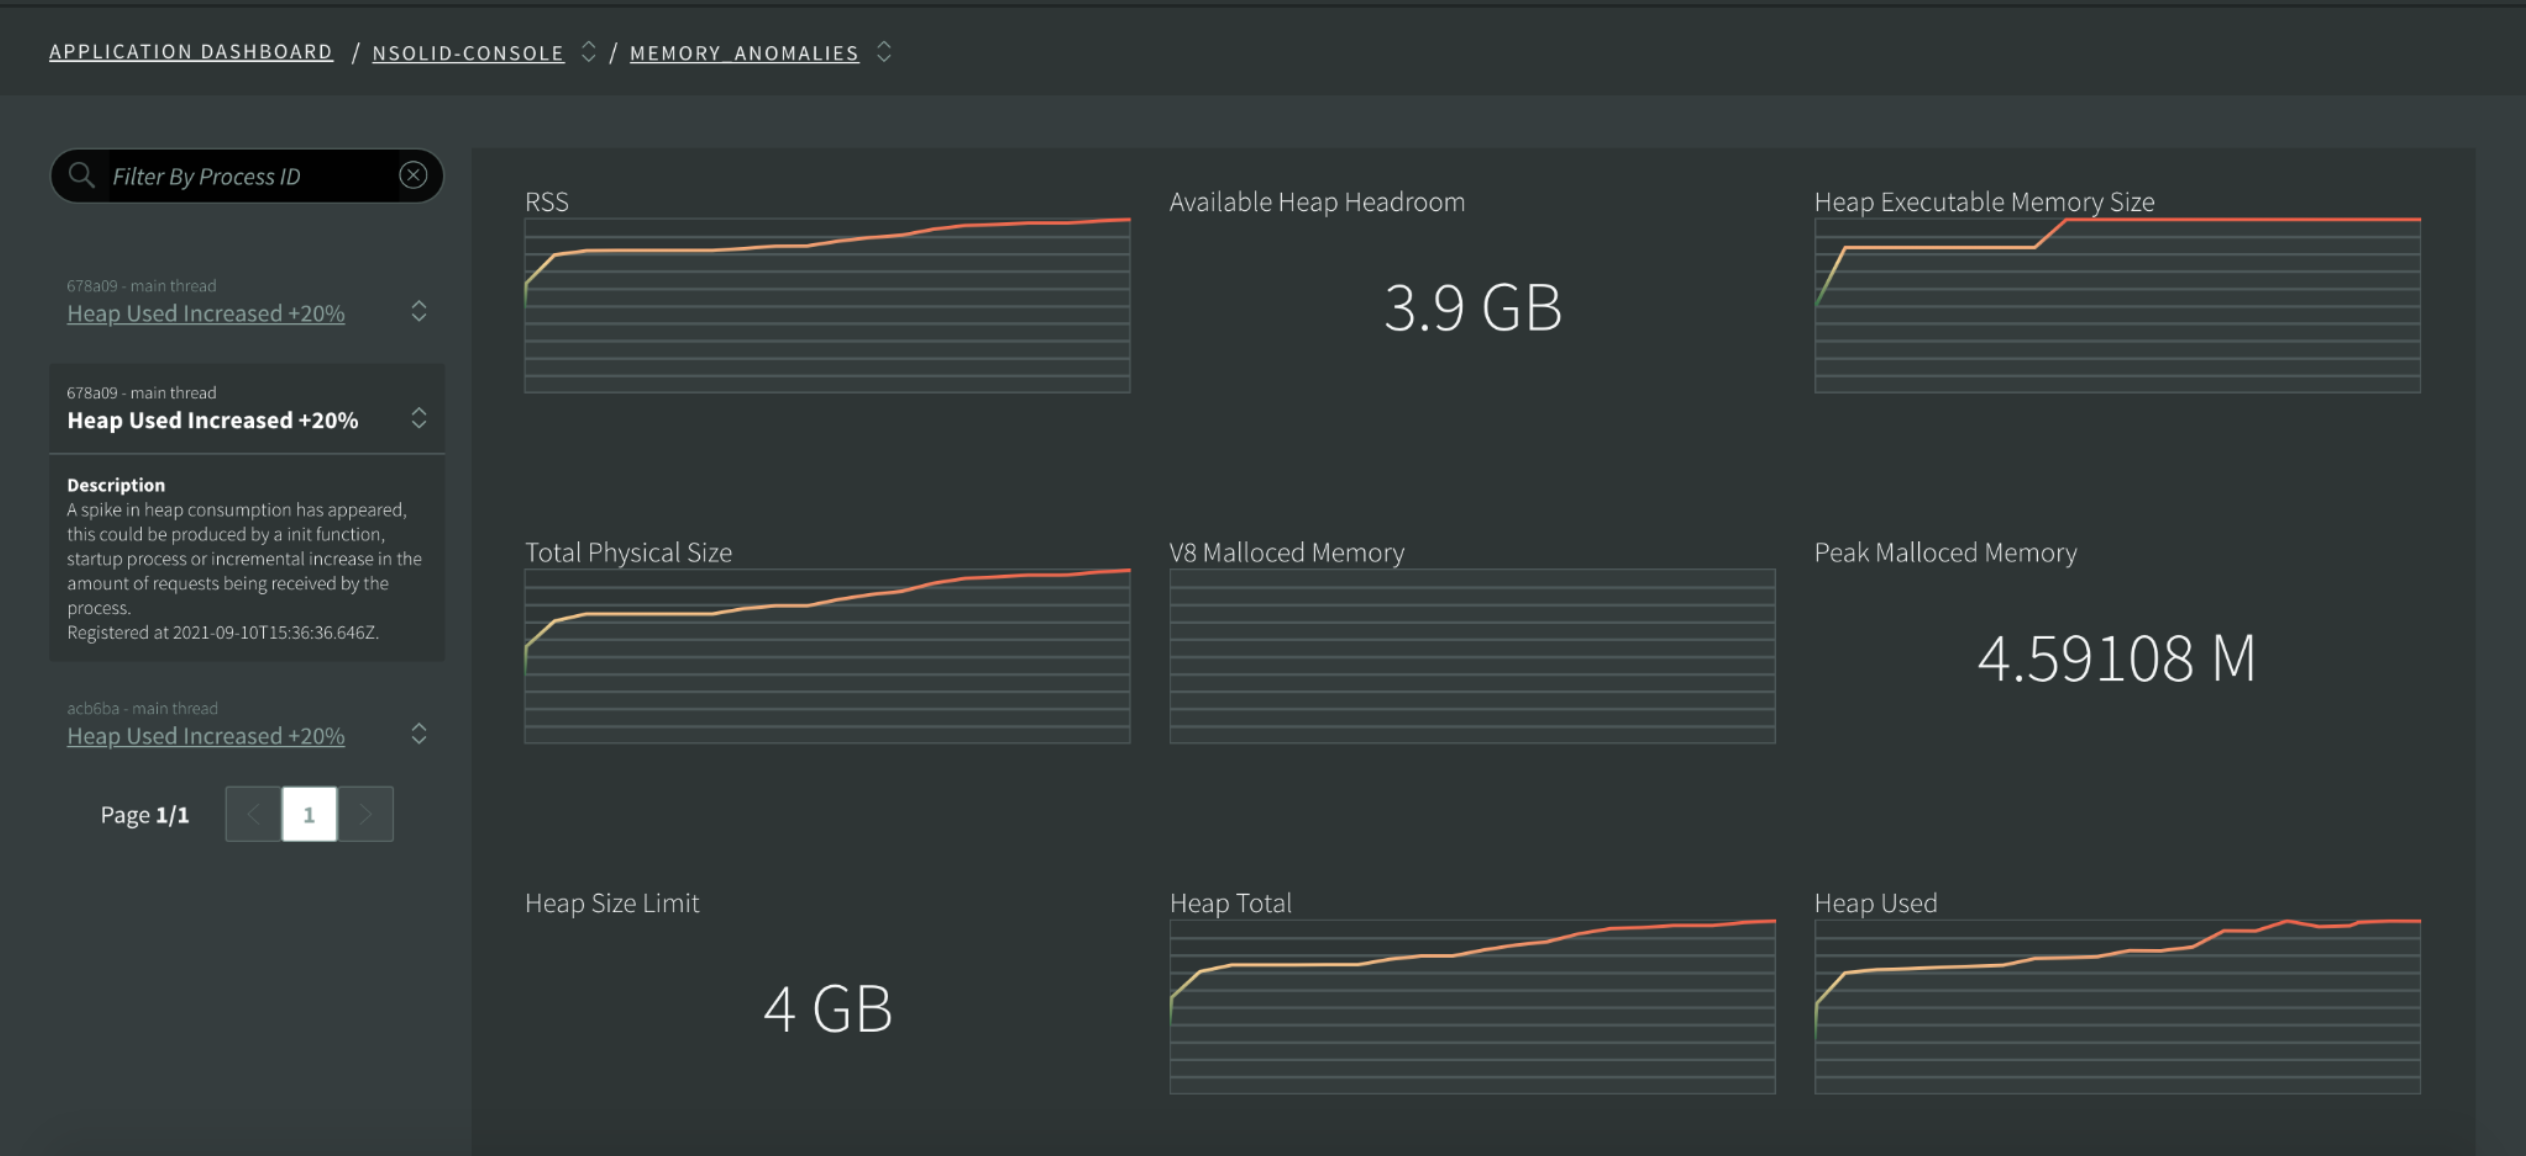
Img 20. CPU Anomalies — Heap Used View
You are going to get charts loaded with context metrics information about each anomaly you click on, to facilitate the analysis and historic access to what was the state of the event when it happened.
Do you want to save money and developers time?
Feel free to contact us at info@nodesource.com or in this form .
To get the best out of Node.js, try N|Solid SaaS now!, an augmented version of the Node.js runtime, enhanced to deliver low-impact performance insights and greater security for mission-critical Node.js applications. #KnowYourNode