Enhance Observability with Opentelemetry tracing - Part 1
Recently, conversations have been increasing around OpenTelemetry; it is gaining more and more momentum in Node.js development circles, but what is it? How can we take advantage of the key concepts and implement them in our projects?
Of note, NodeSource is a supporter of OpenTelemetry, and we have recently implemented full support of the open-source standard in our product N|Solid. It allows us to make our powerful Node.js insights accessible via the protocol.
Opentelemetry is a relatively recent vendor-agnostic emerging standard that began in 2019 when OpenCensus and OpenTracing combined to form OpenTelemetry - seeking to provide a single, well-supported integration surface for end-to-end distributed tracing telemetry. In 2021, they released V1. 0.0, offering stability guarantees for the approach.
And most important, OpenTelemetry is an open-source observability project/framework with a collection of software development kits (SDKs), APIs, and tools for instrumentation from the Cloud Native Computing Foundation (CNCF).
W3C Trace Context is the standard format for OpenTelemetry. Cloud providers are expected to adopt this standard, providing a vendor-neutral way to propagate trace IDs through their services. Organizations use OpenTelemetry to send collected telemetry data to a third-party system for analysis.
But to break down its history a bit, we think it's important to understand the concept of Observability.
At Nodesource, as you likely know, we work daily in Observability, focusing exclusively on the Node.js runtime and N|Solid from N|Solid 4.8.0 supports some OpenTelemetry features. But before getting deeper in OTEL, it is important to understand Observability and try to resolve this important question: What is Observability?
Setting the foundations to talk about OpenTelemetry
It's important to understand that when we talk about Observability, we need first to know what questions we seek to answer or clarify when detailing a system.
The first question often asked is why my application has specific behavior. And to solve this and other questions, we first must instrument our system so that our application can emit signals, that is, traces, metrics, and logs. When we correctly do this, we have the necessary information needed.
Observability is the ability to measure the internal states of a system by examining its outputs. - Splunk
Detailing a system through Data Collection: Telemetry Data
Your systems and apps need proper tooling to collect the appropriate telemetry data to achieve Observability. But what is the telemetry data that we need?
The three key concepts are :
-
Metrics
-
Logs
-
Traces
Ok, let's define each of these concepts:
Metrics
Metrics: are aggregations over a period of time of numeric data about your infrastructure or application. Examples include system error rate, CPU utilization, and request rate for a given service.
As quoted by isitobservable.io, OpenTelemetry has three metric instruments :
- Counter: a value that is summed over time (similar to the Prometheus counter)
- Measure: a value that is aggregated over time (a value over some defined range)
- Observer: captures a current set of values at a given time (like a gauge in Prometheus)
The context is still very important, along with metric information like name, description, unit, kind (counter, observer, measure), label, aggregation, and time.
Logs
Logs: A Log is a timestamped message emitted by services or other components. They are not necessarily associated with any particular user request or transaction, but they become more valuable when they are.
The logical line would tell us that here we must jump to traces because it is part of the three key concepts. But before defining what a trace is, we must zoom in on the concept of Span.
Span
Span: A Span represents a unit of work or operation. It tracks specific operations that a request makes, painting a picture of what happened during the time in which that operation was executed.
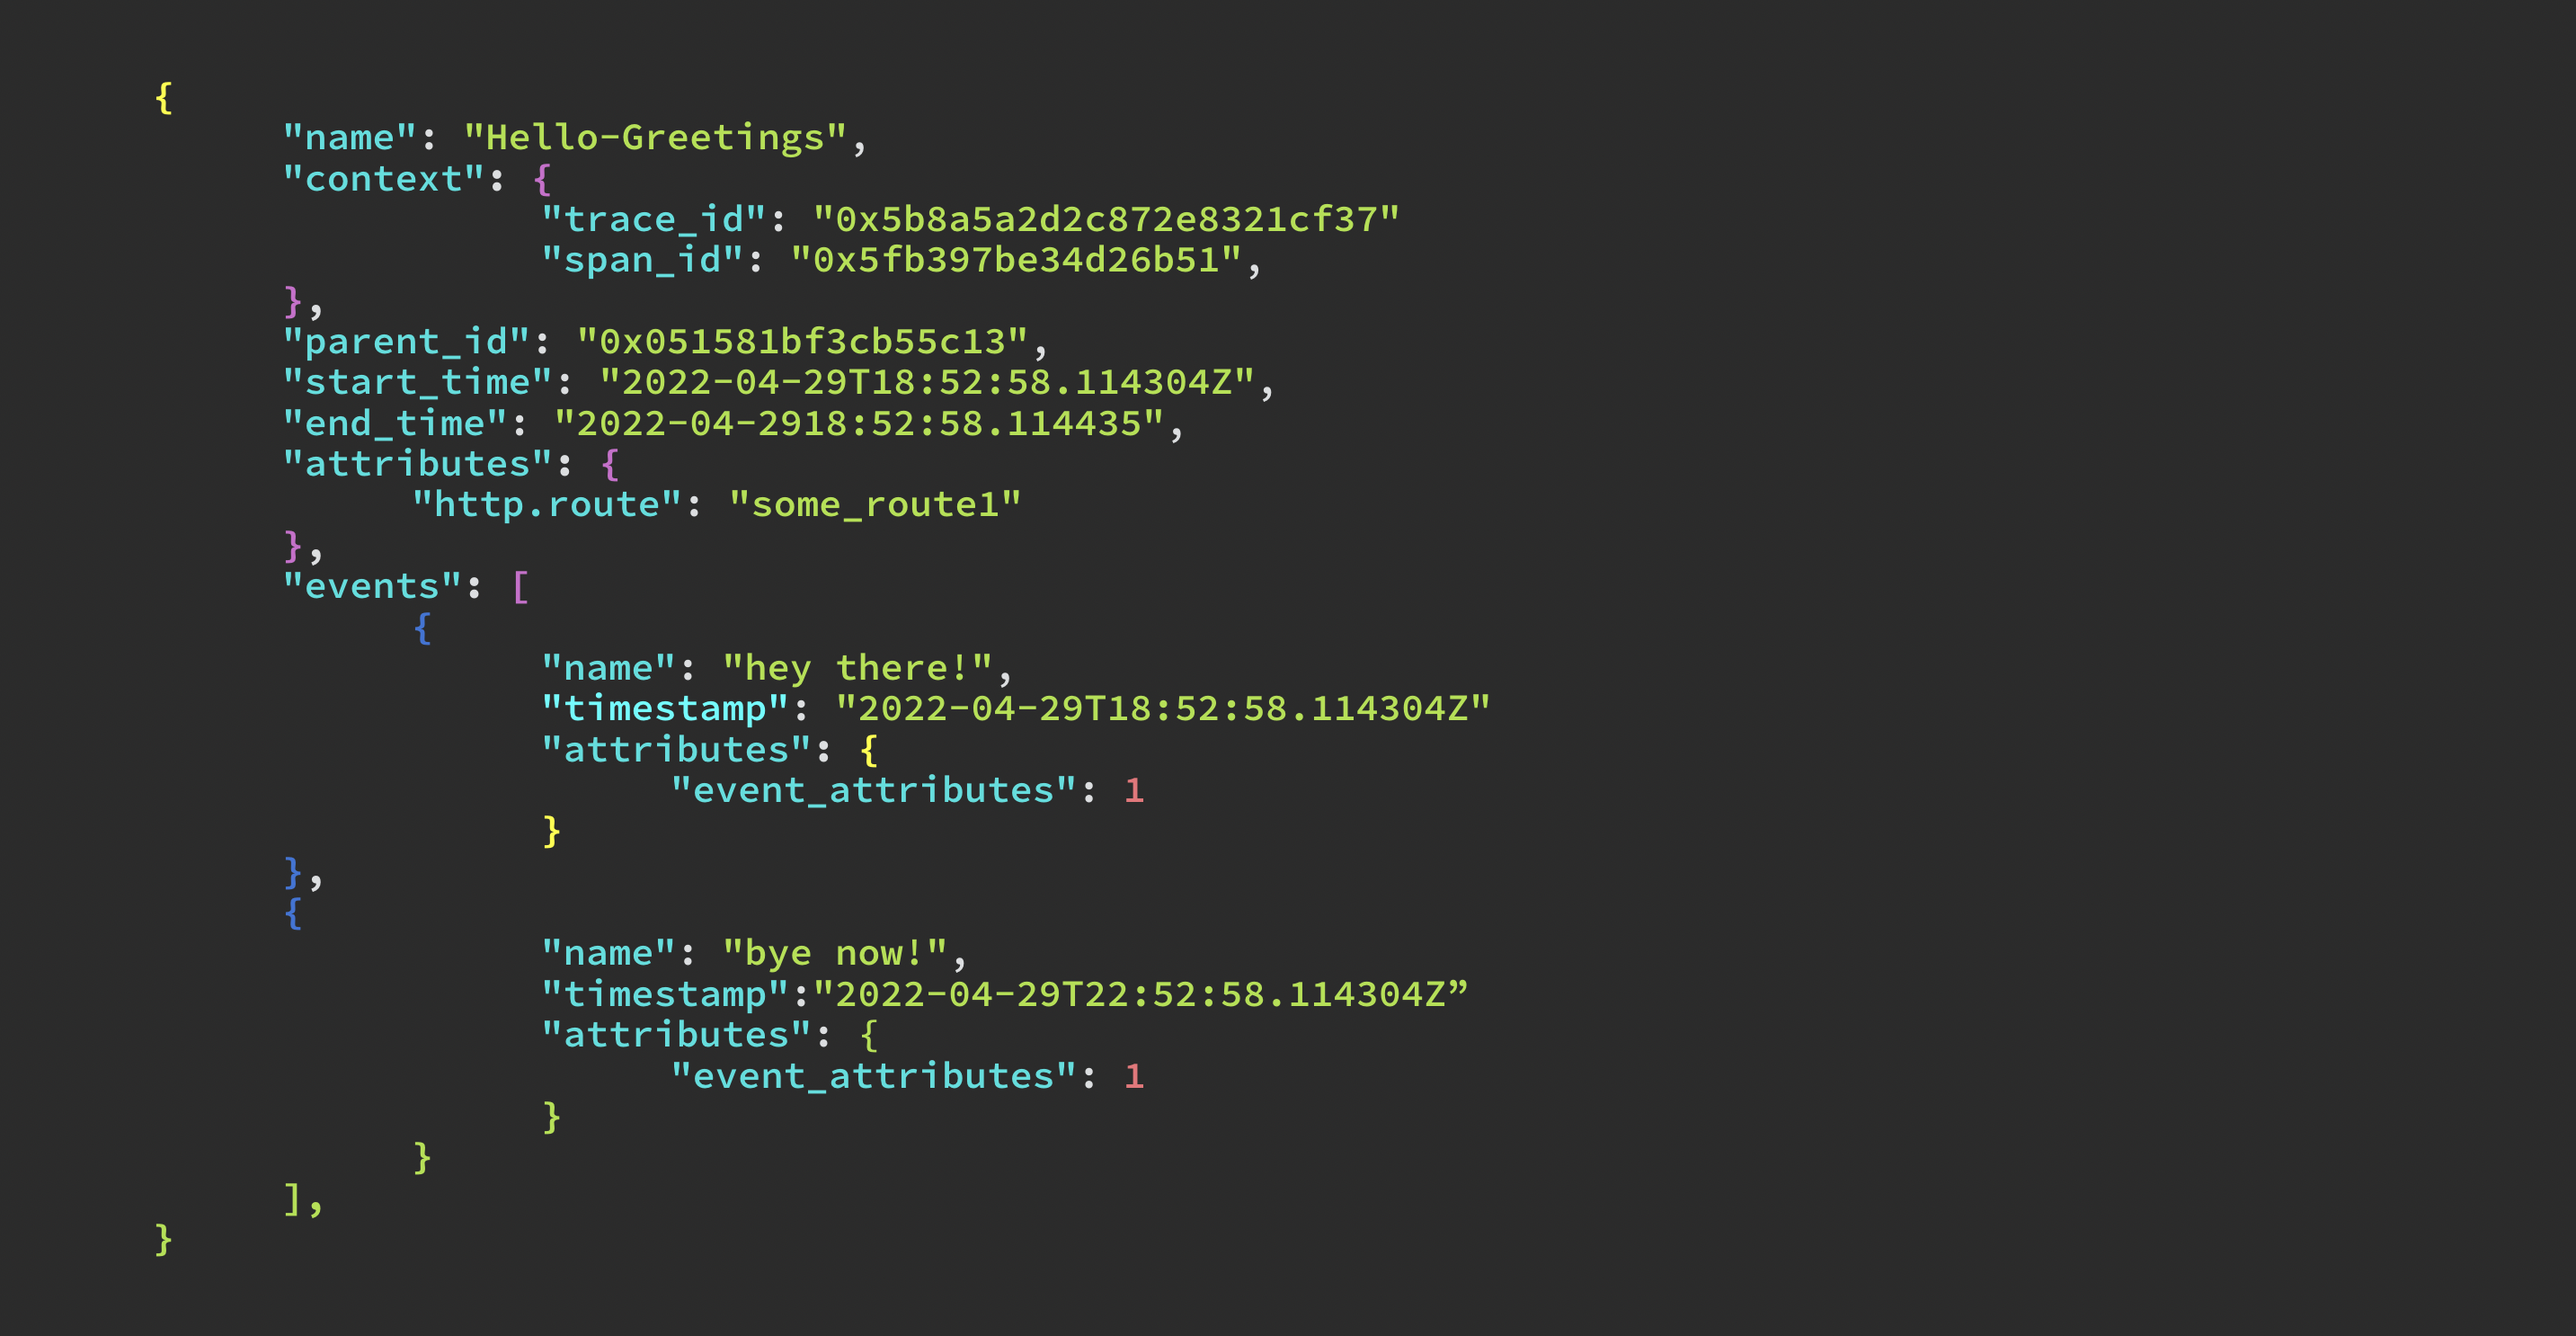
A span is the building block of a trace and is a named, timed operation representing a piece of the workflow in the distributed system. All traces are composed of Spans.
Traces
Traces: A Trace records the paths taken by requests (made by an application or end-user) as they propagate through multi-service architectures, like microservice and serverless applications. It is also known as Distributed Trace. A trace is almost always an assessment of end-to-end performance.
Without tracing, it is challenging to pinpoint the cause of performance problems in a distributed system.
Suppose you realize we broke into the three pillars of Observability when introducing the concept of Span. In that case, however, the three pillars and Span conform to what is known as Telemetry Data, which are simple signals emitted from applications and resources about their internal state.
The core concept of Context Propagation
When we want to correlate events across our services' boundaries, we look for a context that helps us identify the current trace and Span. But context is not the only thing we need; we also need propagation.
If you are with us following the article carefully, you will realize that in the definition of trace, we talk about the word ‘propagation'. You might wonder what this means.
Propagation is how context is bundled and transferred in and across services, often via HTTP headers. Now, With these clear concepts, we can begin to understand the concept of Context Propagation.
A critical functionality required to implement Distributed Tracing is the concept of Context Propagation. We can define it as a mechanism for storing state and accessing data across the lifespan of a distributed transaction, either across execution contexts inside a process or across the boundaries of the services that conform to our system.
- For In Process propagation, we typically use something like the
AsyncLocalStorageclass from the async_hooks module.
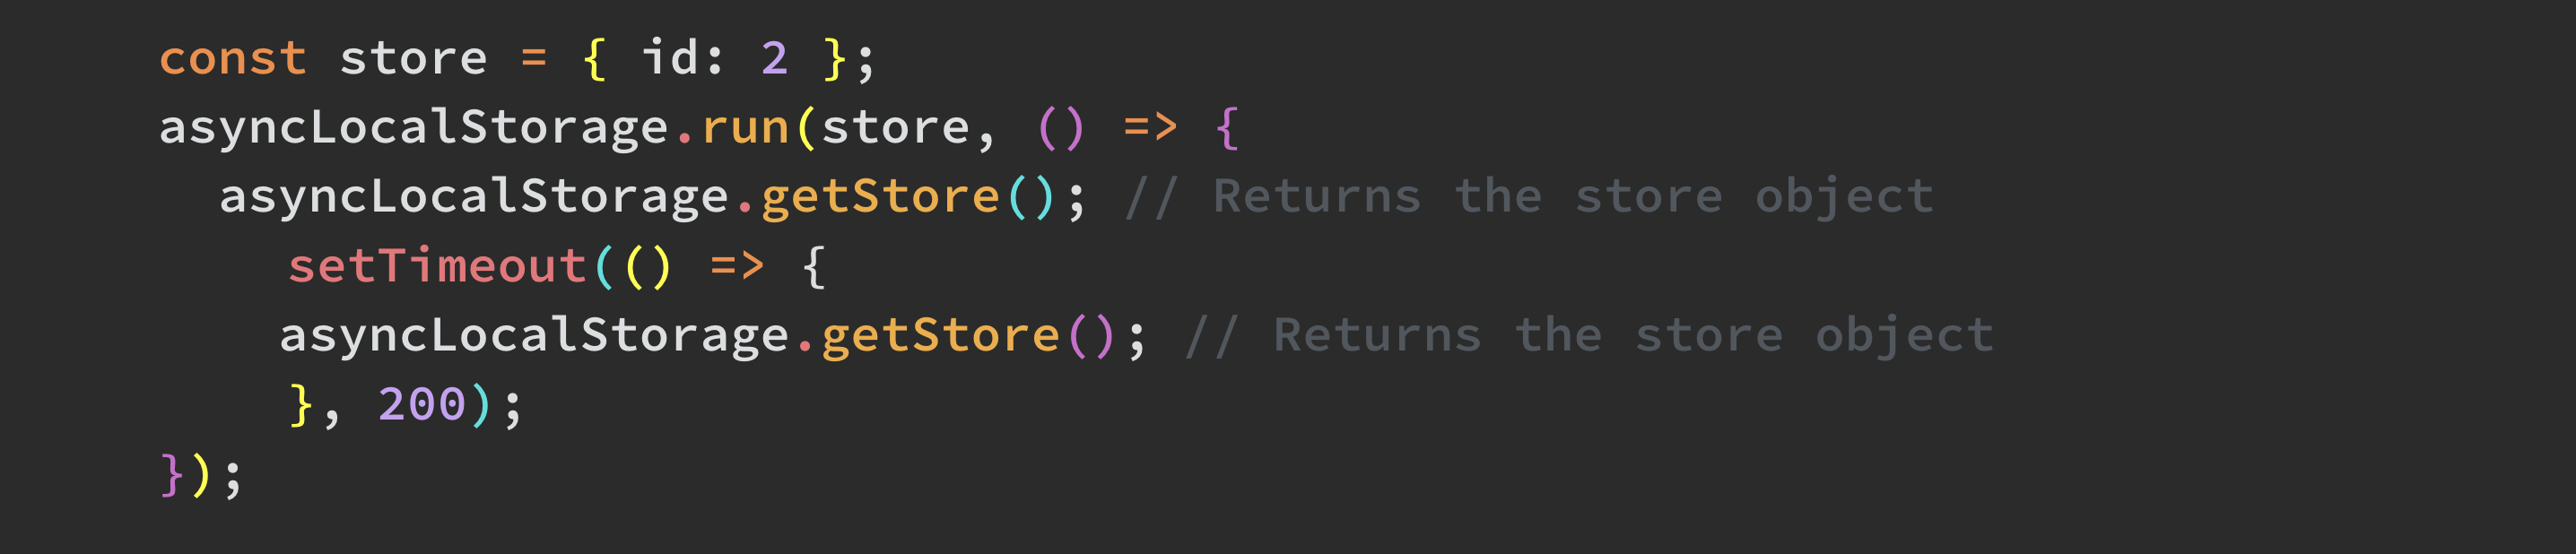
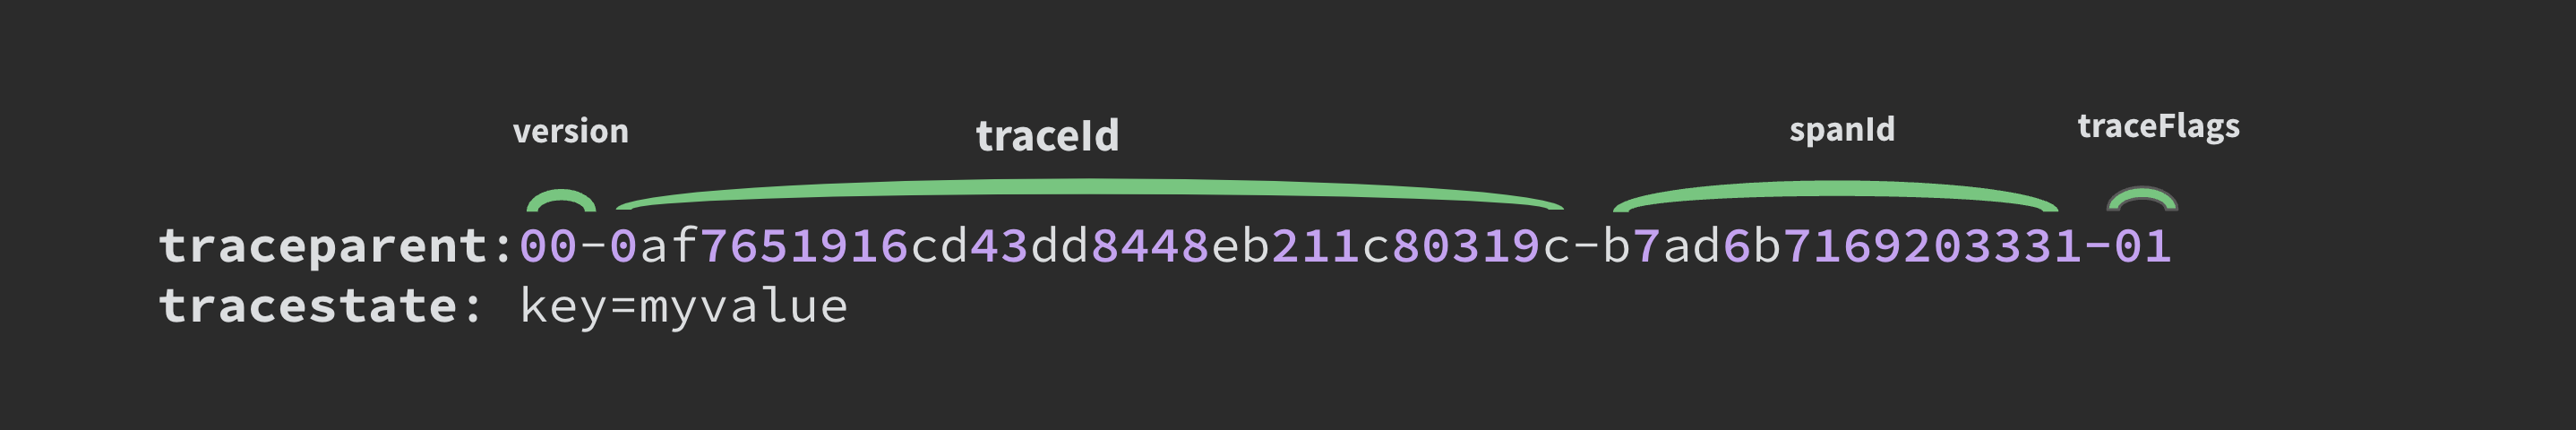
- Whereas Across Processes, it will depend on the IPC protocol used. For example, for HTTP, there's the Trace Context specification from the W3C, which defines the traceparent and tracestate headers to propagate tracing info.
Getting into a Distributed Application
Let’s say we have a distributed application like the one in the picture. It has 4 Nodejs services: API, auth, Service1 and Service2, and 1 database.
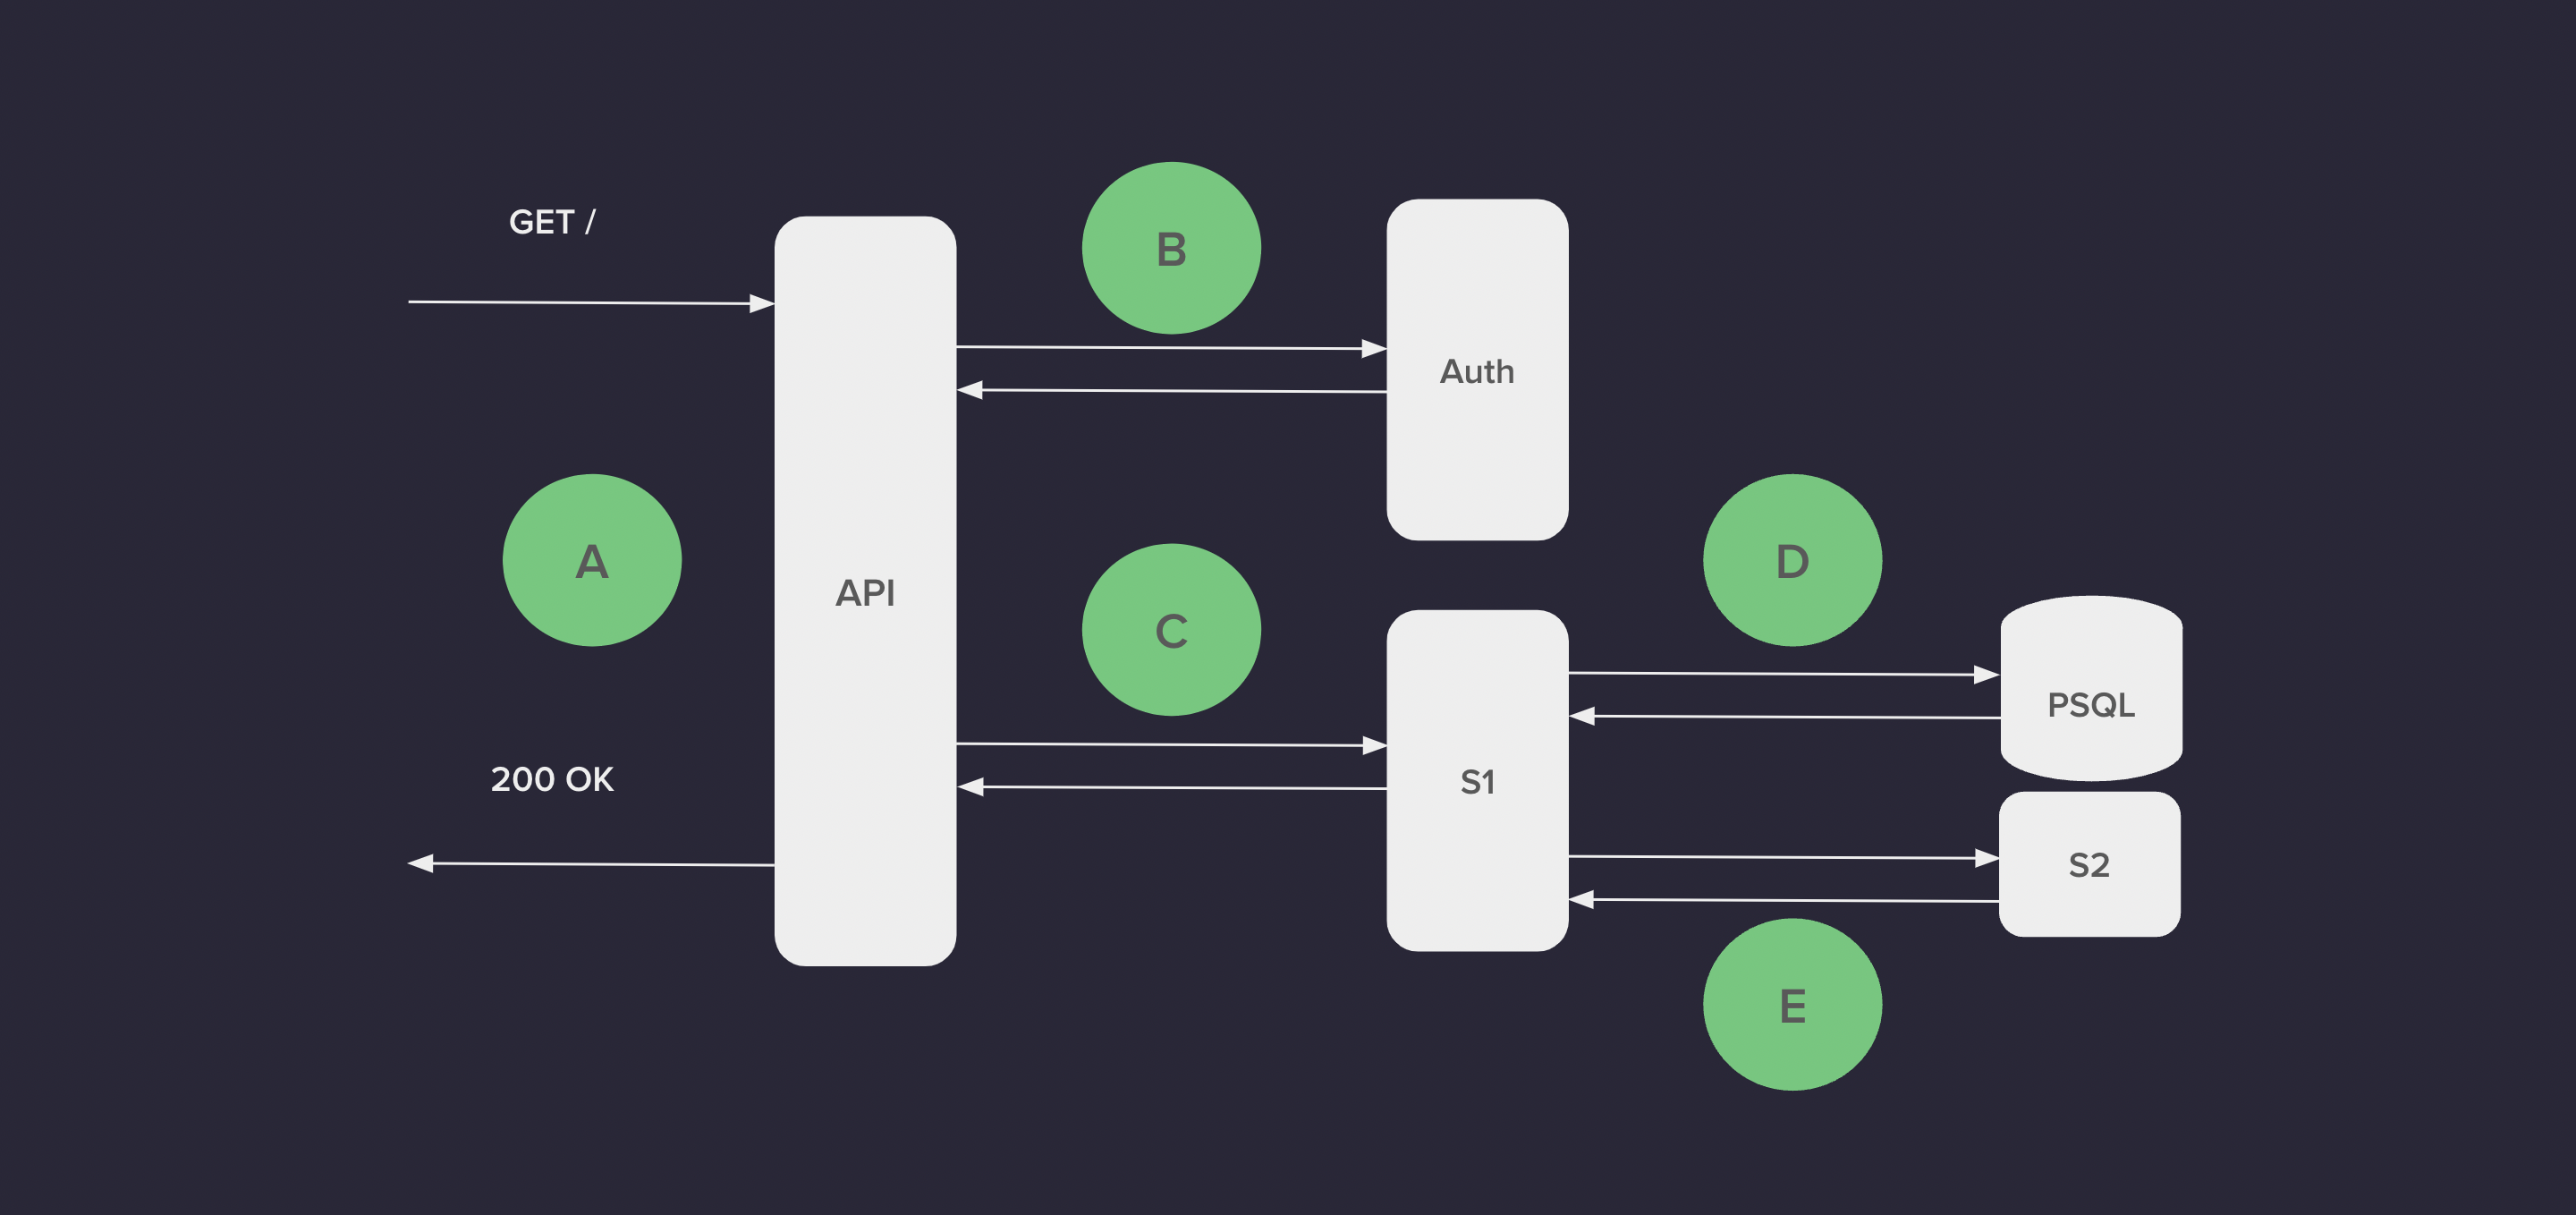
Imagine we’re having intermittent performance issues. They could come from several points:
- Database access
- Network link status,
- DNS request latency, etc. Finding where exactly may become a very hard and time-consuming task; the harder, the more complex the system is.
Distributed tracing will help us A LOT with that, as we’ll generate tracing information on every point of the distributed system (A, B, C, D, and E). Not only that, but while the request goes through all the services, thanks to Context Propagation, some ‘tracing state’ will be passed along so all the tracing info can be linked to the very same request.
Instrument your system
To get visibility into the performance and behaviors of the different microservices, we need to instrument the code with OpenTelemetry to generate traces. But first, let’s define what Instrumentation is...
Automatic Instrumentation
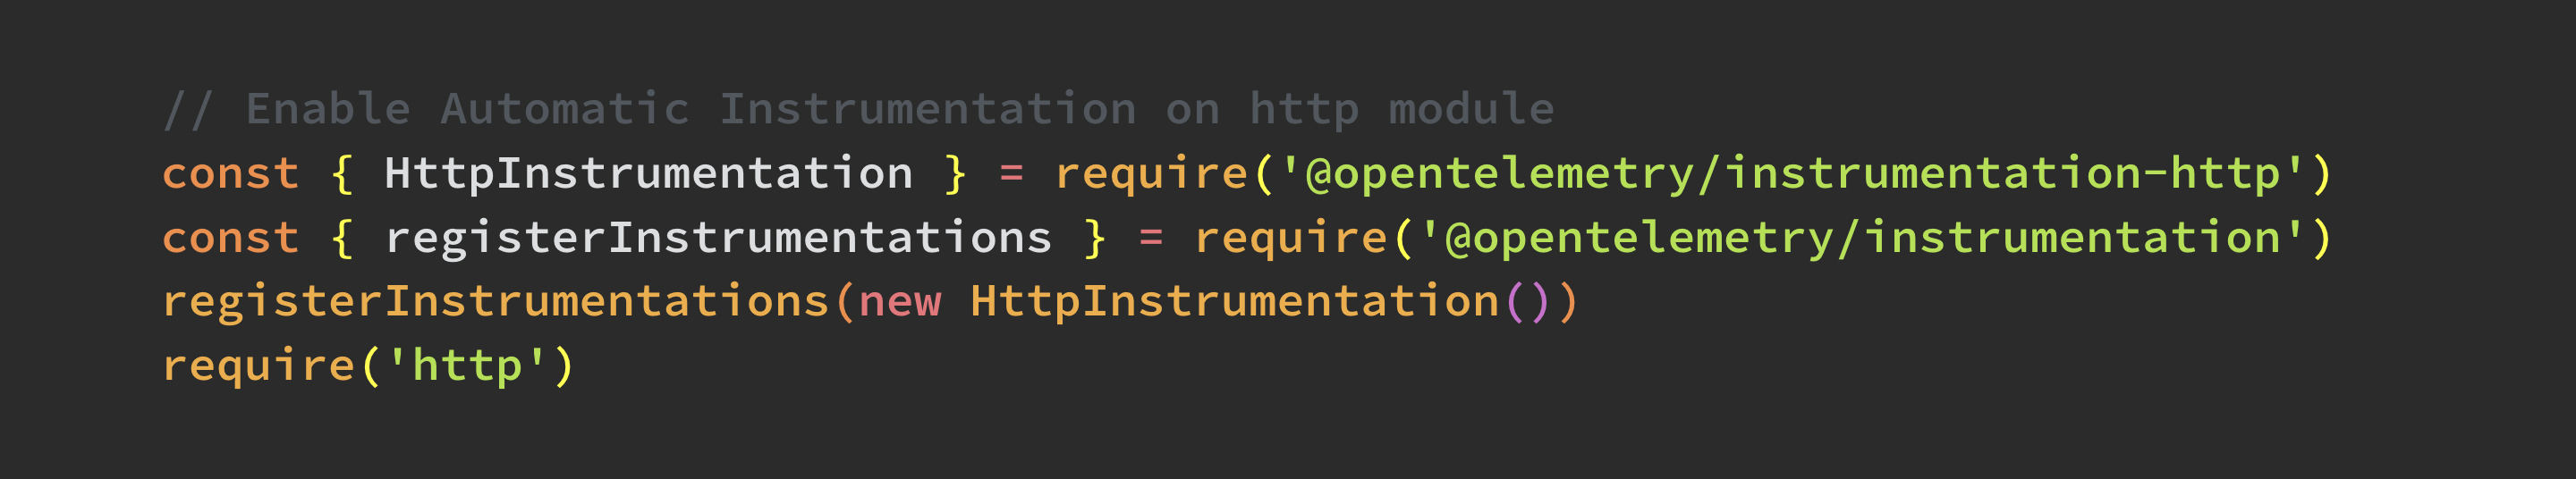
With Automatic Instrumentation, our instrumentation libraries will automatically take the configuration provided (through code or environment variables) and do most of the work.
In the following example, using the OpenTelemetry SDK, we show how we can automatically generate spans for every HTTP transaction handled by the Nodejs HTTP core module.
Manual Instrumentation
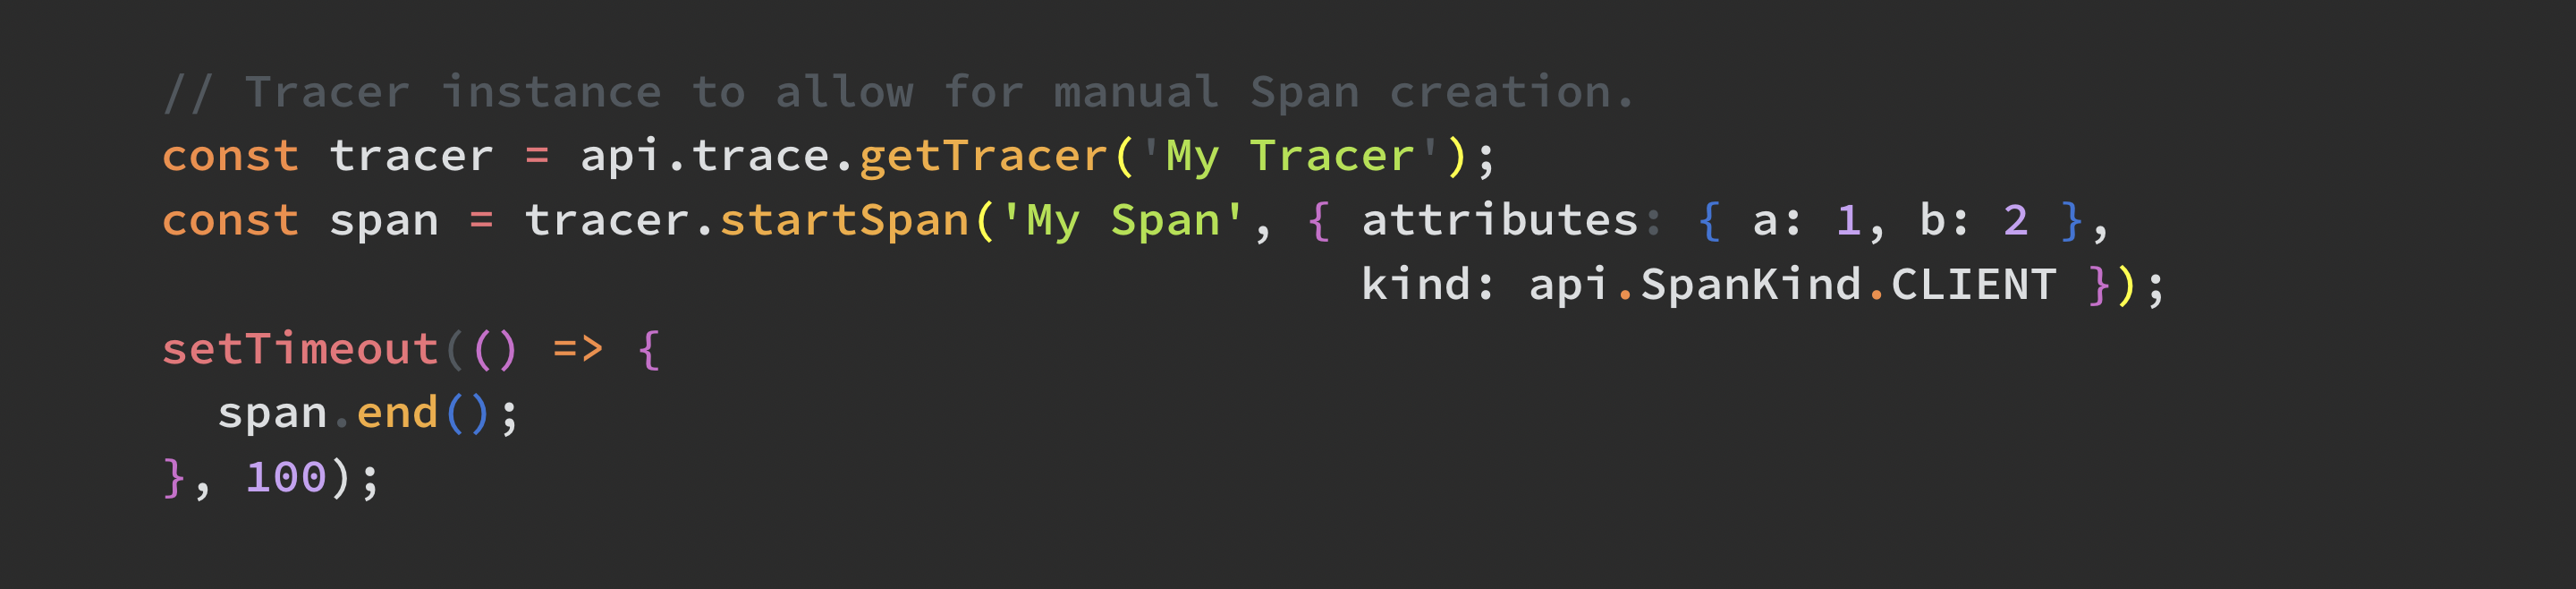
Manual instrumentation, on the other hand, while requiring more work on the user/developer side, enables far more options for customization, from naming various components within OpenTelemetry (for example, spans and the traces ) to add your own attributes, specific exception handling, and more. See the following example shows how to manually generate a Span using the OpenTelemetry SDK.
How to Implement Opentelemetry in my project?
The way we historically would implement a typical observability pipeline is shown in the following picture.
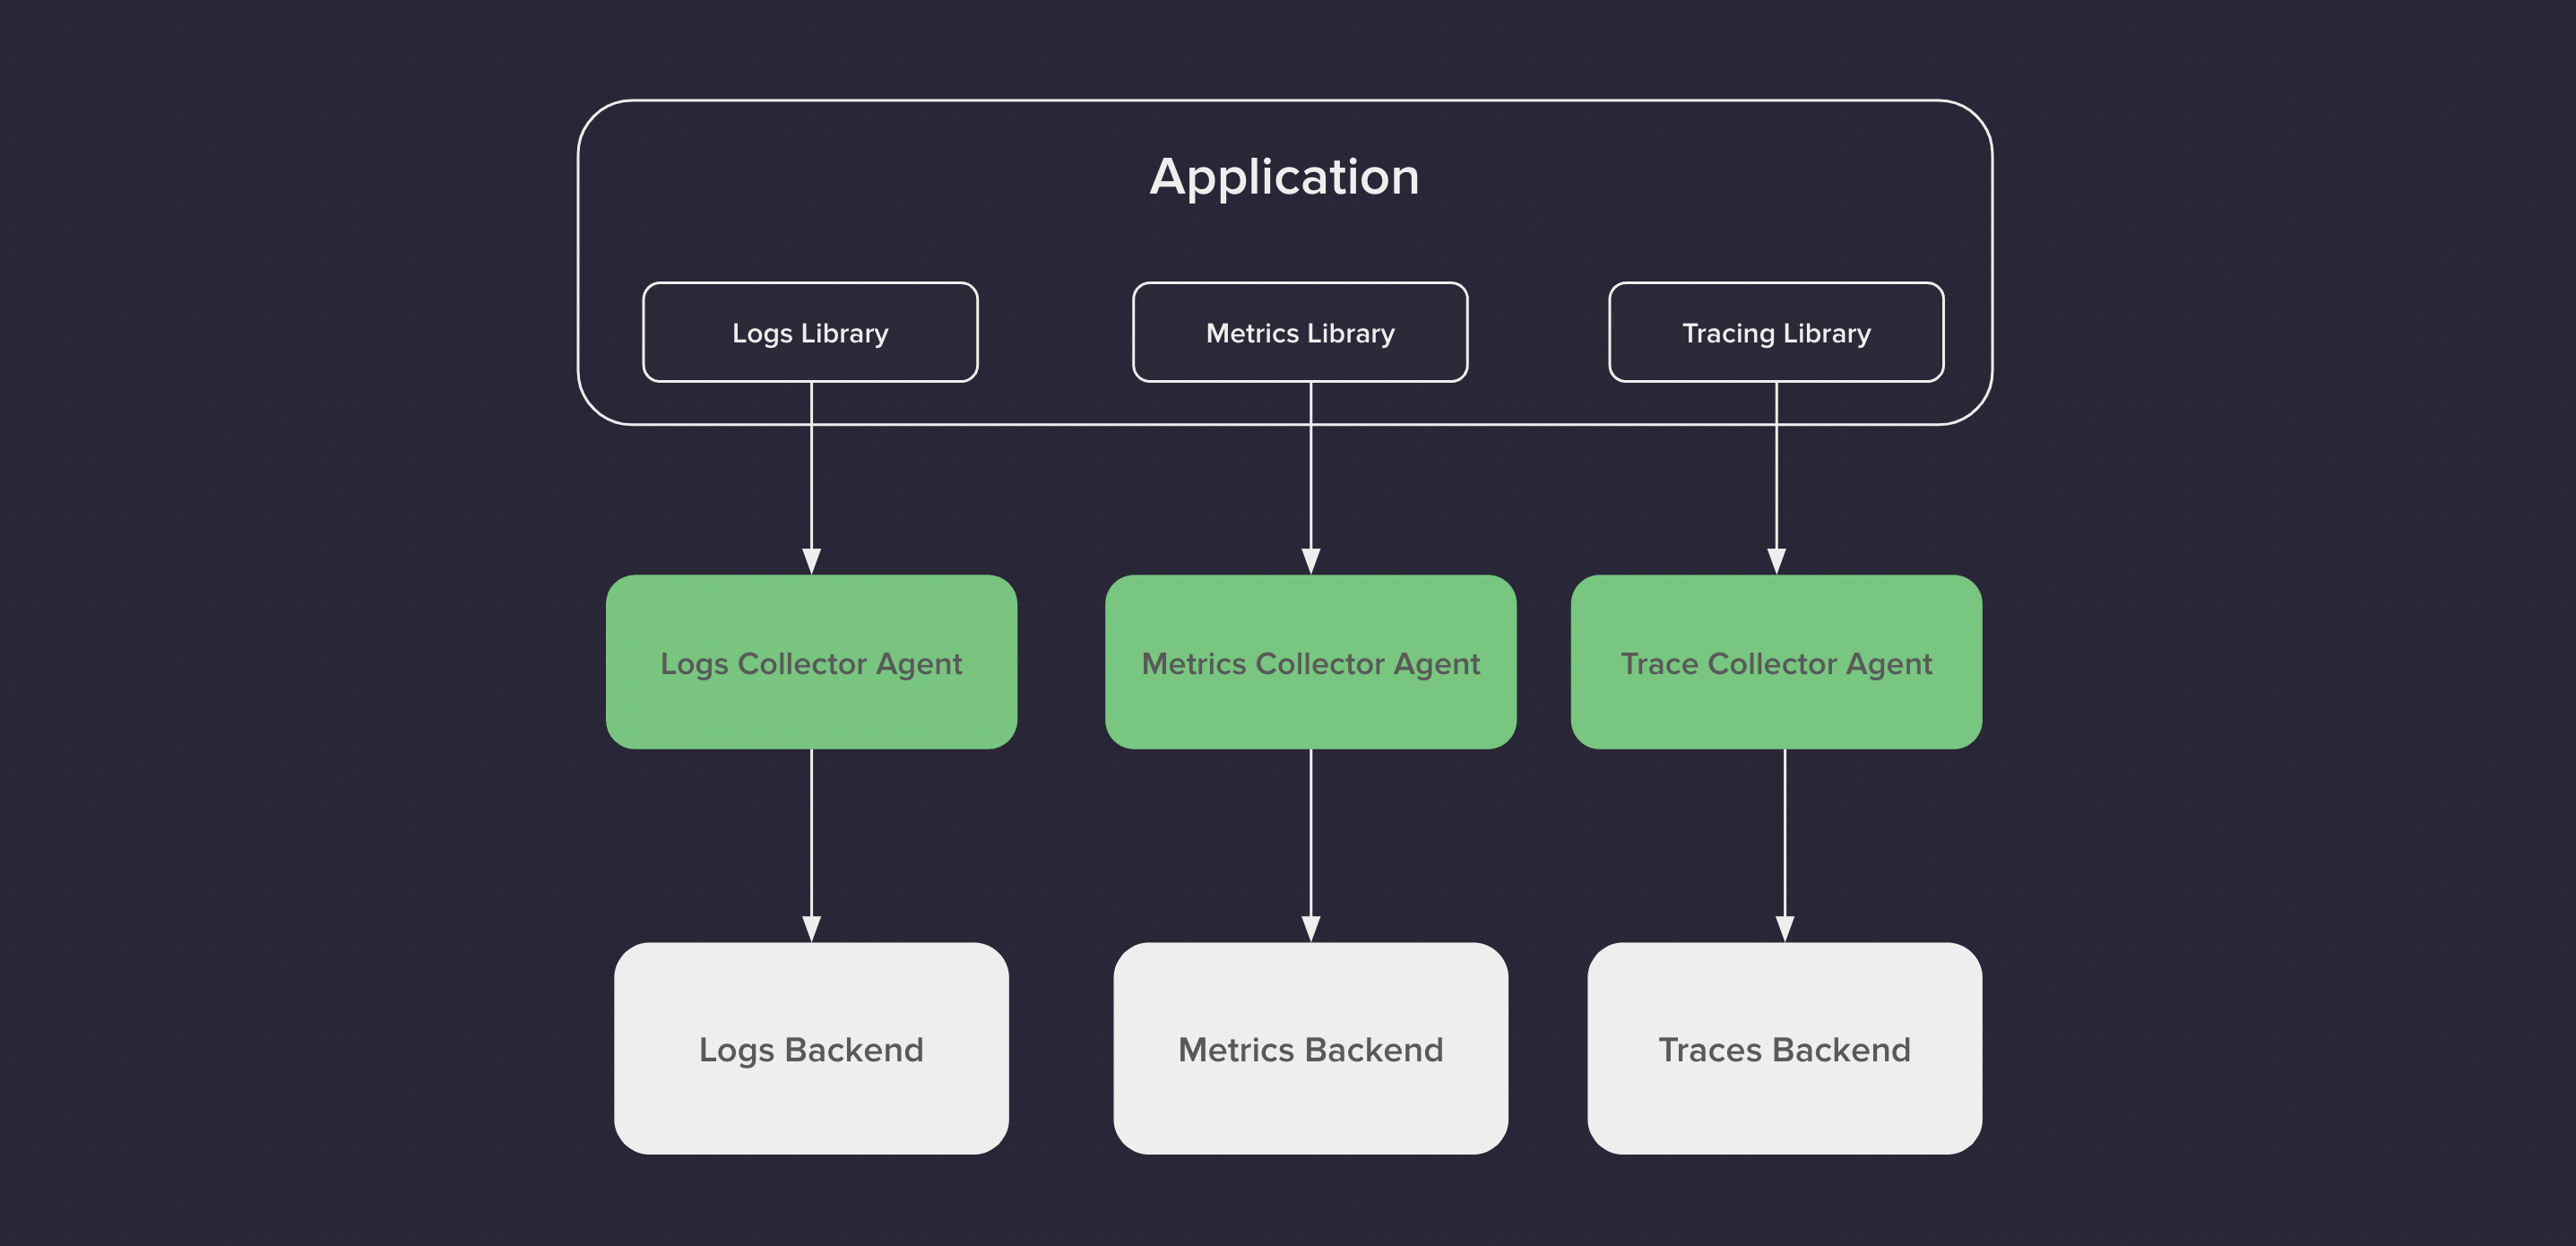
In this case, having all that data at your disposal is great and can give us a valuable overview of our system, but unless we are able to correlate the observability signals somehow: metrics, logs, and traces, we won’t be able to have the best of it. OpenTelemetry comes to solve this problem. The solution is going to come from correlating these signals. This can be done by applying the same concept of Context Propagation that was used for Traces to Metrics and Logs, so in this case, identifiers such as the trace_id and the span_id are associated with those signals.
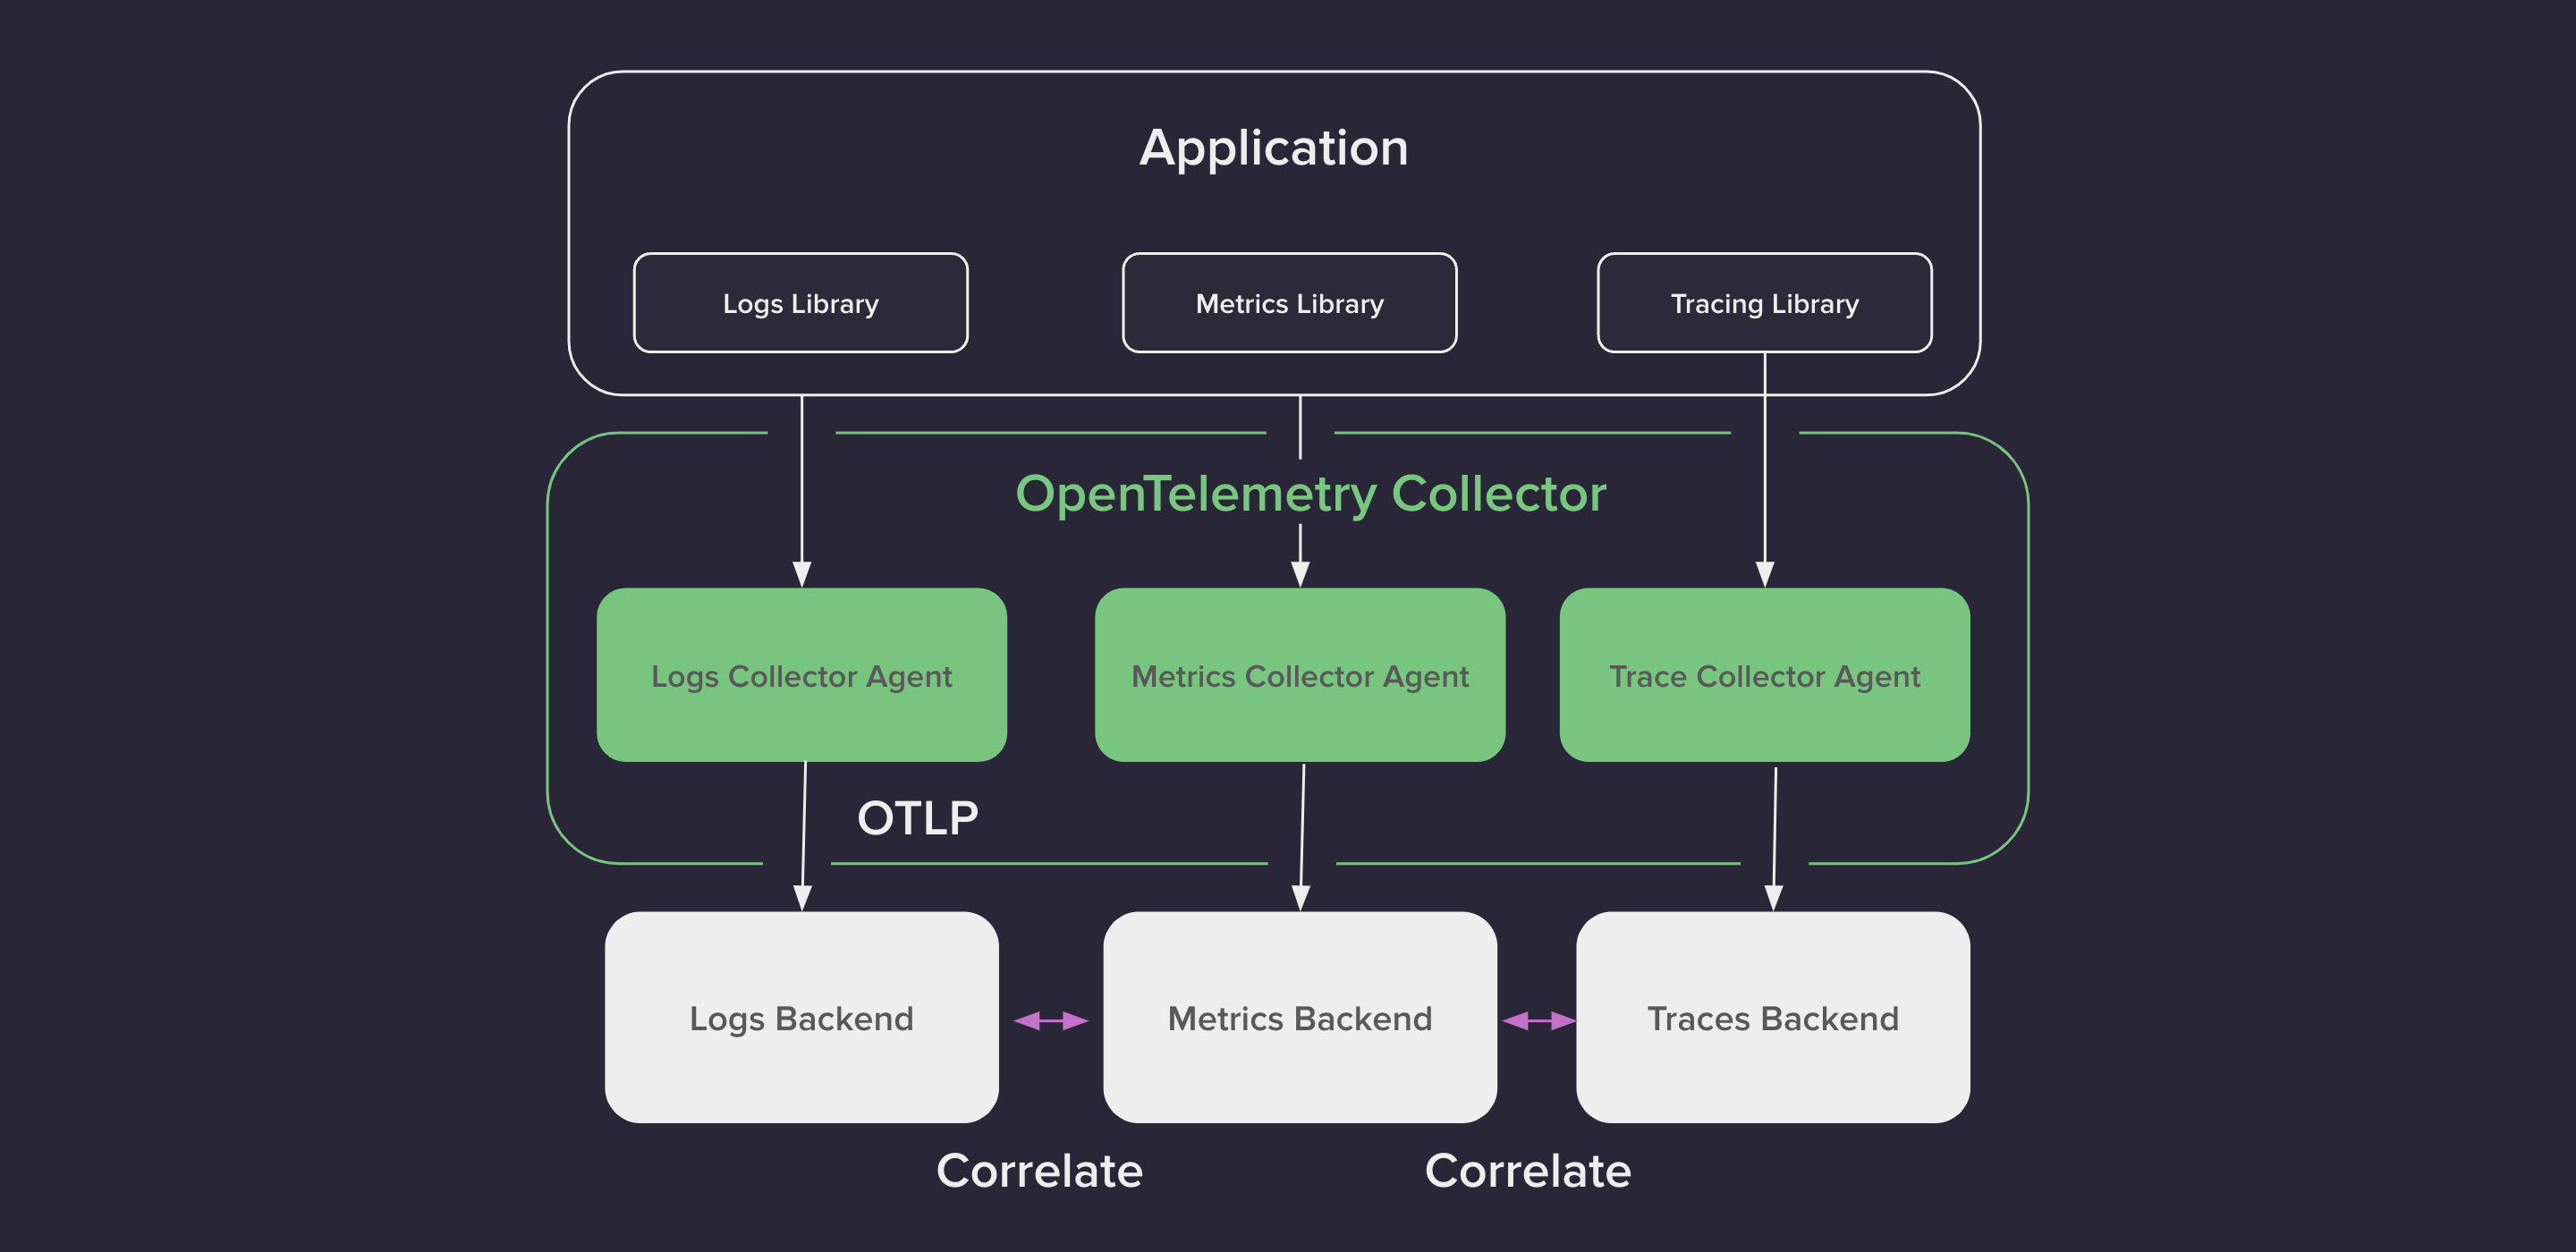
OpenTelemetry spanId and traceId can correlate Logs and Metrics with a specific Span in a Trace.
Opentelemetry Components
OpenTelemetry is much more… Before finishing this article, it is important to describe the different components of OpenTelemetry.
Note: For more detail, read the specification overview of the Opentelemetry project.
- OpenTelemetry API: It provides an API, which defines data types and operations for generating and correlating tracing, metrics, and logging data.
💚 From N|Solid 4.8.0 we provide an implementation of the OpenTelemetry TraceAPI, allowing users to instrument their own code using the de-facto standard API.
-
OpenTelemetry SDK: It provides Language-specific implementations of the API.
-
OpenTelemetry OTLP: A protocol to transport the Telemetry Data.
💚 With N|Solid 4.8.0 we support many instrumentation modules available in the OpenTelemetry ecosystem. Supporting exporting traces using the OpenTelemetry Protocol(OTLP) over HTTP.
- OpenTelemetry Collector: To receive, process, and export Telemetry data.
💚 In N|Solid 4.8.0 is now possible to send N|Solid Runtime monitoring information (metrics and traces) to backends supporting the OpenTelemetry standard like multiple APMS (Dynatrace, Datadog, Newrelic).
- OpenTelemetry Semantic Conventions: To have well-defined naming for the attributes associated with the signals: (service.name, http. port, etc.)
We know that there may be other key concepts to develop around Opentelemetry, and for this reason, we invite you to visit the direct website of the project or the Github Repo directly.
This introductory article gives us the basis for sharing a demo we prepared for NodeConf.EU, where we apply open-source tools to implement Opentelemetry in your project. We invite you to stay tuned for our next blog post. 😉 Wait for the second part!
Conclusions
- Traces are really useful for understanding modern distributed systems.
- We build better software when we get the best of our traces.
- With OTel (Opentelemetry), we’re able to have maximized insights and answer future questions without having to make any code changes.
- #OTel provides interoperability with observability tools.
- Collect and correlate telemetry data is easy if you follow the OpenTelemetry framework.
- As far as we know, the OpenTelemetry community is working hard to develop support for metrics and logs. Waiting for news soon! 🤞 Note: If you want to learn more about OpenTelemetry in Javascript, click HERE
To start getting more value out of your traces and metrics, you can use Opentelemetry with N|Solid back-end.
Achieve Your Performance Goals With N|Solid
We know that you want to get the best out of your application and to do it professionally, you will surely need a great ally to help you with various tools without affecting your performance. We do not want to stay in a ‘marketing speech’ where we tell you that we are the best… you can 👀check it directly here with this Open Source tool that also includes OTEL Results.
We’d love to hear more from you! 💚 – Feel free to TRY N|Solid and get in touch with us on Twitter at @nodesource.