Measuring latency from the client side using Chrome DevTools and N|Solid
Almost every modern web browser includes a powerful suite of developer tools. In our previous blog-post we covered How to Measure Node.js server response time with N|Solid, read more 👉 HERE.
The developer tools have a lot of capabilities, from inspecting the current HTML-CSS and Javascript code to inspecting the current ongoing network communication client-server.
To open the devtools and analyze the network, you can go to:
“More Tools” > “Developer Tools” > “Network”
Being on the devtools screen now, you can visit your Fastify API(or express) http://localhost:3000 after you get an HTTP response, you will see the request itself, the HTTP status code, the response size, and the response time.

An explanation for the time measured by the Chrome DevTools, HERE.
Let's measure the Client-Side Latency.
Remove the delay timer logic on your application and restart the Node.js process.
import Fastify from "fastify";

const fastify = Fastify({
 logger: true,
});

// Declare the root route and delay the response randomly
fastify.get("/", async function (request, reply) {
 return { delayTime: 0 };
});

// Run the server!
fastify.listen({ port: 3000 }, function (err, address) {
 if (err) {
   fastify.log.error(err);
   process.exit(1);
 }
});
NOTE: Discover another useful code snippet in our 'Measure Node.js server response time with N|Solid' article! This time, learn how to simulate server-side latency to further test your application's performance. Check it out: 👉 HERE
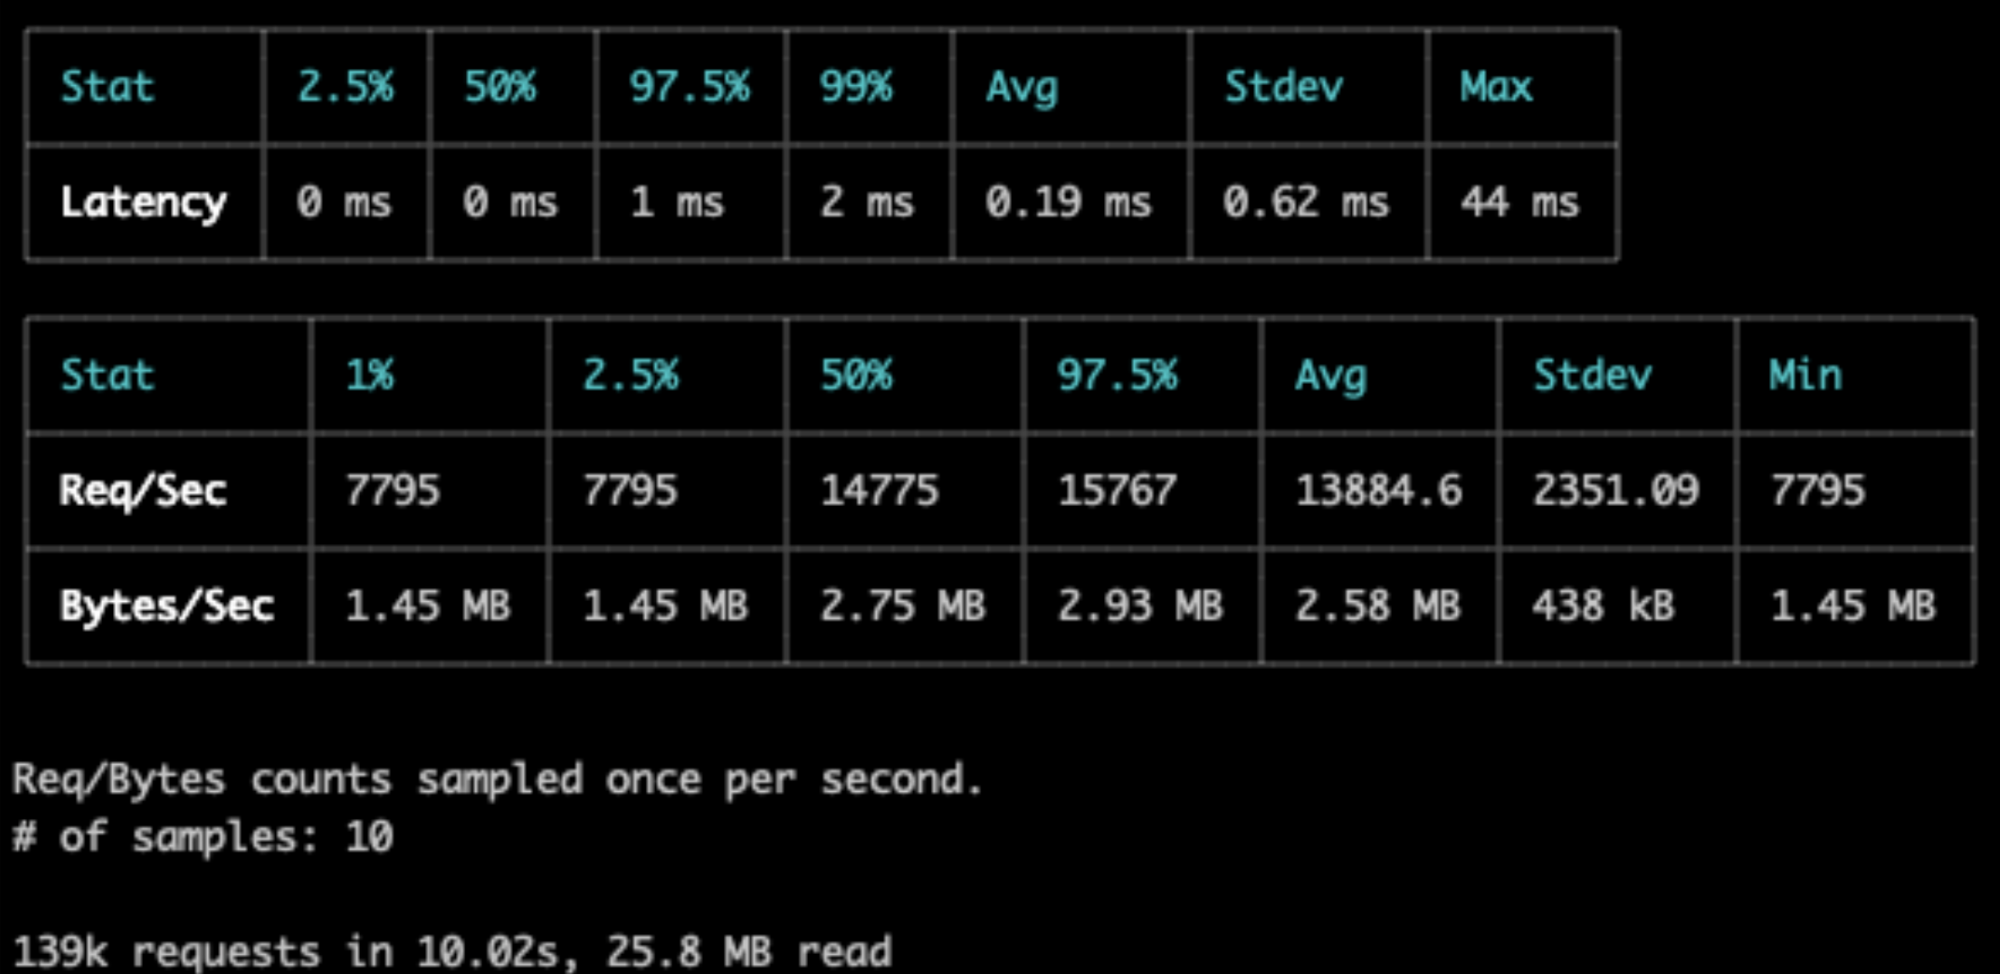
After this, you will get the fastest response times of ~1 ms, I was able to execute 139k requests in 10 secs using autocannon.
npx autocannon localhost:3000
The main point here is to see how it behaves when we have a poor internet connection on the client side and the best possible performance on the server side; for this, we can simulate high latency and slow internet connections on the client side, using Chrome devtools which has this option out of the box.
Simulate Client-Side latency
In the Chrome Devtools:
Go to the "Network Conditions" option > Select the option “Network Throttling” > Set it to “Slow 3G”.
If you request your browser to the URL http://localhost:3000/, you’ll see a long response time, in our case, ~2 seconds.
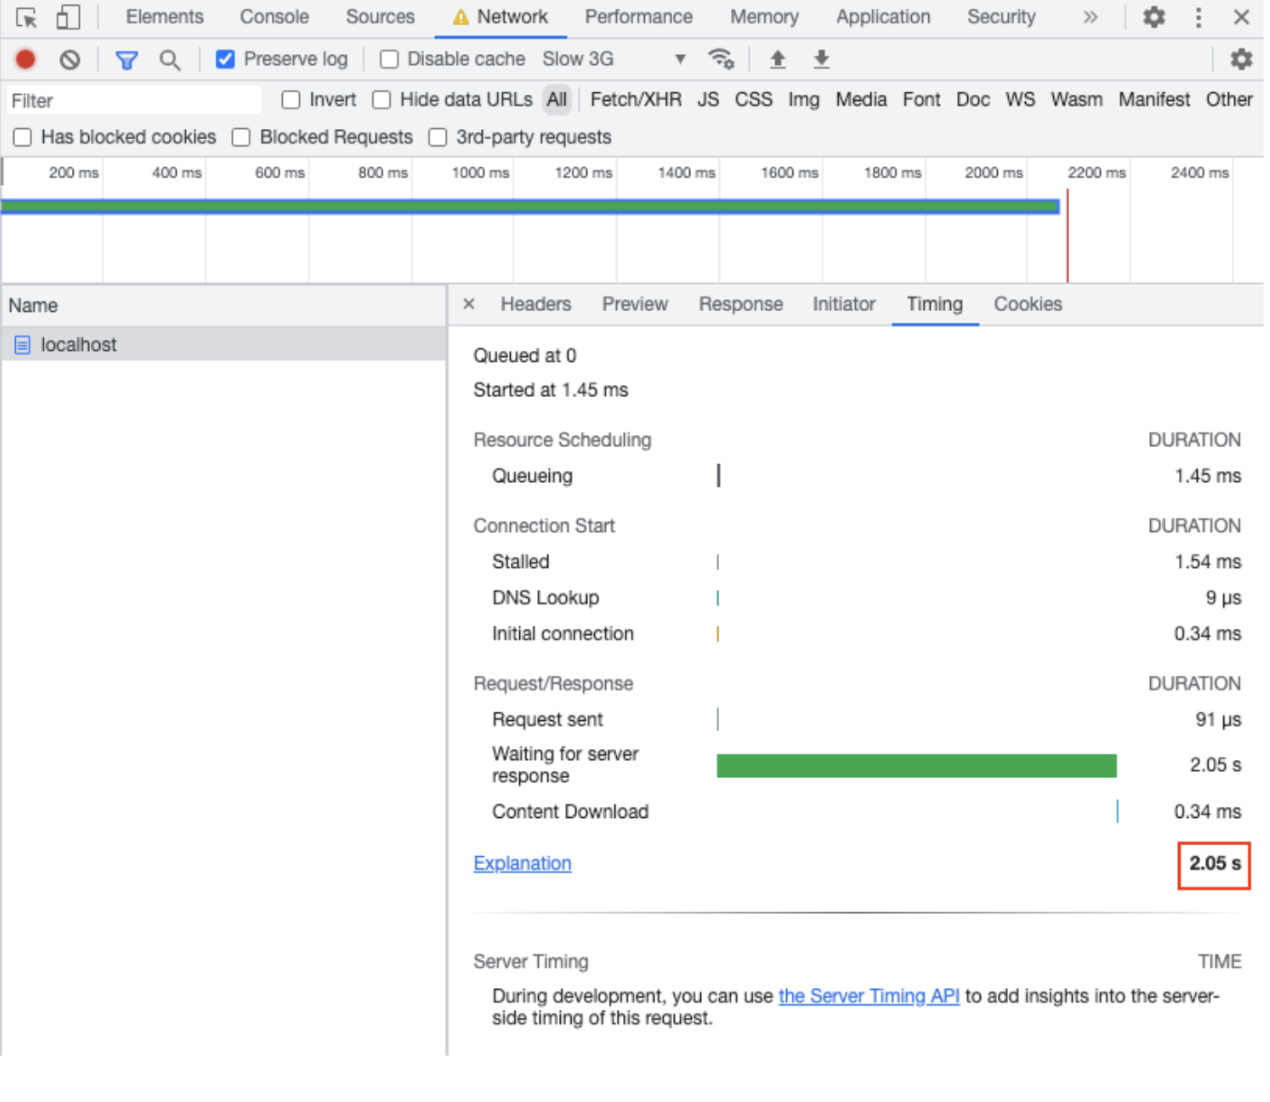
This response time doesn’t mean the server takes that long to process the request and return an answer that was the amount of time that the answer took to transfer over the network till it arrived at the client side.
If you check your Fastify logs of the N|Solid metrics, you’ll see the server only took ~1 ms to return.
In our case, the response time was 0.3 ms
"responseTime":0.3490520715713501
Can I improve/help the client-side latency?
Well, it is possible to improve the user experience on client-side devices with high latency when you use a Content Delivery Network to cache content on edge locations geographically near to users' devices; even implementing some simple compression mechanism will improve the load times on users' devices with high latency.
Look at this Jonas, our Principal OSS Engineer, blog-post and see 👀👉 How to create a fast SSR application.
Connect with NodeSource
If you have any questions, please contact us at info@nodesource.com or through this form.
To get the best out of Node.js and experience the benefits of its integrated features, including OpenTelemetry support, SBOM integration, and machine learning capabilities. Sign up for a free trial and see how N|Solid can help you achieve your development and operations goals. #KnowyourNode