The Friction with Today’s Debugging Strategies
Why debugging in modern systems still feels harder than it should
Debugging has always been part of the craft.
But in today’s systems — distributed, asynchronous, and increasingly opaque — debugging is no longer just difficult.
It’s fragmented.
Despite better tooling, more telemetry, and the rise of AI-assisted workflows, many developers still experience the same core frustrations when trying to understand what’s actually happening in production.
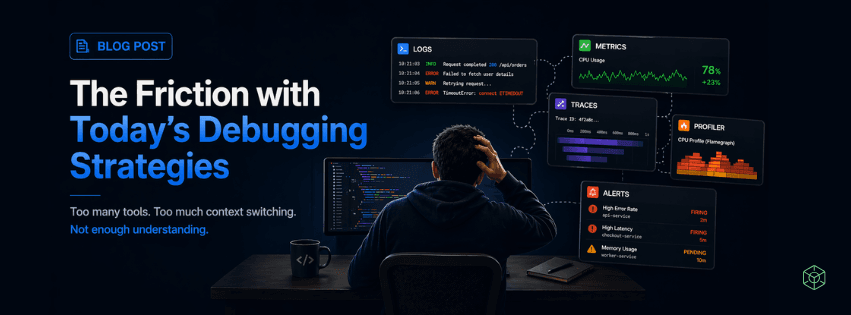
1. Context is fragmented across tools
One of the biggest issues today is not lack of data — it’s lack of connected context.
A typical debugging workflow looks like this:
- Logs
- Metrics
- Traces
- Profilers
Each of these lives in a different tool.
You’re constantly switching between dashboards, trying to reconstruct what happened.
👉 You can read more about how observability signals are defined in OpenTelemetry
The problem isn’t visibility.
It’s disconnected visibility.
2. Observability is system-centric, not developer-centric
Most observability platforms were designed for system health, not for understanding code behavior.
They answer:
- Is the system up?
- Are there errors?
- What’s the latency?
But developers need:
- Which function caused this?
- What changed in the execution path?
👉 A clear breakdown of this gap: New Relic
There’s a missing layer between system signals and code understanding.
3. Asynchronous systems are inherently harder to reason about
Node.js is built around asynchronous execution.
That’s what makes it scalable — but also harder to debug.
You’re dealing with:
- Lost execution context across async boundaries
- Non-linear call stacks
- Timing-related issues
- Event loop behavior under load
👉 If you want to revisit how the event loop actually works: Node.js Event Loop Docs
At this level, debugging is not just about code.
It’s about understanding time and scheduling.
4. Production debugging is still reactive
Most debugging workflows start after something breaks:
- An alert fires
- Logs are inspected
- A hypothesis is formed
This is inherently reactive.
👉 This model is well described in: Google SRE Book
The challenge:
You often don’t have the right data when you need it.
So you add more logs… after the incident.
5. Reproducing issues locally is often impossible
Modern systems rely on:
- Distributed services
- External APIs
- Real traffic patterns
Reproducing a production issue locally becomes unreliable.
👉 This is a well-known challenge in distributed architectures: Martin Fowler – Microservice Testing
You’re not debugging reality.
You’re debugging a simulation.
6. Debugging requires too much manual correlation
To understand a single issue, developers often need to connect:
- Logs
- Trace IDs
- Metrics
- Code paths
Even with modern tracing, correlation is still largely manual.
You’re stitching together the story yourself.
And that takes time.
7. Tooling adds visibility — but not understanding
We have more telemetry than ever:
- High-cardinality metrics
- Distributed traces
- Continuous profiling
But more data doesn’t automatically mean more clarity.
👉 A strong perspective on this difference: Honeycomb – Observability vs Monitoring
Most tools tell you:
- What happened
But not:
- Why it happened
And debugging is fundamentally about why.
8. The mental model mismatch
Developers think in terms of:
- Functions
- Flows
- Business logic
Systems expose:
- Metrics
- Spans
- Events
This forces a translation:
“CPU spike in service A”
→ “Which function caused this?”
That translation layer is pure friction.
So why does this still happen?
Because debugging strategies evolved from:
- Infrastructure monitoring
- Logging pipelines
- Incident response workflows
—not from how developers actually reason about code.
What’s changing
We’re starting to see a shift toward:
Continuous profiling
Always-on visibility into runtime behavior
Code-level observability
Mapping telemetry directly to functions
Runtime-aware debugging
Bringing deeper insight from the runtime itself, not just external signals
AI-assisted debugging
Helping correlate signals and suggest root causes
👉 Many of these trends are built on top of OpenTelemetry
But more importantly, they’re starting to reshape where debugging happens.
Instead of jumping between dashboards and tools,
the direction is moving toward bringing runtime insight closer to the code itself.
For example, platforms like N|Solid expose deep runtime telemetry — such as event loop behavior, CPU profiling, and memory insights — directly from the Node.js runtime, without requiring intrusive instrumentation or code changes.
That shift matters.
Because it doesn’t just give developers more data —
it reduces the distance between code and understanding.
Final thought
Debugging today isn’t slow because developers lack skill.
It’s slow because:
- Context is fragmented
- Systems are complex
- Tools are disconnected from code
The next evolution of debugging won’t be about more data.
It will be about:
- Better context
- Better correlation
- Bringing understanding closer to where code actually runs