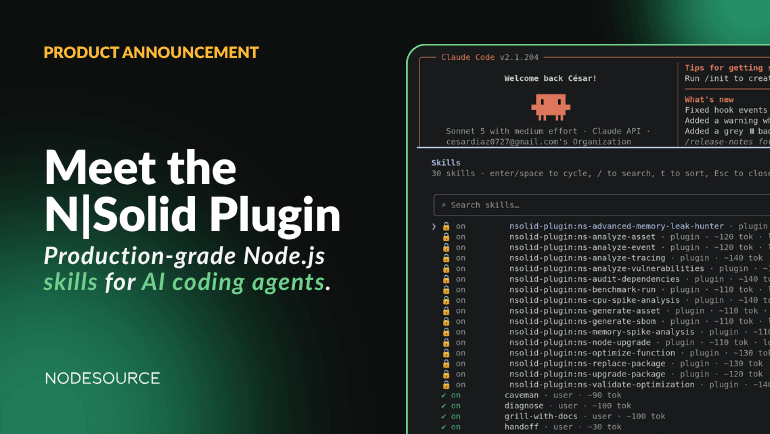
Understanding Flame Graphs in Node.js (and How AI Makes Them Easier with N|Solid)
Flame graphs are one of the most powerful tools for understanding performance bottlenecks, but they can also be one of the hardest to read.
With a range of observability and APM tools available, choosing the right one for your stack and team can be challenging but it can save you hours
N|Solid 6, the ultimate tool for Node.js observability and diagnostics. Elevate your apps with new features, improved UI, and real-time security insights.
Elevate your Node.js development with N|Solid Copilot—an AI assistant delivering real-time insights, security, and optimization tips.
Explore N|Solid, an innovative Node.js runtime, now open source from NodeSource, enhancing production deployments and observability for enterprise needs.
Discover the true cost of your Node.js apps with NodeSource's new Cost Calculator. Learn how the right APM provider can save money and boost performance.