Debug a Node.js Memory Leak in Minutes with AI-Powered Heap Snapshot Analysis
Memory leaks are among the most frustrating production issues to investigate.
At first, everything looks normal. Requests are processed successfully, users aren't reporting problems, and the application appears healthy. Then memory usage starts climbing. Garbage collection runs more frequently. Performance degrades. Eventually, the process becomes unstable or crashes altogether. Detecting a memory leak isn’t even half the battle.
The challenge is understanding exactly what's retaining memory, where the leak originates, and whether your fix actually solved the problem.
Traditionally, that investigation requires jumping between dashboards, monitoring tools, terminals, heap analysis utilities, and source code.
With N|Solid Extension, developers can perform that entire workflow directly from VS Code, Cursor, Windsurf and Antigravity.
In this article, we'll investigate a real Node.js memory leak, identify the root cause using AI-powered Heap Snapshot analysis, apply a fix, and verify that the issue has been resolved.
The Application
For this demonstration, we created a simple Node.js application containing an intentional memory leak.
The application exposes a /now endpoint:
import http from 'http';

const leak: any[] = [];

function requestListener(req: http.IncomingMessage, res: http.ServerResponse) {
  if (req.url === '/now') {
    const resp = JSON.stringify({ now: new Date() });

    leak.push(JSON.parse(resp));

    res.writeHead(200, { 'Content-Type': 'application/json' });
    res.write(resp);
    res.end();
  }
}
At first glance, the code doesn't seem particularly dangerous.
However, every request creates a new object and stores it inside a module-level array:
leak.push(JSON.parse(resp));
Because the array exists for the lifetime of the process, none of those objects can be garbage collected.
As traffic increases, memory usage continues growing indefinitely.
This is a classic memory leak pattern.
Detecting the Problem
Once the application is connected to N|Solid, we can observe runtime behavior directly from the editor.
Instead of switching to an external dashboard, memory metrics, throughput, and application telemetry are available inside VS Code, Cursor, Windsurf and Antigravity.
After generating traffic against the /now endpoint, memory usage begins increasing steadily.
This is often the first indication that objects are being retained longer than expected.
At this point, we know something is wrong.
The next step is finding out why.
Capturing a Heap Snapshot
To investigate further, we capture a Heap Snapshot directly from N|Solid.
A Heap Snapshot provides a detailed view of the objects currently residing in memory and the references preventing them from being reclaimed.
Traditionally, analyzing Heap Snapshots can be difficult and time-consuming. Large applications often contain tens of thousands of objects, making manual investigation challenging.
Rather than navigating the heap graph ourselves, we can ask N|Solid AI to analyze the snapshot.
Letting AI Investigate the Leak
After the snapshot is captured, N|Solid AI analyzes the memory graph and identifies potential leak patterns.
Within seconds, the analysis highlights a clear problem.
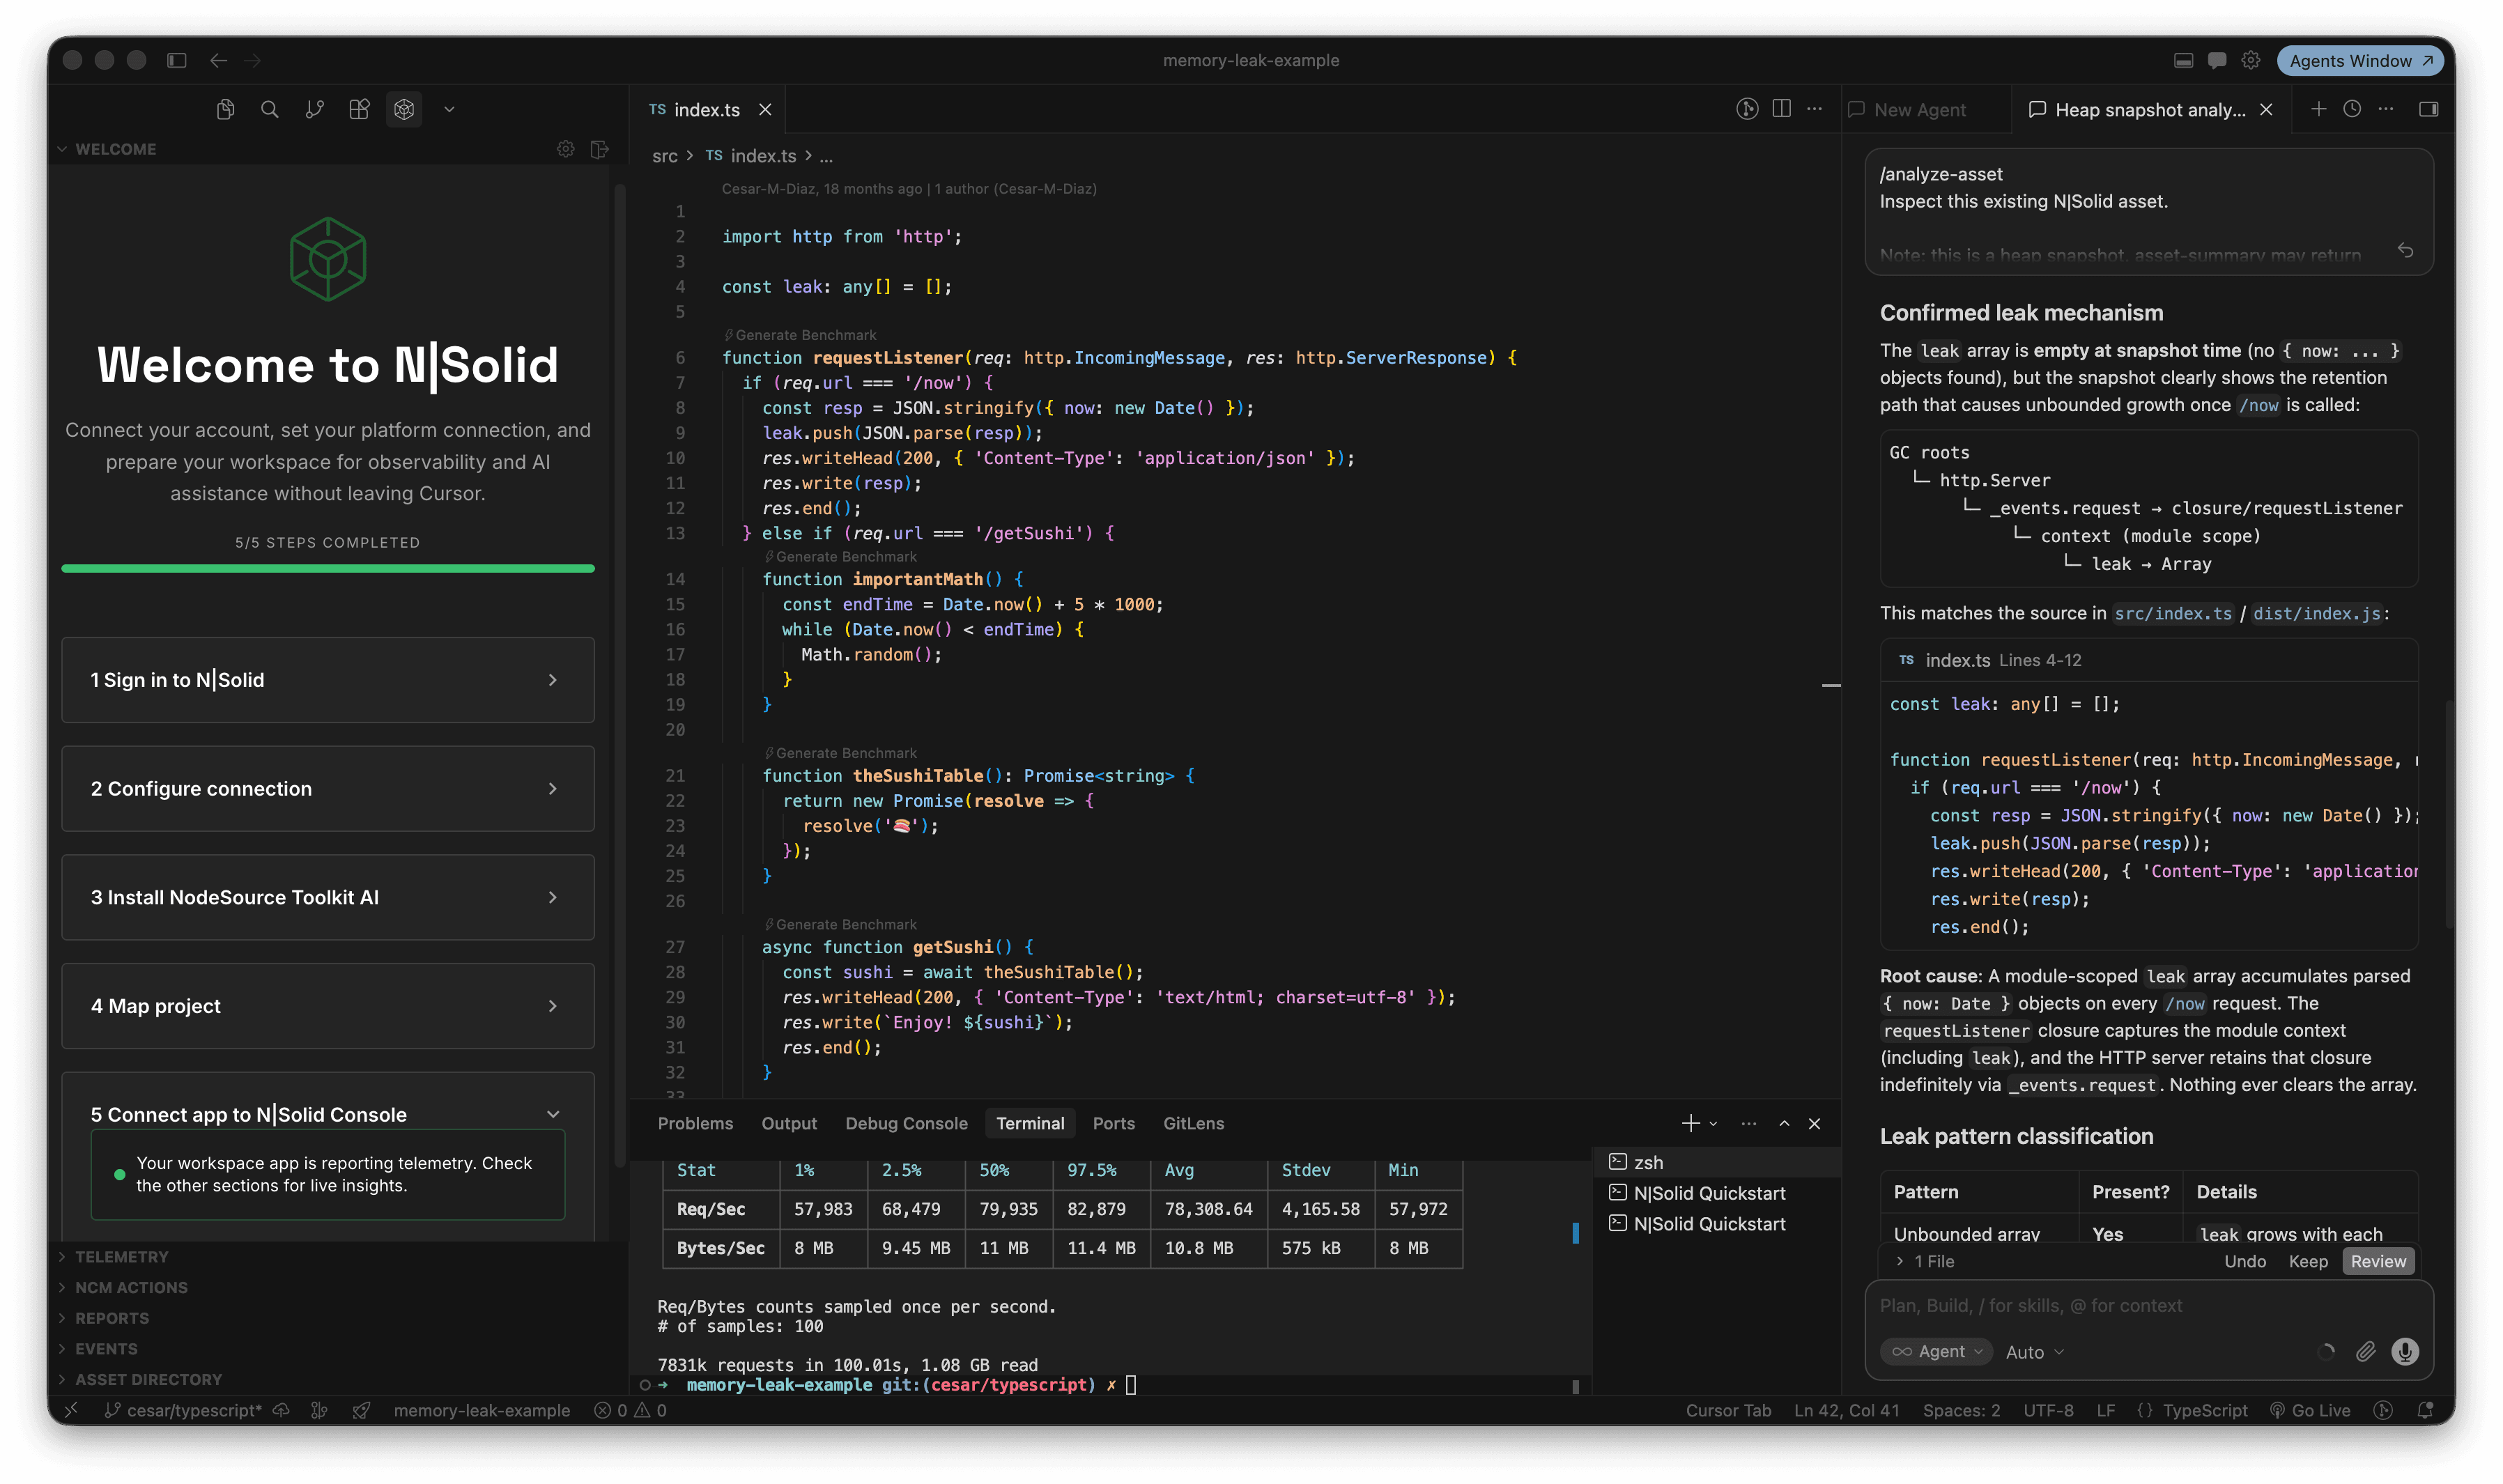
The report identifies a module-level array named:
const leak: any[] = [];
It also reconstructs the retention path responsible for the memory growth:
GC Roots
 └─ http.Server
     └─ requestListener
         └─ module scope
             └─ leak
The analysis explains that objects are continuously accumulating inside the array and remain strongly referenced for the lifetime of the application.
Most importantly, the AI points directly to the line responsible for the leak:
leak.push(JSON.parse(resp));
The report concludes that every request to /now adds another object to the array and nothing ever clears it.
Rather than manually searching through thousands of heap objects, we can immediately focus on the exact code causing the problem.
Applying the Fix
Once the root cause is identified, the fix becomes straightforward.
The AI recommends removing the unnecessary object retention.
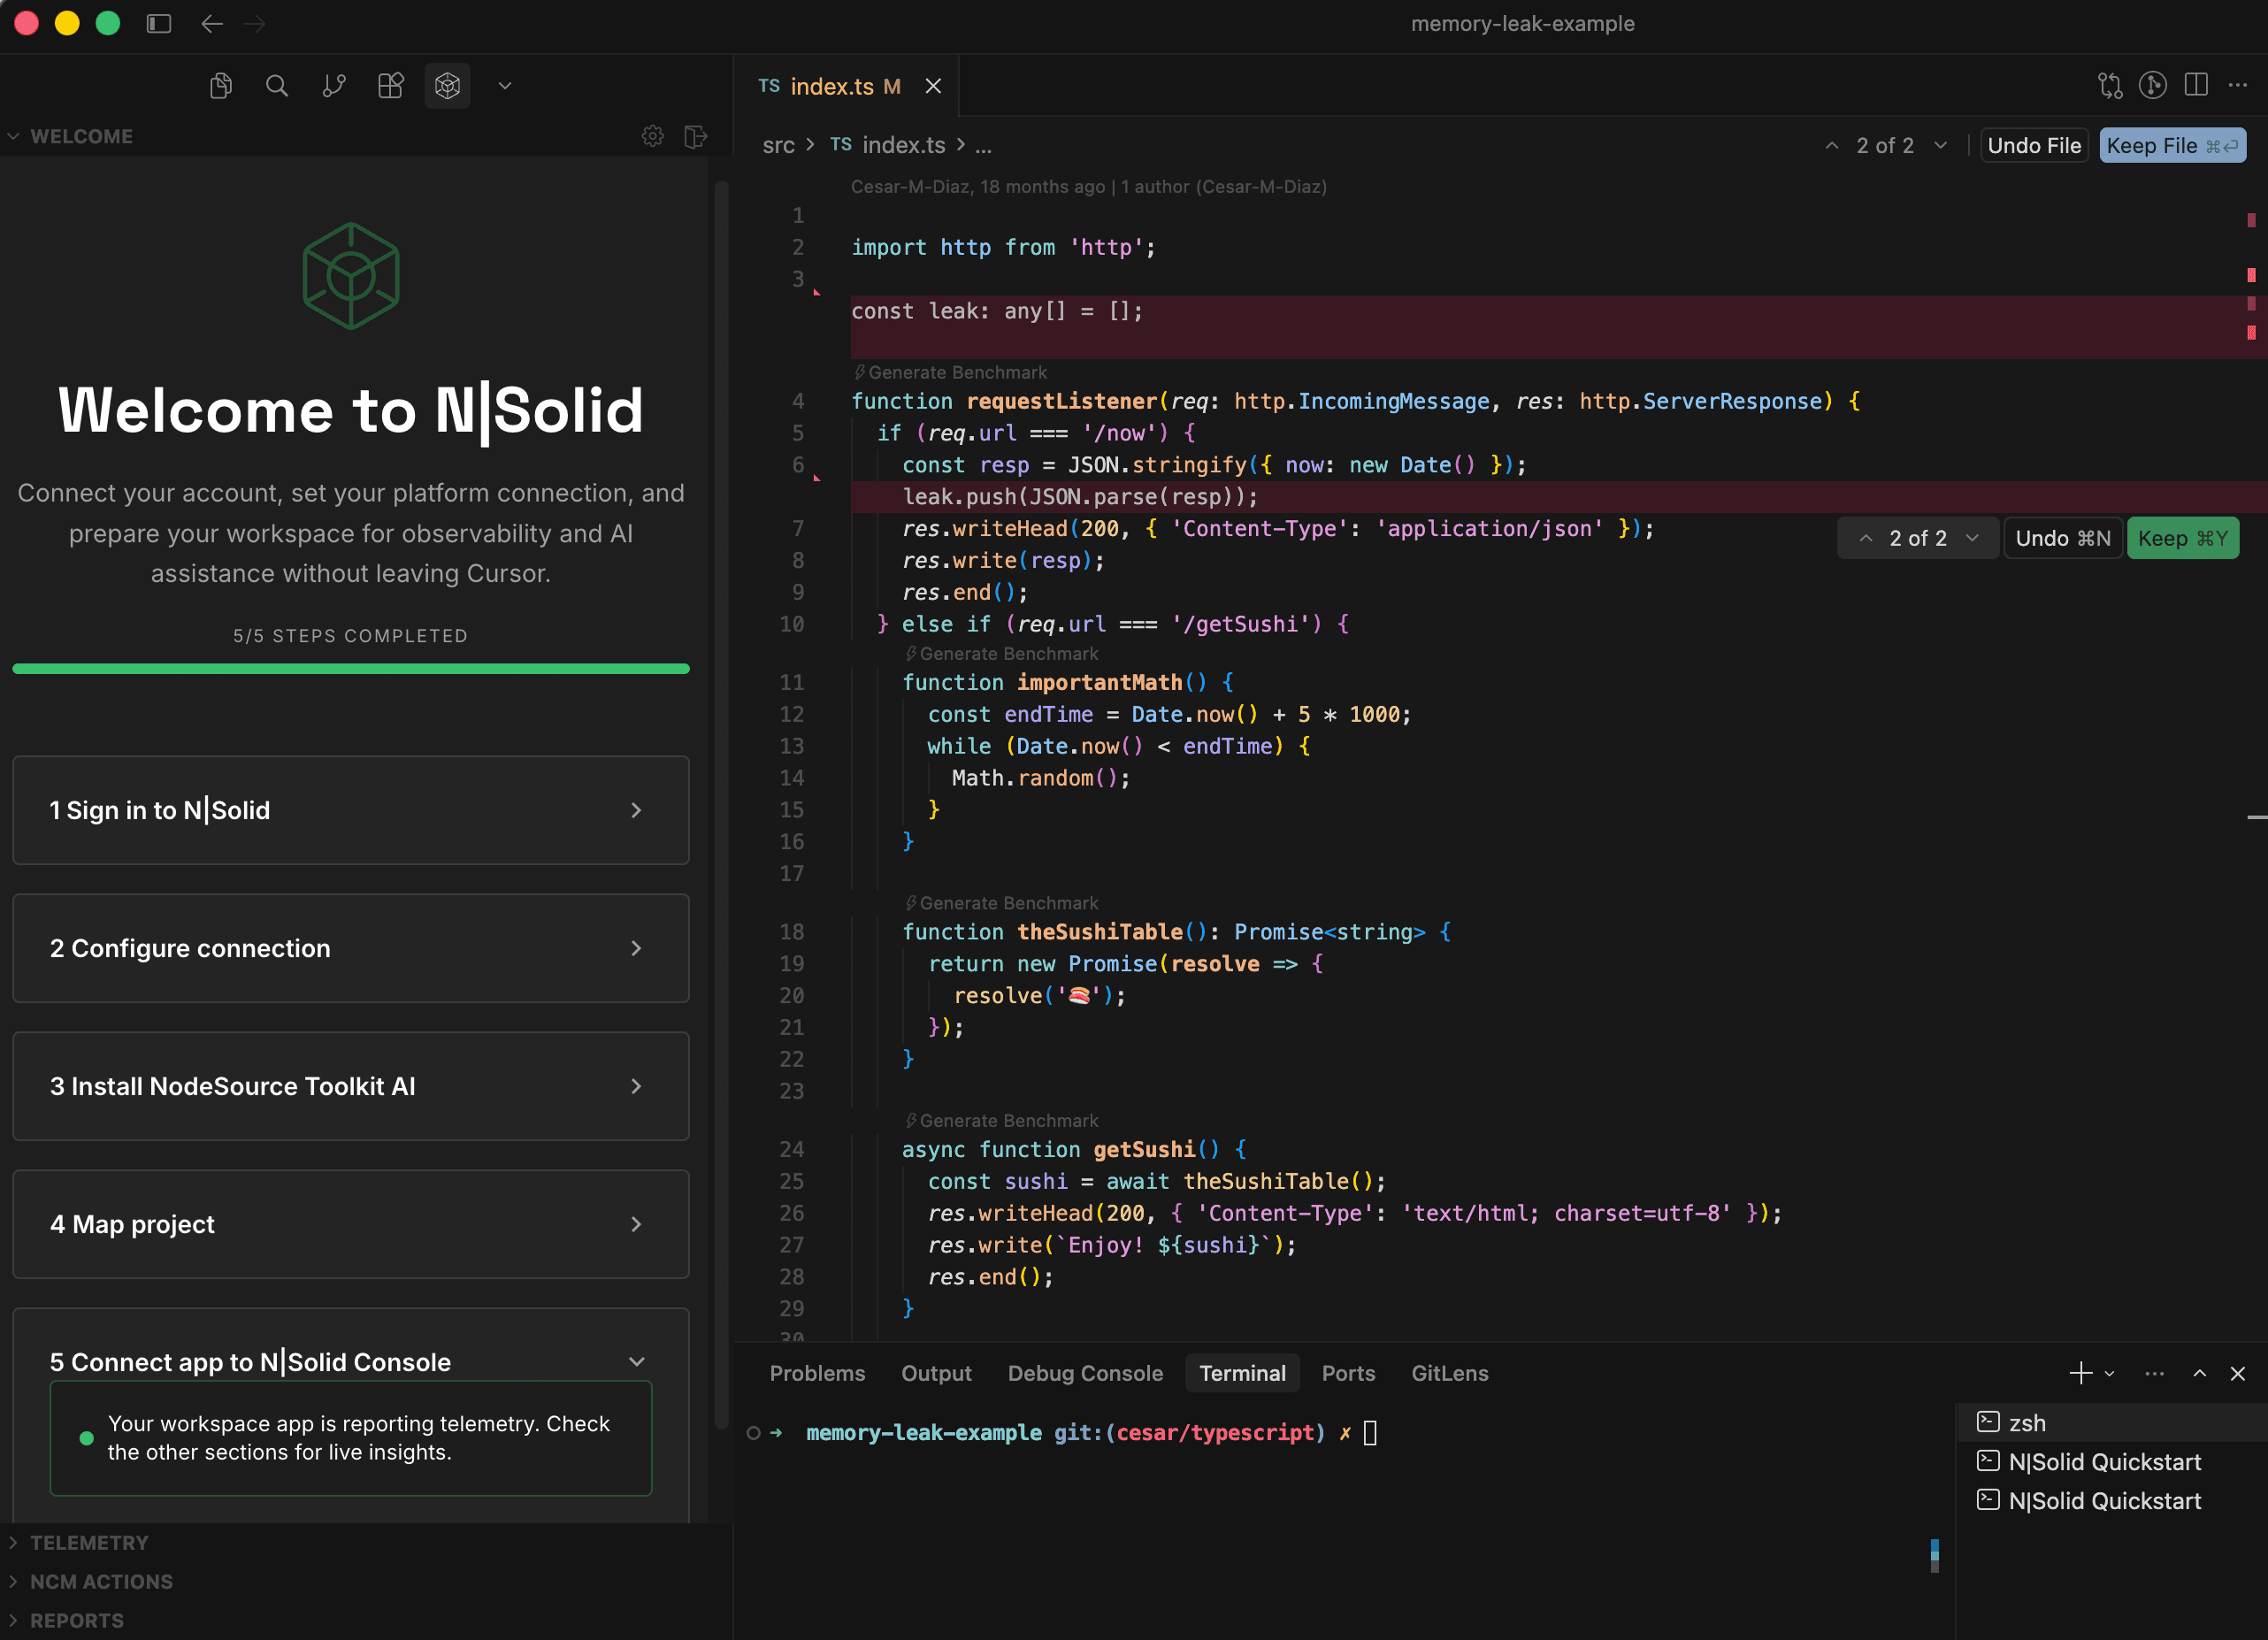
The corrected implementation looks like this:
if (req.url === '/now') {
  const resp = JSON.stringify({ now: new Date() });

  res.writeHead(200, {
    'Content-Type': 'application/json'
  });

  res.write(resp);
  res.end();
}
Without the module-level array, request objects are no longer retained beyond their useful lifetime.
Once a request completes, the garbage collector can reclaim the associated memory.
Verifying the Fix
Finding the root cause is only half of the investigation.
The next question is: Did the fix actually work?
To validate the solution, we capture another Heap Snapshot after deploying the updated code.
N|Solid AI analyzes the new snapshot and produces a very different result.
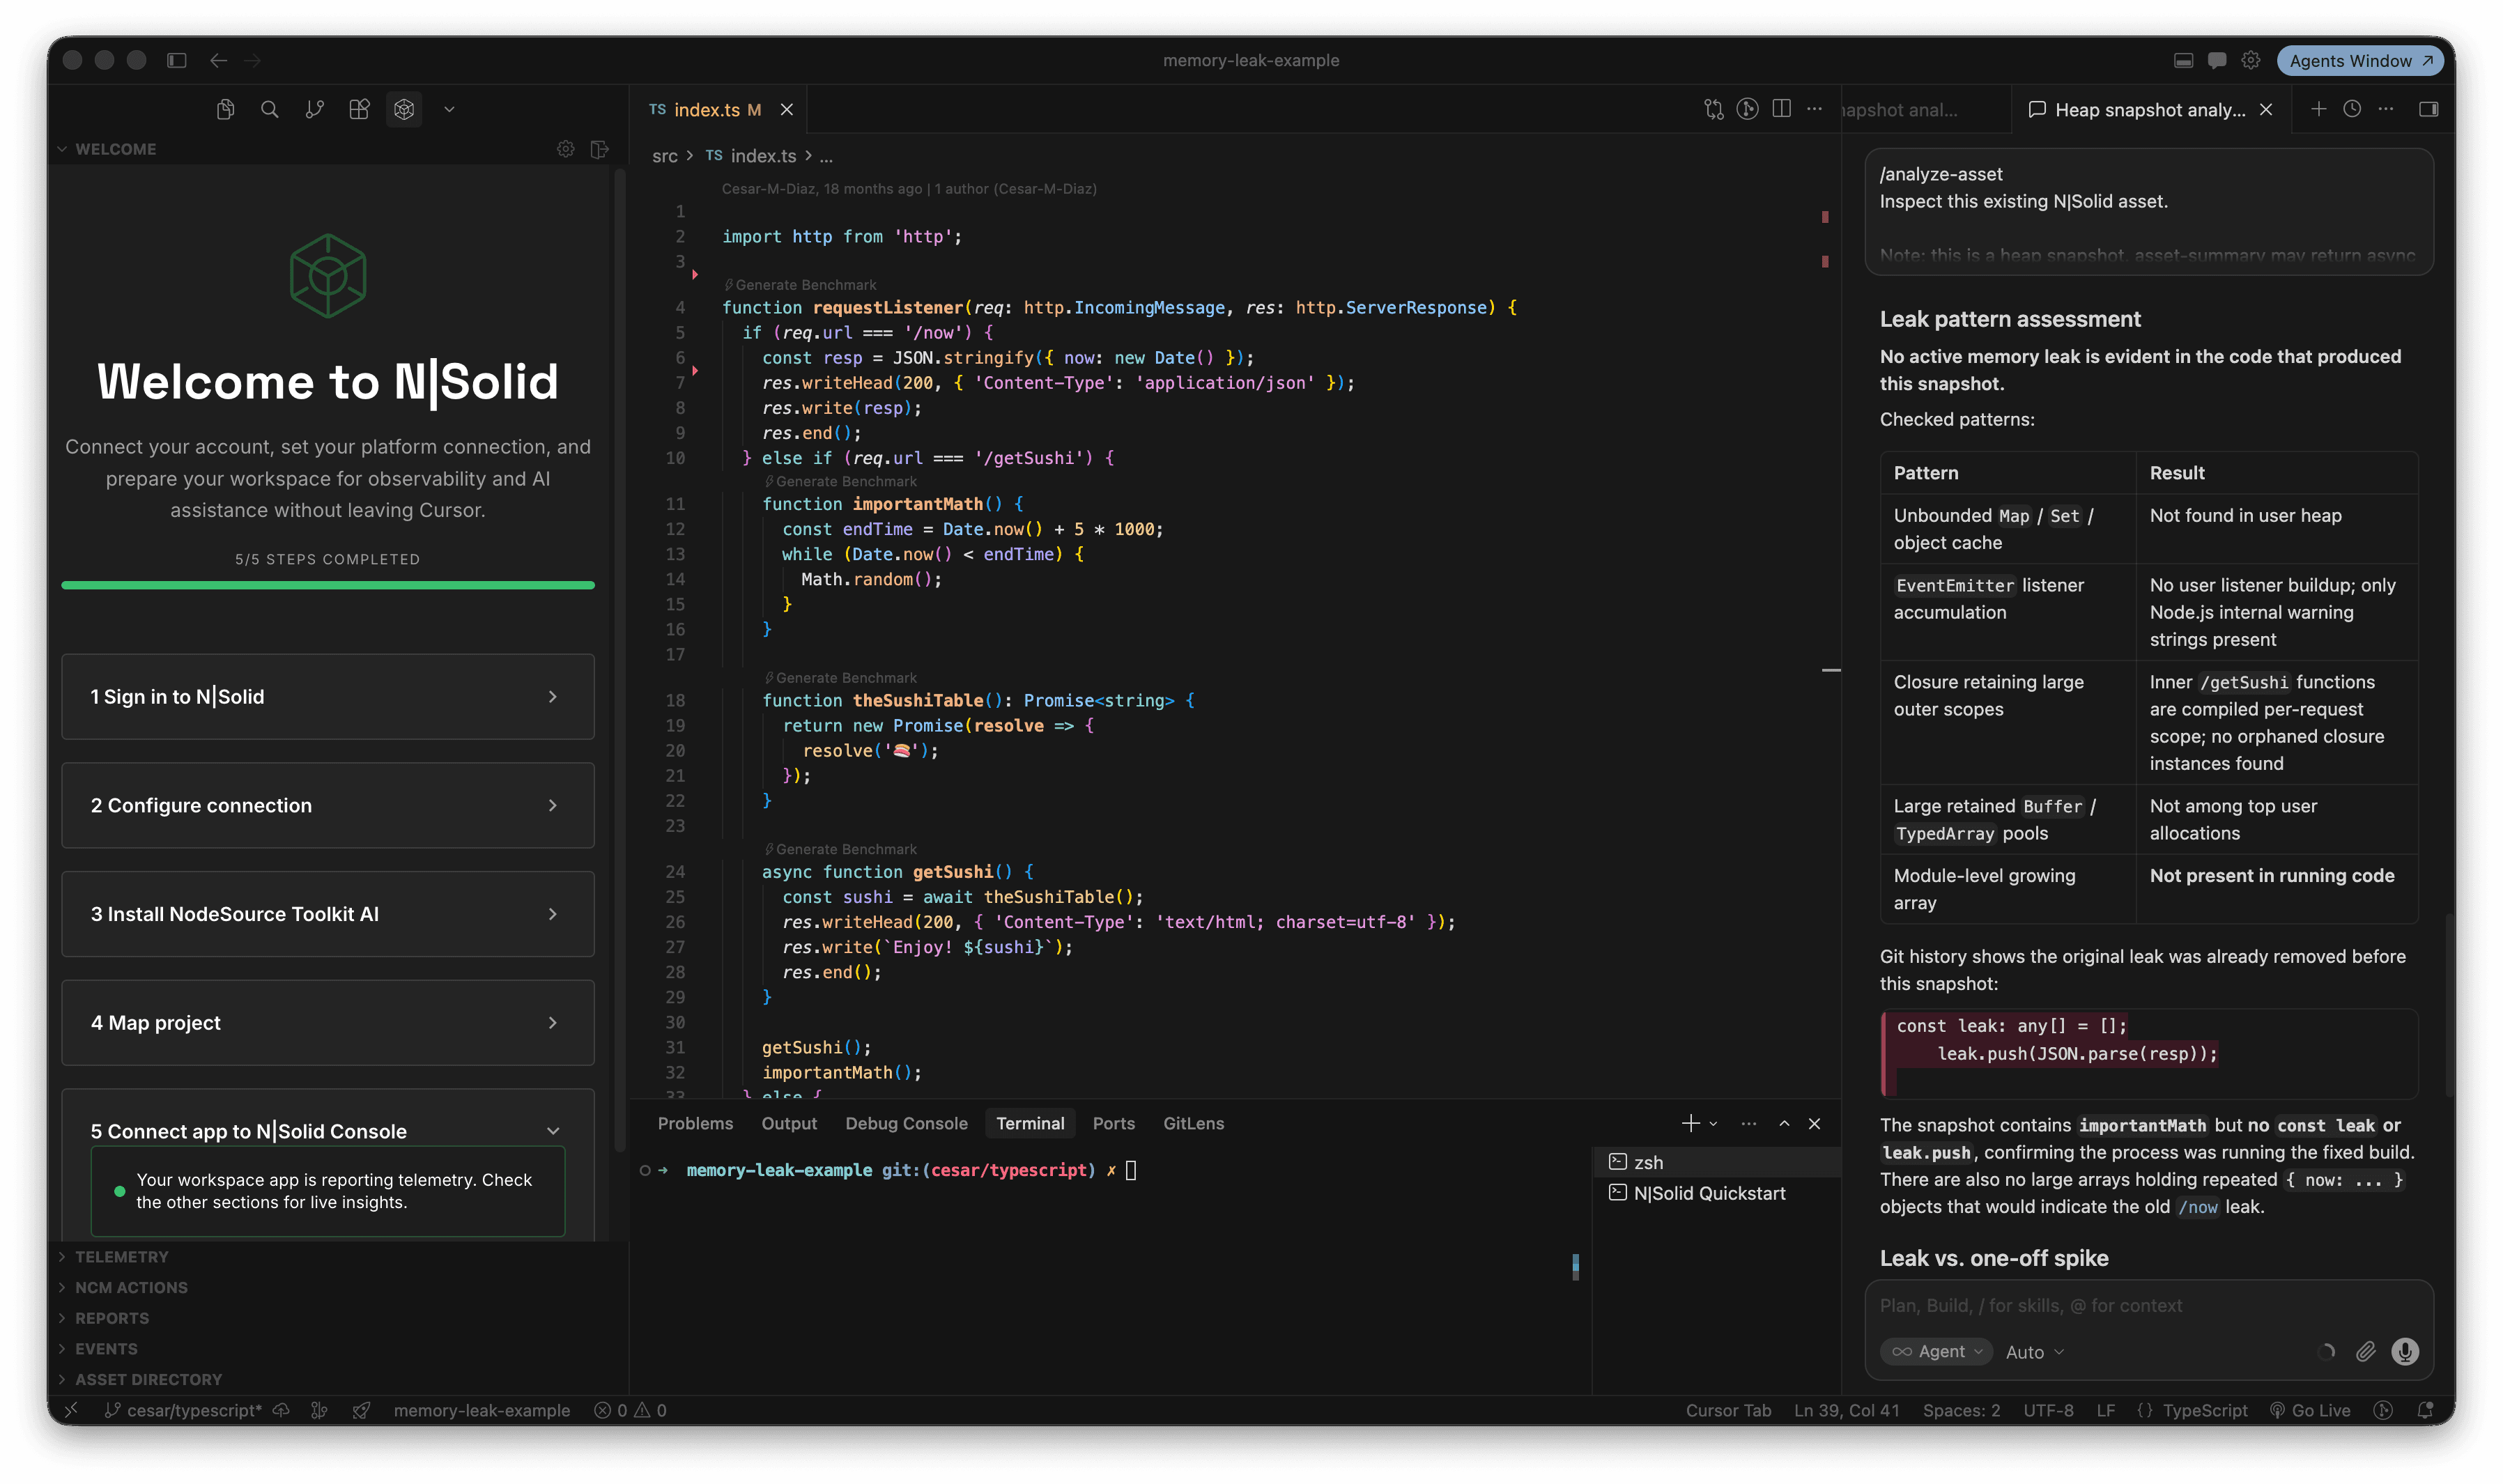
This time the report concludes:
No active memory leak is evident in the code that produced this snapshot.
The analysis confirms:
- No unbounded arrays are present.
- No growing collection of { now: ... } objects exists.
- The original leak pattern has disappeared.
- The process corresponds to the corrected implementation.
This provides confidence that the issue was not only identified, but successfully resolved.
Why Bring Production Debugging into the Editor?
Investigating production issues often requires switching between multiple tools:
- Monitoring dashboards
- APM platforms
- Heap Snapshot viewers
- Terminal sessions
- Source code
Every context switch slows down the investigation process.
N|Solid brings the entire workflow into the editor by combining:
- Runtime telemetry
- Heap Snapshots
- AI-assisted investigations
- Root cause analysis
- Fix verification
- Package security insights
directly inside VS Code, Cursor, and Windsurf.
The goal isn't simply collecting more data.
The goal is reducing the time between detecting a problem and understanding how to fix it.
Watch the Full Demo
Want to see the complete investigation?
Watch the full demo and follow the entire workflow from leak detection to root cause analysis and verification.
Video: https://youtu.be/ucOxdYuhEwQ
Get Started with N|Solid
N|Solid Extension helps developers investigate Node.js production issues without leaving their editor.
VS Code: https://marketplace.visualstudio.com/items?itemName=nodesource-inc.nsolid
Cursor, Windsurf & Antigravity: https://marketplace.windsurf.com/extension/nodesource-inc/nsolid/1.0.2
Start debugging Node.js production issues directly from your editor.