Get Clear Insights with Sourcemaps Using N|Solid CPU Profiles
When debugging performance issues in a Node.js application, CPU profiles play a crucial role in identifying bottlenecks. However, if your code is transpiled or minified, analyzing these profiles can be a challenge. This is where sourcemaps in N|Solid come in, helping you trace your code back to its original form for more meaningful insights.
Why Are Sourcemaps Important?
When working with modern JavaScript applications, it's common to use transpilers like TypeScript or minifiers to optimize code for production. However, this introduces a problem: the generated JavaScript code does not always match the original source. Function names and line numbers change, making it difficult to analyze CPU profiles effectively.
For example, without sourcemaps, you might see something like this in your profile:
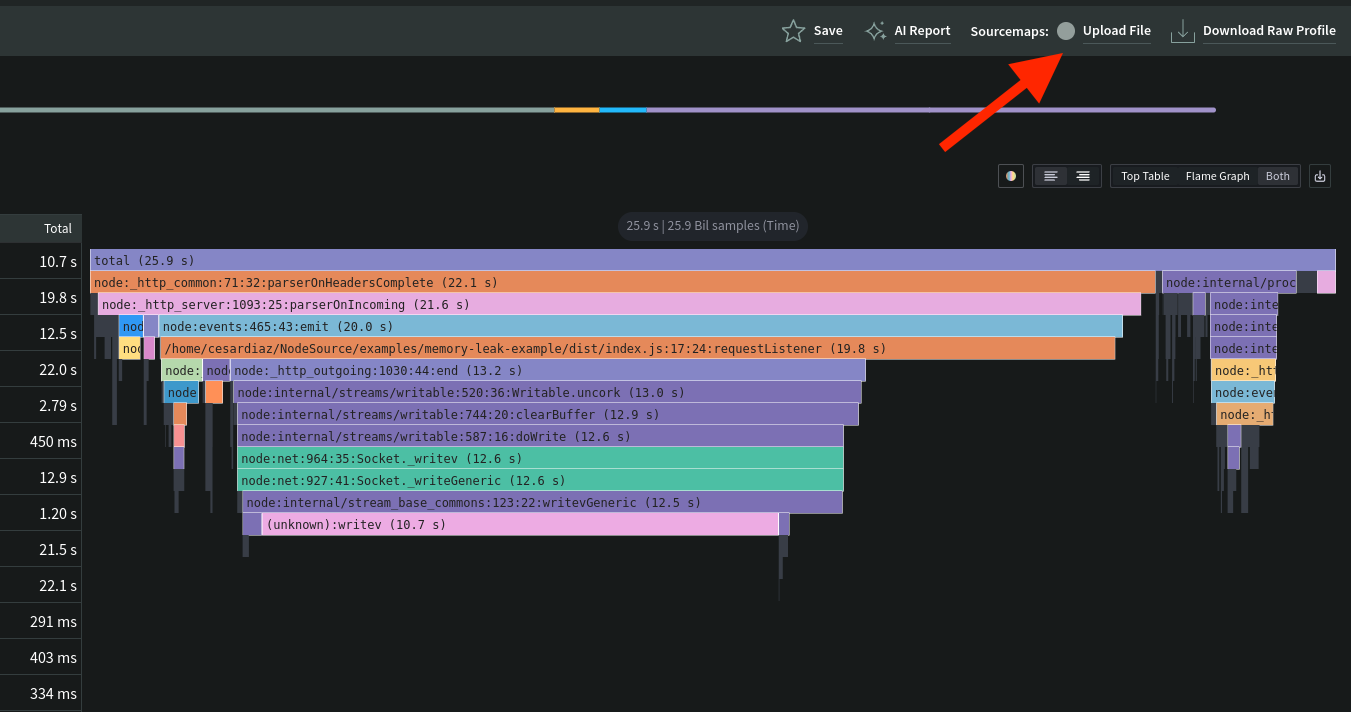
/home/user/project/dist/index.js:17:24:requestListener

If your project was originally written in TypeScript, this function might actually correspond to a completely different location in your source code, making debugging difficult.
How N|Solid's Sourcemap Feature Works
To bridge this gap, N|Solid provides an easy way to upload sourcemaps and resolve function names and positions. Here’s how it works:
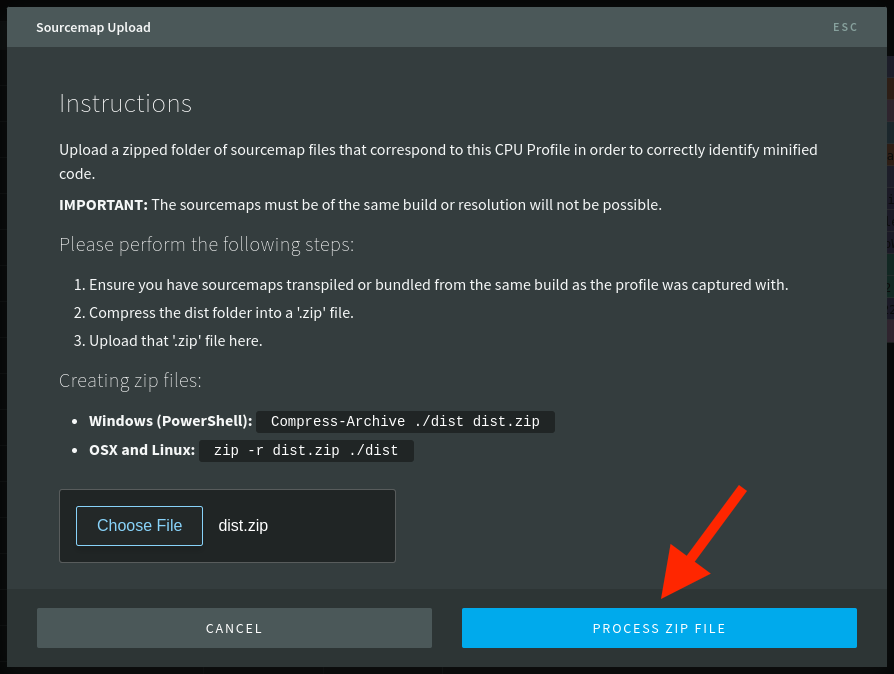
Uploading Sourcemaps
- Navigate to the Sourcemaps section in the N|Solid console.
- Click the Upload File button.
- Follow the instructions to upload a zipped folder containing your sourcemap files or JavaScript files with inline sourcemaps.
- Select the file you want to process.
- Click on Process Zip File


Processing and Resolving Functions
Once the upload is complete, N|Solid processes the sourcemaps and updates the function names and positions in your CPU profile. You will see a confirmation box displaying:
- Total nodes – the number of function calls analyzed.
- Resolved count – functions that were successfully mapped back to their original names.
- Unresolved count – functions that could not be mapped due to missing or incomplete sourcemaps.

Viewing Resolved Data
After processing, N|Solid presents a more readable and accurate CPU profile, including:
- Top 10 resolved functions by hit count – the most frequently occurring functions in your profile.
- Top 10 unresolved functions by hit count – functions that remain unidentified.
- Files with resolution – showing which source files contributed to the resolved functions.


Before and After: The Impact of Sourcemaps
Without sourcemaps:
memory-leak-example/dist/index.js:17:24:requestListener
With sourcemaps uploaded:
memory-leak-example/src/index.ts:6:24:requestListener
Now, the function appears with the correct file name, line number, and position, making debugging much easier.

Let’s look at another example. In the image below, you’ll notice that many functions are labeled as “unknown” or assigned random numbers, making it difficult to determine their origin in the code or which file they belong to.

However, after uploading the correct sourcemap, N|Solid processes the data and resolves the function names, revealing meaningful insights. In this case, it successfully mapped 864 functions, significantly improving the readability of the CPU profile.


Why This Matters
Having accurate function names and source positions allows developers to:
- Quickly pinpoint performance bottlenecks.
- Identify and fix problematic functions more efficiently.
- Gain a clearer understanding of how the application behaves in production.
Sourcemaps in N|Solid essentially acts as a translator, converting cryptic, minified function names into meaningful, human-readable ones.
Try It Out!
If you're working with transpiled or minified code in production, leveraging sourcemaps in N|Solid can save you hours of debugging time. Upload your sourcemaps today and gain deeper insights into your Node.js application's performance!