Node.js Performance Monitoring - Part 3: Debugging the Event Loop
In Part 1 and Part 2 of this series on Node.js Performance Monitoring, we covered the basic metrics to monitor and how to do this with N|Solid.
In this article, we’re going to dig a bit deeper into how to diagnose and resolve common Node.js bottlenecks in the event loop by understanding some of the key metrics around the event loop.
Understanding Parts of the Event Loop
A "task" is a unit of work to perform after completing an asynchronous operation. This should not be confused with event emitted on the EventEmitter; which only counts for a portion of where time is spent in task execution. For example, processing an http request also includes parsing the headers; which is done before the 'request' event is called.
The event loop cannot process multiple tasks simultaneously. Instead tasks are placed in a queue and processed sequentially. This means one one task can be held up because the one before it is taking a long time to complete. A bottleneck can be identified by observing an abnormally large amount of lag between processing asynchronous tasks. Because all task execution originates from the event loop it is the best location for initial bottleneck measurements.
An event loop without lag (we'll consider "healthy") will show that no task has been queued to wait for the completion of another task. Instead they are all processed the moment they are received.
In Node.js it is impossible to determine the moment a task is received. Only when it is ready to be processed. This is because Node.js relies on the operating system's kernel to handle the task queue. Node.js itself has no insight into this. Thus if 2 tasks are ready to be processed at the same time Node can only know the second task is available after the first has been completed. So, for example, if your application requires low latency responding to TCP requests it is important to know that no two tasks have overlapped.
High event loop lag, low event loop idle
When an application is simultaneously experiencing both high lag and low idle time in the event loop, you can expect to find a synchronous operation of some form as the source of the bottleneck in your application.
There are different types of synchronous operations that need to be considered.
One is the standard *Sync() methods that you find in the Node.js core API, particularly in the ‘fs’ module (e.g. fs.readFileSync()). These methods have the unfortunate property of running inside your event loop, on the same thread as your JavaScript. Choosing this method means that with each cycle of the event loop there’s a pause until execution completes; nothing else can process in the meantime. You should generally avoid all synchronous core methods in your application for this reason.
The other, more subtle, type of synchronous operation is entirely in JavaScript. Because your JavaScript is executed as part of the event loop, it will always delay other events queued for execution. A typical example of problematic JavaScript is complex string concatenation or parsing. Often, rendering a very complex template, or parsing a very large JSON blob, will take up enough CPU time to cause a noticeable impact on your application’s responsiveness due to the high-lag, low-idle scenario. This is why Node.js is generally said to be not suitable for long running CPU-intensive workloads.
The more your application needs to execute in CPU in a single cycle of the event loop, the more you are going to occupy the event loop and therefore prevent other tasks from being processed in a timely manner. You may want to consider offloading your Monte Carlo simulations to a separate process.
Combing through your code and guessing what might be causing your event loop delay is a tough chore without proper insight. By utilizing N|Solid, you can set an event loop threshold to trigger an alert when your event loop is blocked for a given period of time, in addition to triggering a CPU profile that can be examined later. From within the N|Solid console, you can then use the CPU profiler to explore and identify where that synchronous execution is taking place.
Loading your CPU profile as a flame graph lets you dig down into your call stacks to see which calls are occupying the most time in your event loop. Here’s a flame graph as an example:
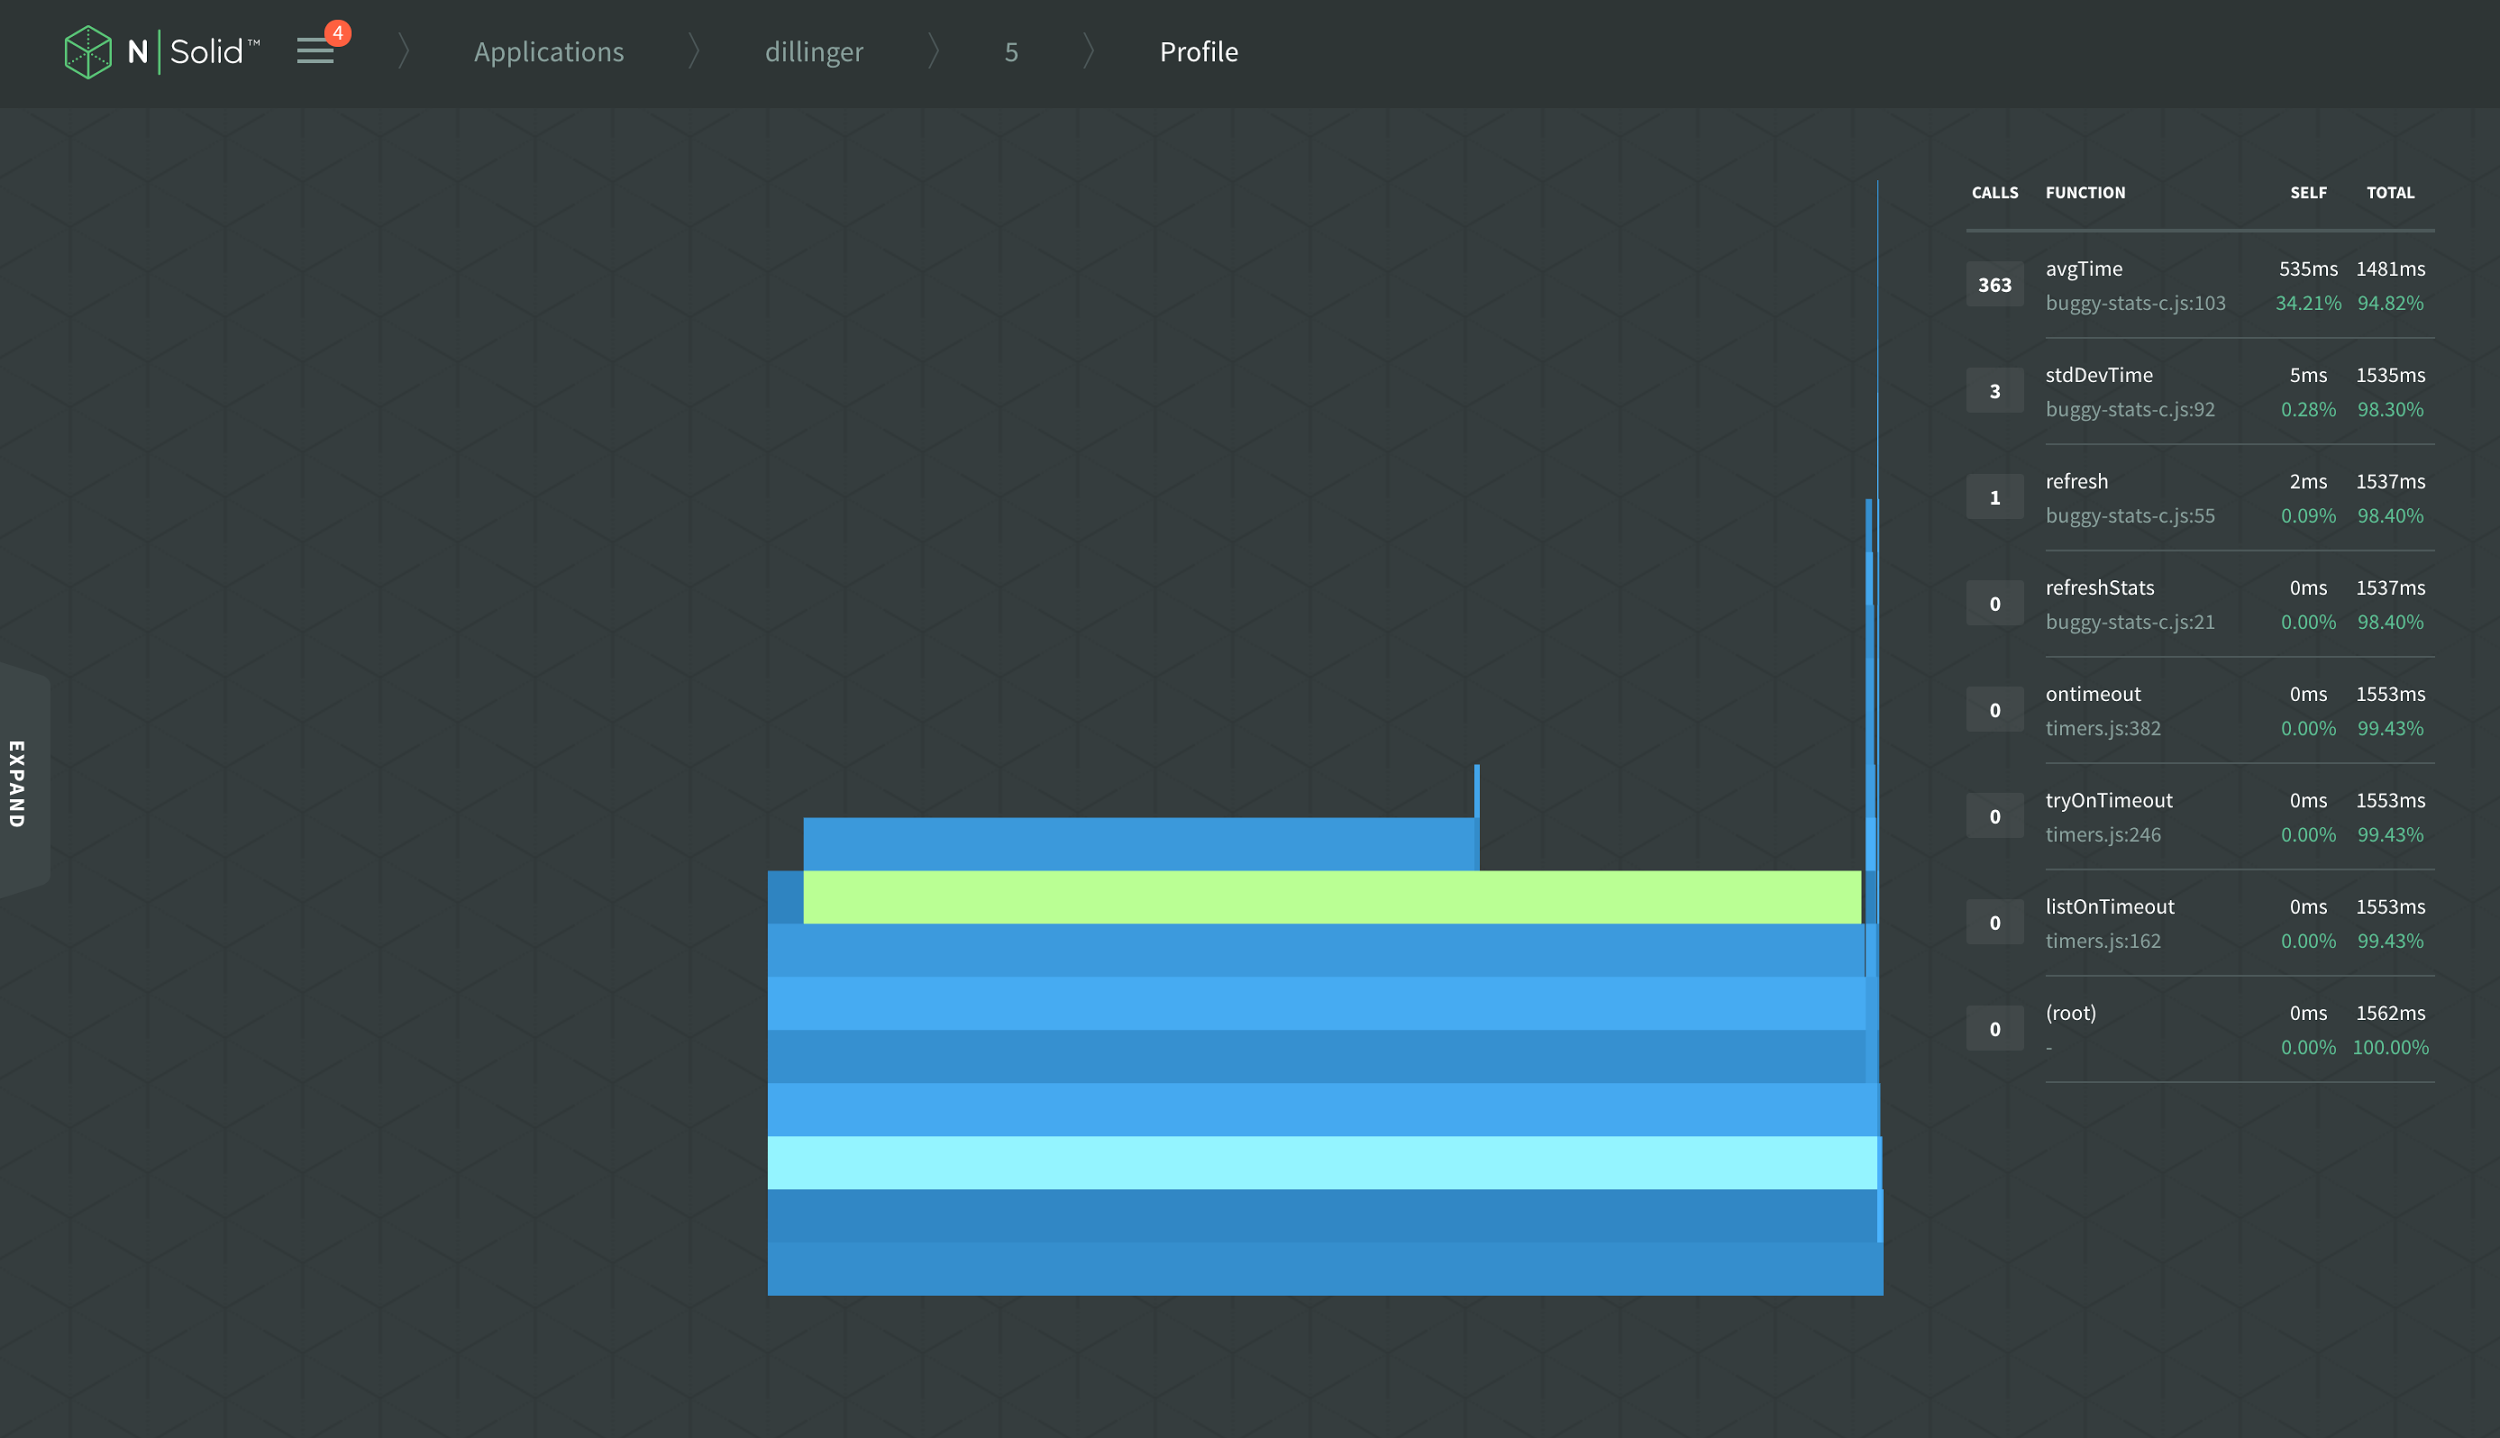
The horizontal width of each bar represents the amount of time spent in CPU, so look for the blocks nearest the top of the call stacks taking up the most horizontal space. These blocks indicate a long CPU call time for a single function, and can often indicate a CPU-intensive JavaScript workload or a call into a synchronous Node.js core API method. Tackle these first, ideally by replacing the code with more efficient versions, or, in more extreme cases, consider offloading unavoidable CPU intensive work into a separate service.
You will likely find that there is a tradeoff to be made between responsiveness and throughput when you are CPU-constrained. If you break CPU work up into pieces to be executed separately, you free up your event loop to be more responsive to all of the additional work it needs to attend to, but you will likely pay a cost in the overhead of "chunked" work.
It’s essential that you establish benchmarks for your application that measure the metrics that are important to you and then tune your application to maximise these metrics. Perhaps throughput is not as essential as responsiveness. Perhaps you care more about first-byte-to-client than the total amount of time it takes to deliver the entire content. Perhaps you simply want to scale the number of clients using the smallest amount of hardware and some reduction responsiveness is acceptable to achieve that scale. Measure what is important before you begin to tune arbitrarily because there are always trade-offs.
Low event loop lag, High event loop idle
Typically you’re going to want your Node.js application to perform with low lag and high idle time in the event loop—this is usually a sign of an efficient application. Unfortunately, it can also mask efficiency issues, giving you a false sense of confidence that is only exposed during unexpected peak usage.
If you are experiencing timeouts, or general performance degradation in an application that’s demonstrating low lag, high idle time in the event loop, a likely cause of the issue is that there’s an I/O or downstream resource that’s acting as a bottleneck. In this case, your application isn’t maximizing the use of the local resources available to it, particularly the CPU.
A problematic I/O resource in this situation could be anything the application makes a call to that requires a callback or a Promise that isn’t a simple JavaScript block. For example, it could be as simple as a local filesystem resource, or a more complex external API such as a database or downstream service.
The I/O resource is likely to have a performance constraint of its own. This may either be an expected responsiveness issue, i.e. the resource simply isn’t designed to respond as quickly as you need, or it could be that the service is overloaded and your Node.js application is able to throw much more traffic at it than it can reasonably handle.
This is a very common scenario when Node.js is inserted into an existing environment and has to make external calls to existing services. An experience that NodeSource sees repeatedly when assisting companies migrate to Node.js is that their new application can handle much more throughput than their existing stack can, thereby exposing bottlenecks that have always existed but were never noticed.
In a services-based architecture, the performance of your application is dependent on every service involved in the handling of each transaction. Diagnosing problems of this kind requires insight into each service that is part of the transaction change and comparing the event loop and resource usage of each. When you have the kind of side-by-side comparison afforded by the N|Solid console, it is generally fairly easy to spot the lowest-hanging-fruit in your path to optimization.
Or, maybe you just have a slow disk and it’s time to upgrade to an SSD. Either way, N|Solid should be able to help you pinpoint the source of your performance constraint and give you a clue to solving it.
Monitoring with N|Solid
Instrumenting scripts to gain greater insight into the event loop is incredibly inaccurate or impossible without a native C++ extension to extend the core functionality of Node.js.
Currently, N|Solid is the easiest way of debugging and gaining insight into your Node.js applications, a complete drop-in replacement with no code modifications.
With the N|Solid StatsD interface you can easily view real-time metrics into the health and performance of your Node.js event loop in your preferred APM tool. N|Solid provides nearly 50 application metrics with the following focused specifically on providing insight into the event loop.
- loopIdlePercent - Percent of time that Node.js is waiting for I/O ("idle")
- loopEstimatedLag - The amount of time a I/O response may have to wait before being processed
- loopsPerSecond - The amount of event loop "turns" elapsed in the last second
- loopAvgTasks - The average amount of async JavaScript entries per loop
To learn more about your applications’ event loop health and performance, you can try deploying with N|Solid instead of the vanilla Node.js runtime.