Diagnostics in Node.js Part 3/3
If you haven’t checked out the first two part of our ‘Diagnostics in Node.js’ series, click here and the second part here.
This is a 3-part blog series on Node.js. It is based on Colin Ihrig's talk at JSConf Colombia. The topics are separated by the age of diagnostic techniques - from the oldest to the newest:
- Part One: Debug Environment Variables, Warnings, Deprecations, Identifying Synchronous I/O and Unhandled Promise Rejections.
- Part Two: Tick Processor Profiling, The V8 Inspector, CPU Profiling, Heap Snapshots, Asynchronous Stack Traces.
- Part Three: Tracing, TLS Connection Tracing, Code Coverage, Postmortem Debugging, Diagnostics Reports.
Let’s begin! 🚀

Tracing
Tracing has been around in Node.js since version 6, but it has gotten more attention over the last few years. The Trace Event provides a mechanism to centralize tracing information generated by V8, Node.js core and userspace code.
By default the node, node.async_hooks, and v8 categories are enabled.
node --trace-event-categories v8,node,node.async_hooks server.js
You can execute --trace-event-enabled to get the output of several events that happened inside of Node.js. This can include accessing the file system, performance data, async hooks, and others. You can configure which events you want to see by using the flag --trace-event-category, allowing users to create custom trace events and use them for example to see how long an operation takes.
In chrome you can open chrome://tracing/, click the record button allowing you to visualize traces like this:
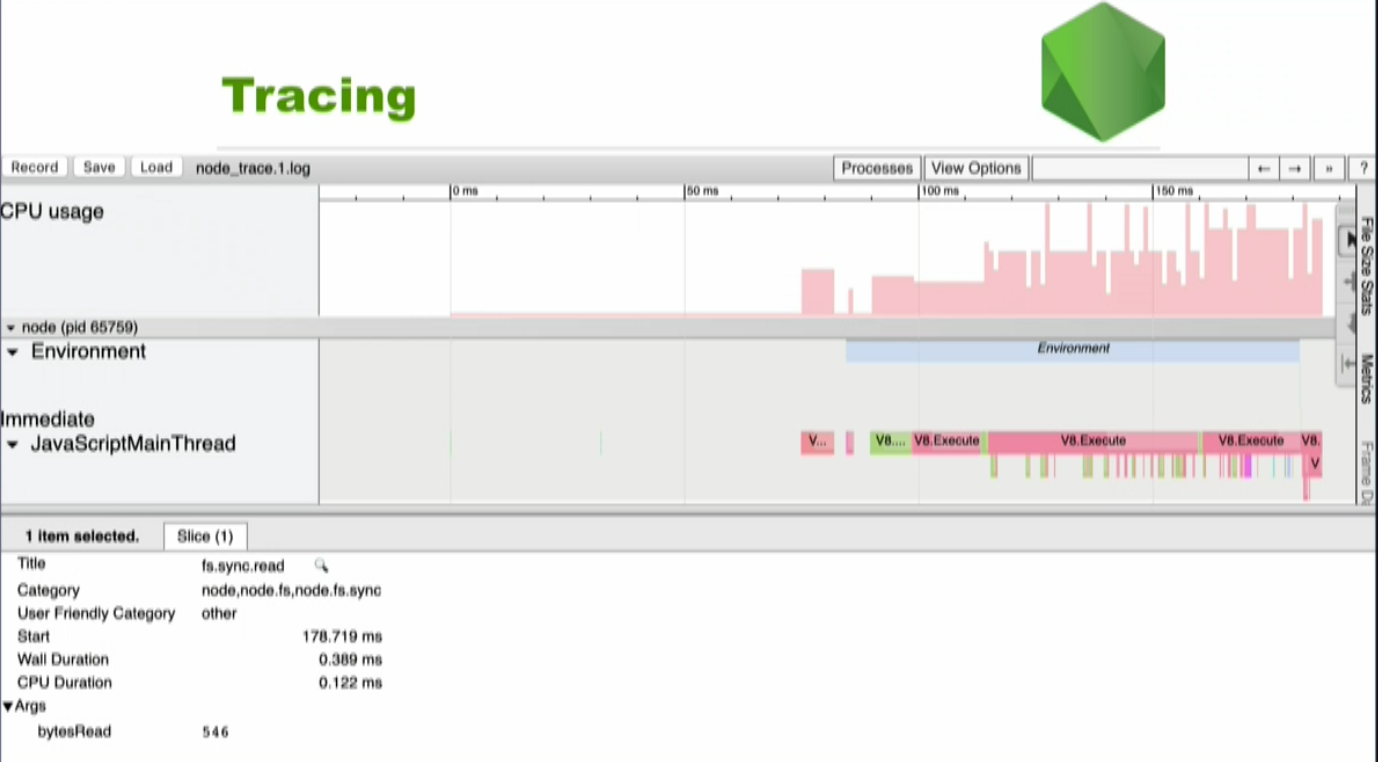
If you look at the bottom of the screen you can see fs.sync.read. This is the read operation of the file system. There are 546 bytesRead. It is also possible to see when the tracing started, how long it took, and the CPU Duration, which is all very useful for seeing what’s going on with your code.
TLS Connection Tracing
It is possible to use TLS Connection Tracing in more recent versions of Node.js. You may have experienced the following: You try to connect to a server via https but it doesn’t work. You get redirected to use the OpenSSL command line tool and it gets complicated. Now you can use the--trace-tls flag from the CLI for all TLS connections and you will get a significant amount of debugging information printed to the console every time you try to establish a TLS connection. The flag will work for all the connections in your application and you can establish the connection do it on a peer server or per socket instance.
Code Coverage
Code Coverage is a measurement of how many lines/blocks/arcs of your code are executed while the automated tests are running. In other words, it is measuring how well your test set is covering your source code. i.e. to what extent is the source code covered by the set of test cases.
Code coverage is collected by using a specialized tool to instrument the binaries to add tracing calls and run a full set of automated tests against the instrumented product. A good tool will give you not only the percentage of the code that is executed, but will also allow you to drill into the data and see exactly which lines of code were executed during a particular test.
V8 Code Coverage was the old way of measuring code coverage. It had many problems including the instrumentation of every line of code with counters and new language features lagging behind. Now V8 supports code coverage natively, and Node.js can take advantage of this using the NODE_V8_COVERAGE environment variable. This variable takes a string as its value which will be the name of a newly formed directory where you want to write your coverage information to.
Using coverage built directly into the V8 engine could address many of the shortcomings facing the previous transpilation-based approach to code coverage. The benefits being:
Rather than instrumenting the source-code with counters, V8 adds counters to the bytecode generated from the source-code. This makes it much less likely for the counters to alter your program’s behavior. Counters introduced in the bytecode don’t impact performance as negatively as injecting counters into every line of the source (it’s possible to notice a 20% slowdown in Node.js’ suite vs 300%). As soon as new language features are added to V8, they are immediately available for coverage.
The coverage information that is generated by V8 is a JSON format that is hard to understand if you look it up yourself. However, there are tools like c8 that can help you with this. The following is an example of using c8 with npx.
if (process.argv[2] === 'foo')
   console.log('got the foo arg');
else
   console.log('did not get the foo arg');
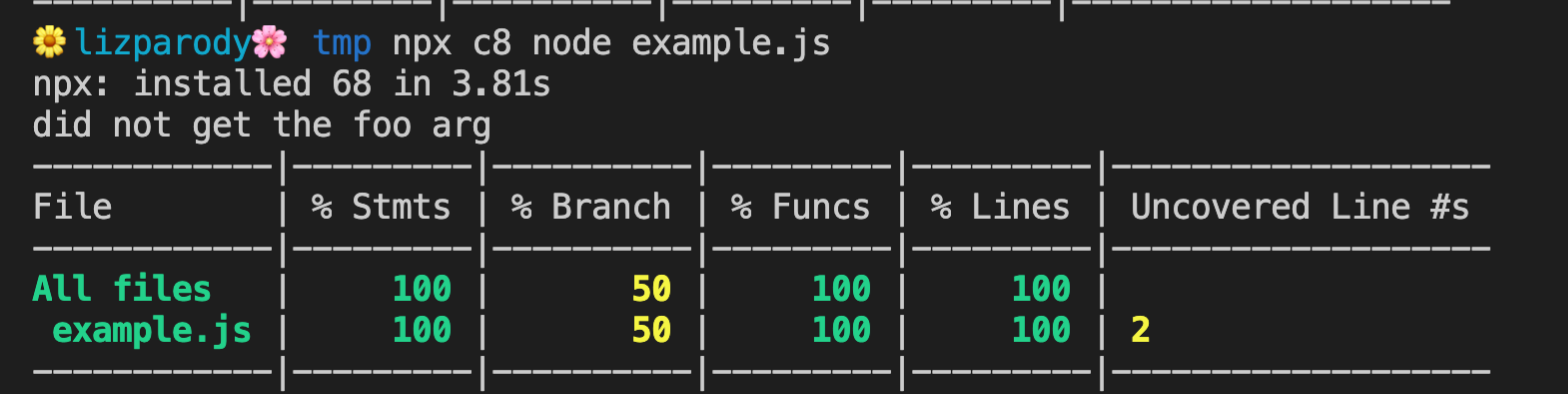
In this example, process.argv was called with no other arguments in the command line. In this case the output is ‘did not get the foo arg’. C8 will print out a list of all the files and highlights coverage percentiles for all statements, branches, functions, lines and uncovered lines. There are ways that you can get a more detailed view. For instance you can open a file and you can investigate its coverage line by line.
Postmortem Debugging
The shortcomings of traditional debugging tools have led to the rise of a separate class of debugging, referred to as postmortem debugging. This typically consists of capturing a core dump of a process when it crashes, restarting the process, and analyzing the core dump offline. This allows the process to be debugged while keeping the production system running.
Postmortem Debugging is another way to get valuable information out of Node.js. The problem with Postmortem Debugging is that it has a very high barrier of entry, as it is necessary to set up your system to collect core files.
Core files are an exact snapshot of an application when it crashes. They are turned off by default in most operating systems because the core files can get quite large. As such you have to enable it and then run Node with the flag --abort-on-uncaught-exception.
Once you get a core file you can analyze it with llnode which gives you deep insides into stack frames across the javascript and c++ boundaries. This allows you to inspect JavaScript objects to obtain more information about the crash. It is worth noting that most tools don’t give that type of visibility.
Another problem with this approach, is that tools like llnode depend heavily on the internals of V8. As such it tends to break every time node upgrades its version of V8. This problem led to another recent addition to Node which are Diagnostics Reports.
To see examples and more information of this too, read this blog post.
Production Diagnostics
Another way to access diagnostics is NodeSource’s Enterprise Node.js Runtime called NSolid. It solves the challenge of generating diagnostic assets such as CPU Profiles and Heap Snapshots in production, without requiring external packages or instrumentation of your code.
You can simply run your existing Node.js apps on our Node.js Enterprise runtime and NSolid magically exposes performance, diagnostics and security capabilities under the hood with low enough overhead that it can all be done in production.
[INSERT DEMO VIDEO HERE] https://vimeo.com/417916871/0f2767ff9c
Find out more here
Diagnostics Reports
It’s possible to think of Diagnostics Reports as light-weight Postmortem Debugging. We don’t get the same level of detail we can access in a core file, but it has a much lower barrier of entry and is more configurable.
The report does not pinpoint the exact problem or specific fixes, but its content-rich diagnostic data offers vital hints about the issue and accelerates the diagnostic process.
You will be able to generate Diagnostics Reports on a signal such as a crash or an uncaught exception. They are programmatic APIs inside of Node.js allowing you to execute process.report.getReport which generates a JSON object containing data about the system, the node process, libuv information, c++ stack and more.
Diagnostic Reports de this by using a tool called First Failure Data Capture (FFDC). It is designed to instantly collect information about what led to a failure so that users don’t need to re-create the failure.
This Diagnostic Report is generated in a semi man-machine readable format. This means you can read it in its original state if you’re moderately skilled at diagnostics reporting or it can be loaded into a JS program or passed to a monitoring agent. The resulting file contains information about the state of the application and the hosting platform, covering all vital data elements.
This document can improve the overall troubleshooting experience because it: Answers many routine questions which can reduce the number of iterations needed to understand the cause of the failure. It offers a comprehensive view of the state of the application and virtual machine at the time of failure. This information can drastically improve decision making for the next set of data collection, if required. Ideally, the FFDC enables someone to resolve the issue without any additional information!
Diagnostic Reports are still experimental, but because it is not code that is going to really impact your running application it is recommended to use it.
The following command line argument runs Diagnostic Reports:
$ node--experimental-report --diagnostic-report-uncaught-exception w.js

Writing Node.js report to file: report.20190309.102401.47640.001.json
Node.js report completed
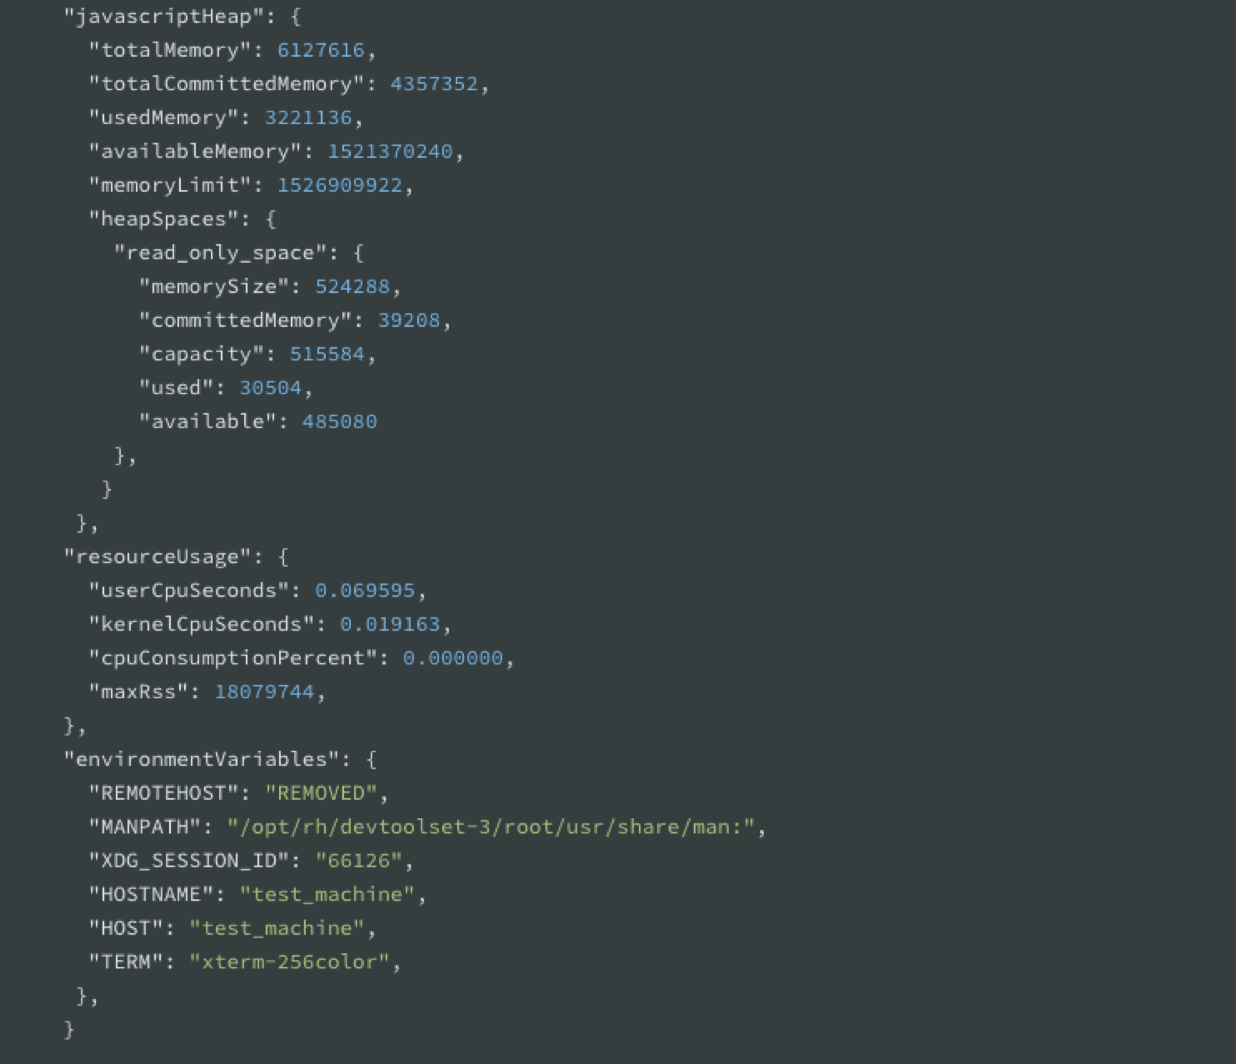
The data it captures can be correlated with anomalies like fatal errors that terminate the program, application exceptions, or any other common failure scenarios. The data the tools actually captures are JavaScript heap statistics, native and application call stack, process’ CPU consumption, and more.
There are a hand full of flags that you must use to configure it:
--experimental-report=> because it is still experimental, this flag will enable Diagnostic Reports.--report-on-fatalerror=> If you are interested in collecting information when node crashes in the c++ layer--report-uncaught-exception=> If you are interested in JavaScript uncaught exceptions--report-on-signal=> if you want to send a specific signal to your process and have it generate this report--report-signal=signal=> you can define which signal you want to use, by default it uses sigUser2--report-directory=directory=> lets you specify where you want to write these reports to--report-filename=filename=> lets you specify the file-name of these reports (by default is the year, date and other stuff)
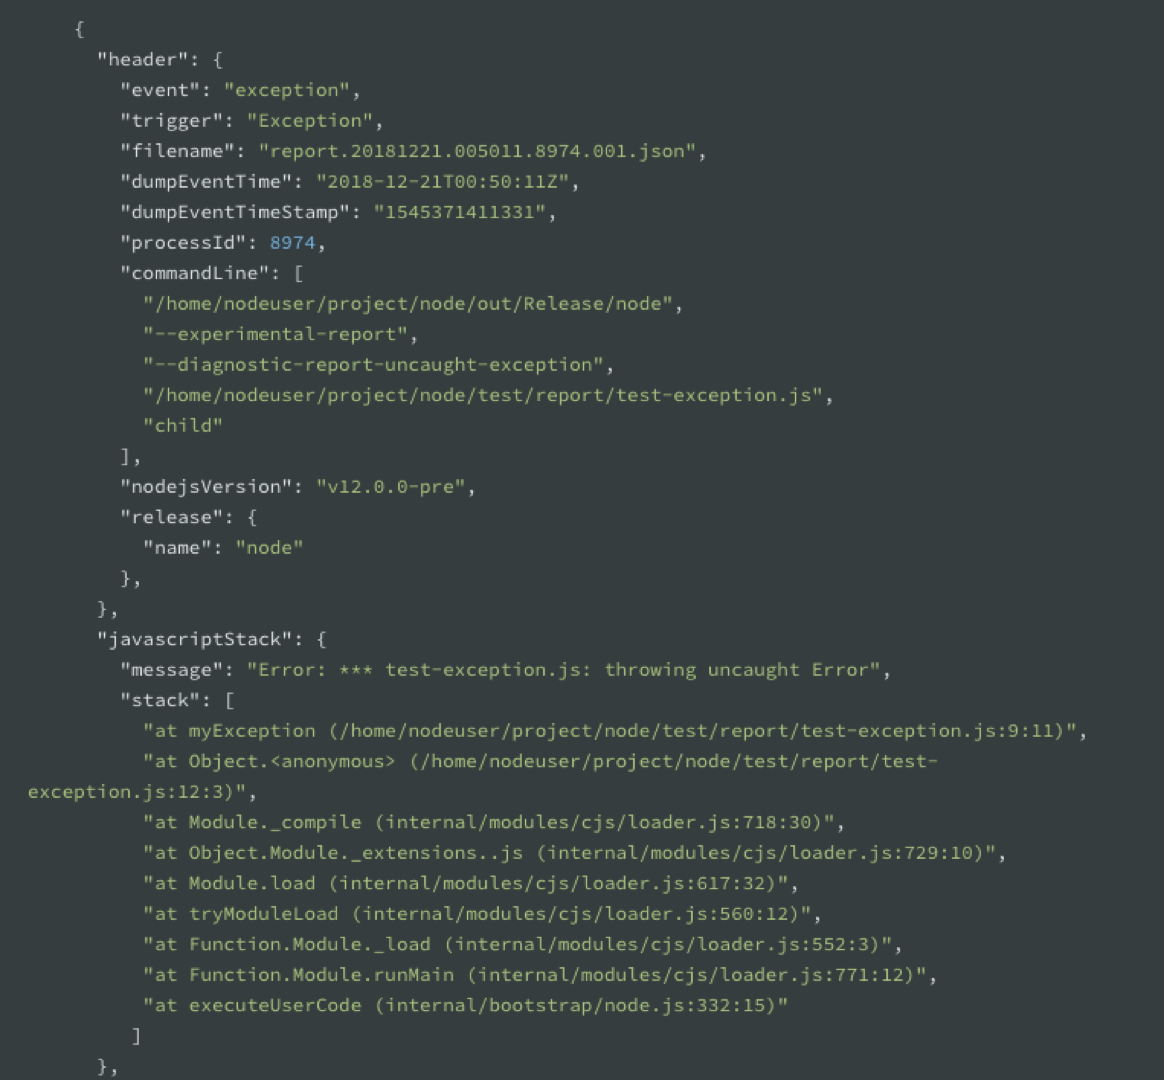
This is how the report looks like: A big JSON object that contains event, trigger, timestamps, processId, and the commandLine flags you used.
References:
Easily identify problems in Node.js applications with Diagnostic Report
Rethinking JavaScript Test Coverage
Easily identify problems in Node.js applications with Diagnostic Report