Diagnostics in Node.js Part 1/3
A diagnostic is a practice concerned with determining a particular problem using a combination of data and information.
The same concept can be applied to Node.js.
When there is a bug, diagnostics utilities can help developers identify the root cause of any Node.js application anomaly whether it occurs in development or production.
There are many types of issues a Node.js application can run into. This includes: crashing, slow performance, memory leaks, high CPU usage, unexpected errors, incorrect output, and more. Identifying their root cause is the first step towards fixing them.
While diagnostics in Node.js doesn’t point to the exact problem or specific fixes, it contains very valuable data that hints about the issue and accelerates the diagnostic process.
This is a 3-part blog series on Node.js. It is based on Colin Ihrig's talk at JSConf Colombia. The topics are separated by the age of diagnostic techniques, from the oldest to the newest:
- Part One: Debug Environment Variables, Warnings, Deprecations, Identifying Synchronous I/O and Unhandled Promise Rejections.
- Part Two: Tick Processor Profiling, The V8 Inspector, CPU Profiling, Heap Snapshots, Asynchronous Stack Traces.
- Part Three: Tracing, TLS Connection Tracing, Code Coverage, Postmortem Debugging, Diagnostics Reports.
Let’s begin!
A Little bit of History:
In the early years of Node.js it used to be very hard to get diagnostic-information. Node.js was built with a “small core” philosophy, meaning that the core of the project was aimed to remain as small as possible.
It was very important that the Node.js core worked properly, and non-essential things like diagnostics were pushed out into the npm ecosystem (since Node.js can still work just fine without diagnostics). This left us with npm modules such as node inspector node-heapdump, longjohn and others. This dynamic slowed the process of incorporating diagnostic tooling into Node.js itself .
As Node.js matured and as more and more enterprises continued to adopt Node.js, the maintainers realized that diagnostic capabilities were a necessity. These needed to be built into the project, so in the last few years a lot of work has been done to make this a reality. Instead of having to npm install
Debug Environment Variables
One of the oldest diagnostic mechanisms built into Node.js are Debug Environment Variables. There are two environment variables you can use to print out useful information from Node.js either in the JavaScript layer or in the C++ layer. Those variables are:
NODE_DEBUGfor JavaScript loggingNODE_DEBUG_NATIVEfor C++ logging
All you have to do as you start your Node.js process, is to pass a comma separated list of all subsystems that you would like to have extra diagnostic information from.
Let's takeNODE_DEBUG as an example: imagine you have a deeply nested filesystem call and you have forgotten to use a callback. For example, the following example will throw an exception:
const fs = require('fs');

function deeplyNested() {
  fs.readFile('/');
}

deeplyNested();
The stack trace shows only a limited amount of detail about the exception, and it doesn’t include full information on the call site where the exception originated:
fs.js:60
    throw err;  // Forgot a callback but don't know where? Use NODE_DEBUG=fs
      ^

Error: EISDIR: illegal operation on a directory, read
    at Error (native)
Without this helpful comment, many programmers see a trace like this and blame Node.js for the unhelpful error message. But, as the comment points out, NODE_DEBUG=fs can be used to get more information on the fs module. Run this script instead:
NODE_DEBUG=fs node node-debug-example.js
Now you’ll see a more detailed trace that helps debug the issue:
fs.js:53
    throw backtrace;
        ^

Error: EISDIR: illegal operation on a directory, read
    at rethrow (fs.js:48:21)
    at maybeCallback (fs.js:66:42)
    at Object.fs.readFile (fs.js:227:18)
    at deeplyNested (node-debug-example.js:4:6)
    at Object.<anonymous> (node-debug-example.js:7:1)
    at Module._compile (module.js:435:26)
    at Object.Module._extensions..js (module.js:442:10)
    at Module.load (module.js:356:32)
    at Function.Module._load (module.js:311:12)
    at Function.Module.runMain (module.js:467:10)
Now with this information, it becomes easier to find the root cause of the problem. The problem was in our code, inside a function on a line 4 that was originally called from line 7. This makes debugging any code that uses core modules much easier, and it includes both the filesystem and network libraries such as Node’s HTTP client and server modules.
Using environment variables is a good way of debugging, without having to modify your code at all.
Handling Warnings
A few years ago, the concept of warnings was introduced into Node.js. A warning is just a message or notice that implies something that could go wrong (eg memory leak, unused variables) or something that might not work in the future (eg deprecation). Node.js logs warnings about potentially risky behaviors.
It is possible to turn the warnings off using the flag --no-warnings but this practice is not recommended. Instead you can redirect all the warning messages into a file with the flag --redirect-warnings=fileName. This is especially useful if you have a lot of warnings and don’t want to see them all in your console.
You can also use the flag --trace-warnings, which will give you the stack trace of where the warning is coming from whenever you encounter a warning.
The following is an example using buffers:

This warning is showing something that might not work in the future: a deprecation warning. It issues a recommendation to use another constructor method along with the stack trace of where that warning originated.
Handling Deprecations
Similar to warnings, there is a special class of warnings called Deprecations. These point out deprecated features that are recommended to not to be used in production because they will no longer be supported, which can cause problems.
There is also a flag that you can use to turn Deprecation warnings off; --no-deprecations. This will disable all Deprecation warnings, but is not recommended to use this flag.
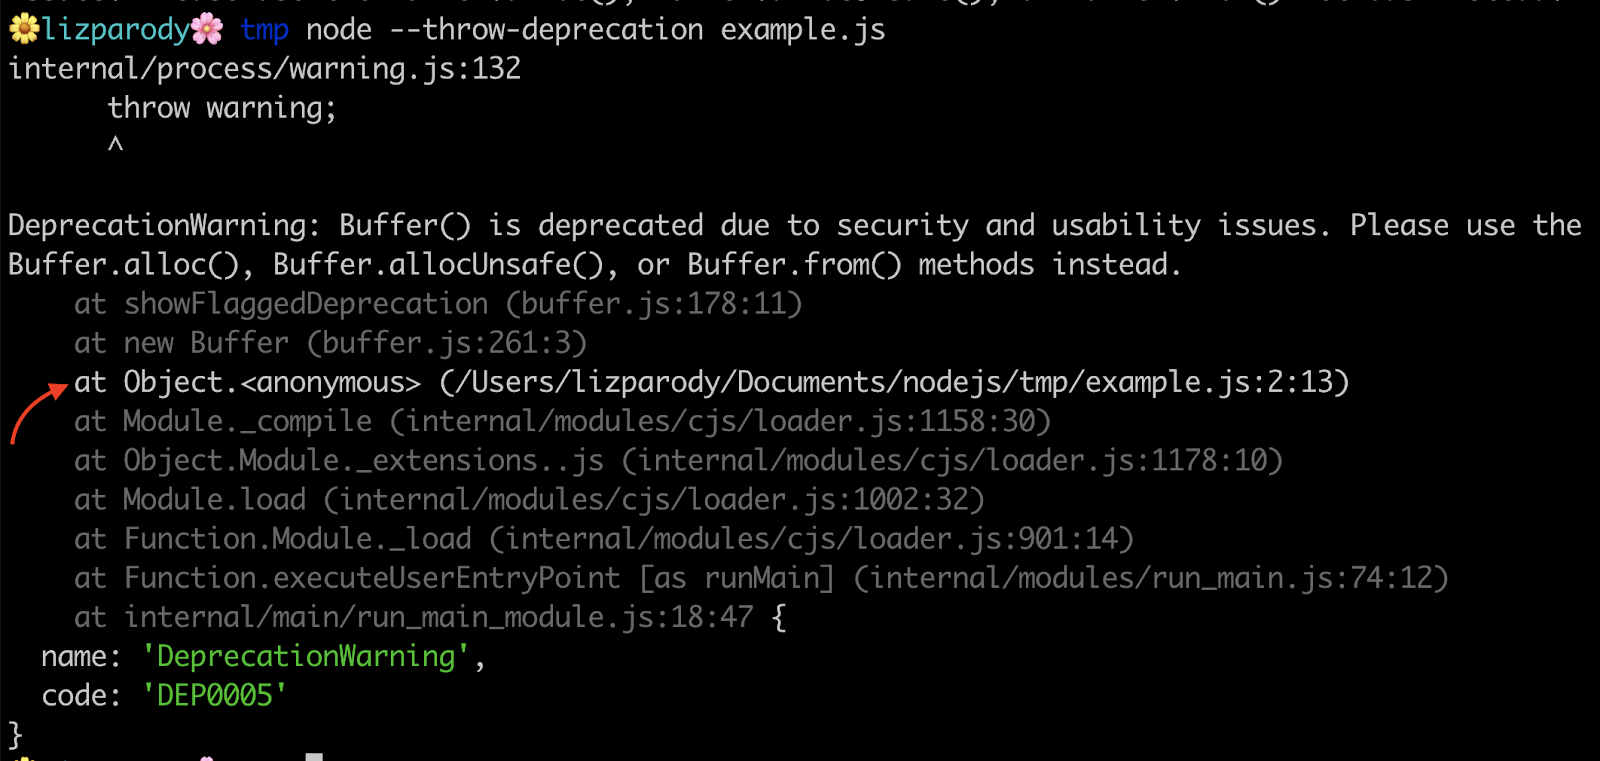
The --trace-deprecation flag works similarly to trace warnings, printing a stack trace when deprecated features are used. The --throw-deprecations flag throws an exception if and when deprecated features are used, so instead of issuing a warning it will throw an error. Its use is recommendedin development rather than in production.
Using the same example of Buffer() we can see this:

The --throw-deprecation flag shows you where the code is coming from. One cool thing about this is that the stack frames are shown in different colors. In Node.js v.12, the line with the error is in white while the rest of the stack trace is in gray, pointing to the exact part of your code that should be changed.
Identifying Synchronous I/O
One common way to introduce performance problems in your code is by using Synchronous I/O. If you are working on a server-side application, it is possible to have an initialization period when the server starts up but can’t yet listen to the server’s traffic. Once you start serving the request, it is very important to not block the event loop because that could cause the application to crash.
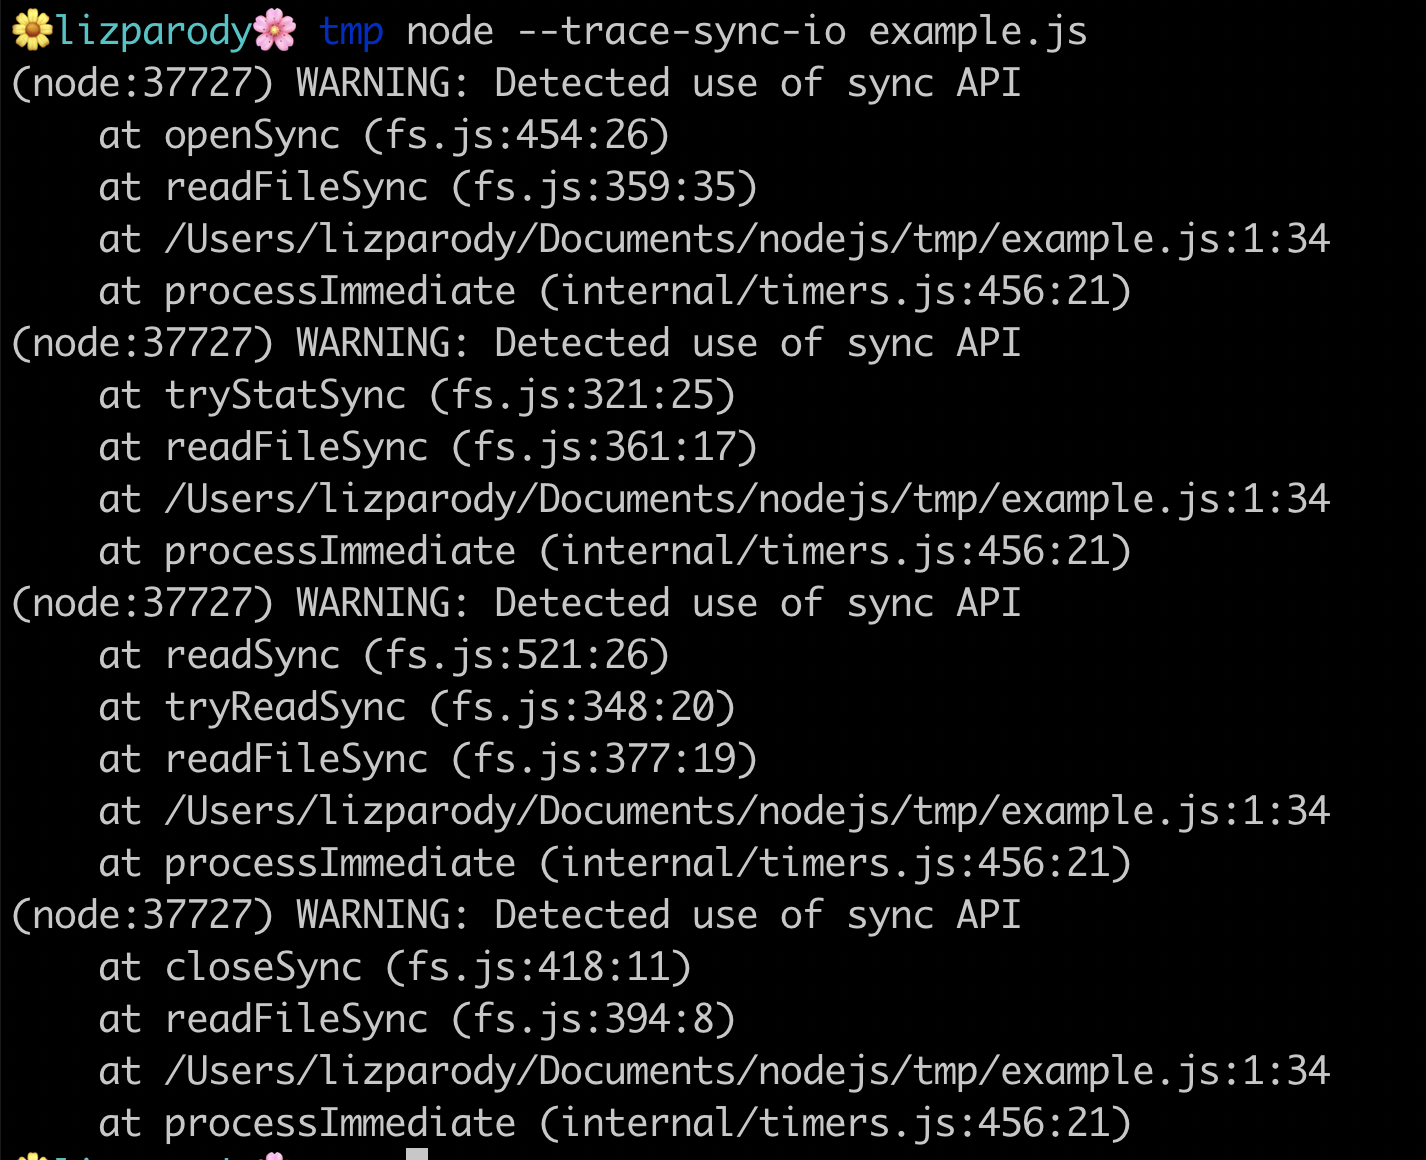
To avoid this, you can use the --trace-sync-io flag, which will show you warnings with stack traces of where you are using synchronous I/O, so you can fix it.
The following intends to provide an example: The file called example.js contains the following line of code:
setImmediate(() => require('fs').readFileSync(__filename)).
When running the file using the flag --trace-sync-io we can see this:

The example uses readFileSync, to read the file.
If setImmediate was not around it, there wouldn’t be any problem because it will read the file in the first event loop tick. But since setImmediate is being used, the file read is deferred until the next tick and that’s where synchronous I/O is happening. readFileSync not only reads the file, it opens the file, does a stack call, reads the file and then closes it. As such, having synchronous I/O operations should be avoided.
Unhandled Promise Rejections
You might have probably seen a message like this when working with promises: UnhandledPromiseRejectionWarning: Unhandled promise rejection. This error originated either by throwing inside of an async function without a catch block, or by rejecting a promise which was not handled with .catch().
A promise is a state representation of an asynchronous operation and can be in one of 3 states:
- "pending"
- "fulfilled"
- or "rejected"
A rejected promise represents an asynchronous operation that failed for some reason and is completed with .reject(). Another reason could be an exception that was thrown in an async executed code and no .catch() did handle the rejection.
A rejected promise is like an exception that bubbles up towards the application entry point and causes the root error handler to produce that output.
Unhandled Promise Rejections is a newer feature that came up in Node.js 12. Not handling promise rejections is an accepted practice in browsers, but in servers it could be problematic because it can cause memory leaks.
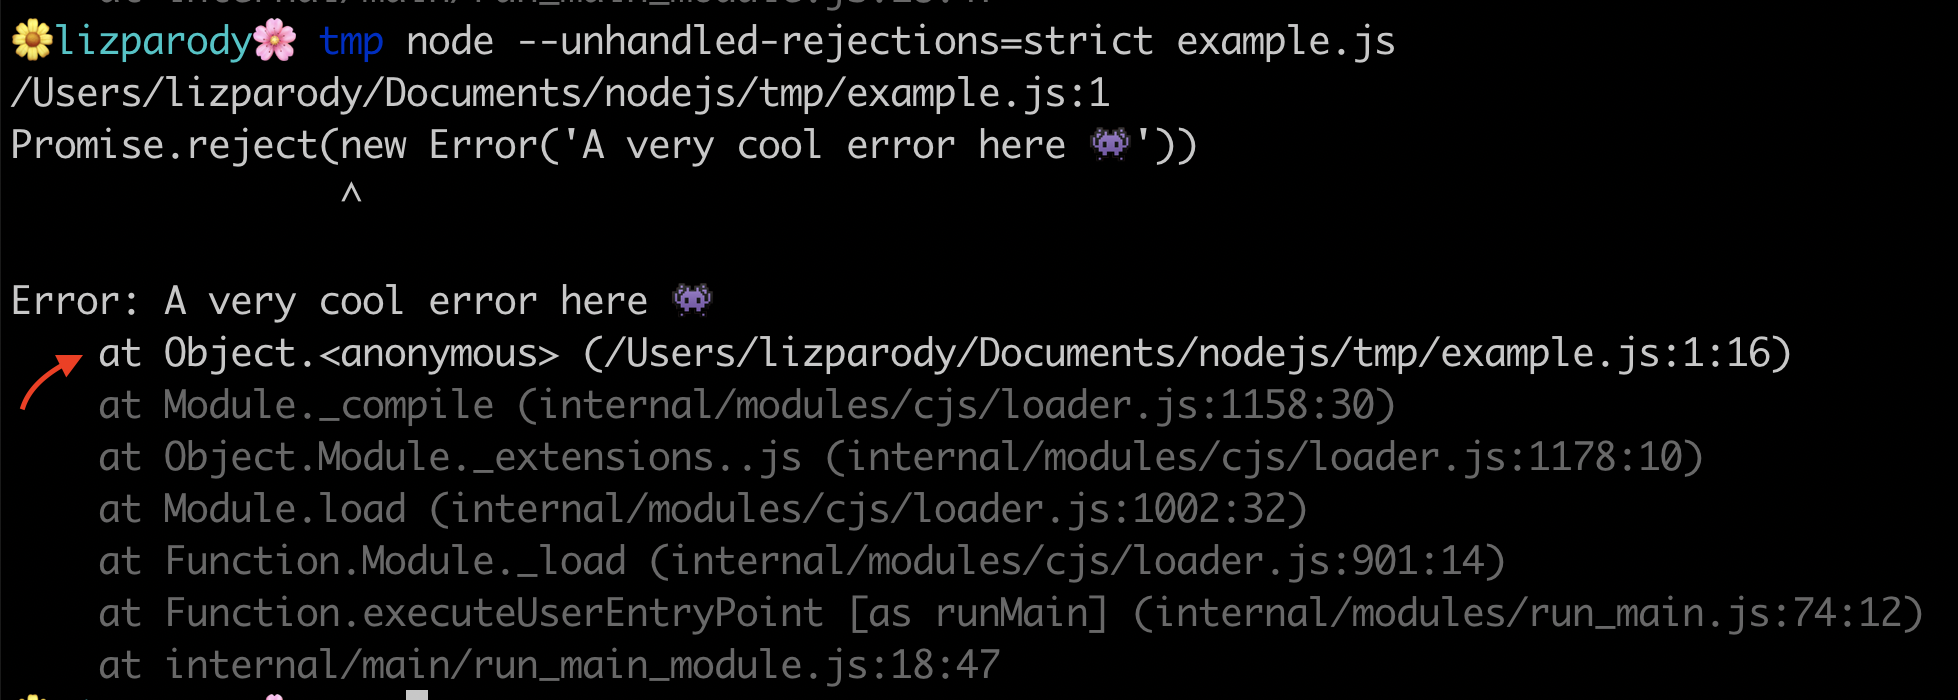
To avoid this, you can now use the flag --unhandled-rejections that has 3 modes of operations:
strictmode causes an uncaught exceptionwarnmode causes a warningnonemode swallows unhandled rejections (default standard)
In this example, Promise.reject is being called and passes a new error object. We use the flag --unhandled-rejections=strict from the command line, and this will throw an uncaught exception. A good reason to use the strict mode is because you can integrate your promises with your existing unhandled rejections workflow if you have one.

So in conclusion: we learned a little bit about the history of diagnostics in Node.js, why they are important and we analyzed five handy methods of using diagnostics in Node.js. This included useful flags, such as:
Stay tuned for part 2!
References
Testing and Debugging Node Applications
