Project & Applications Monitoring in N|Solid [1/10] The best APM for Node, layer by layer.
Enhance your Application Experience
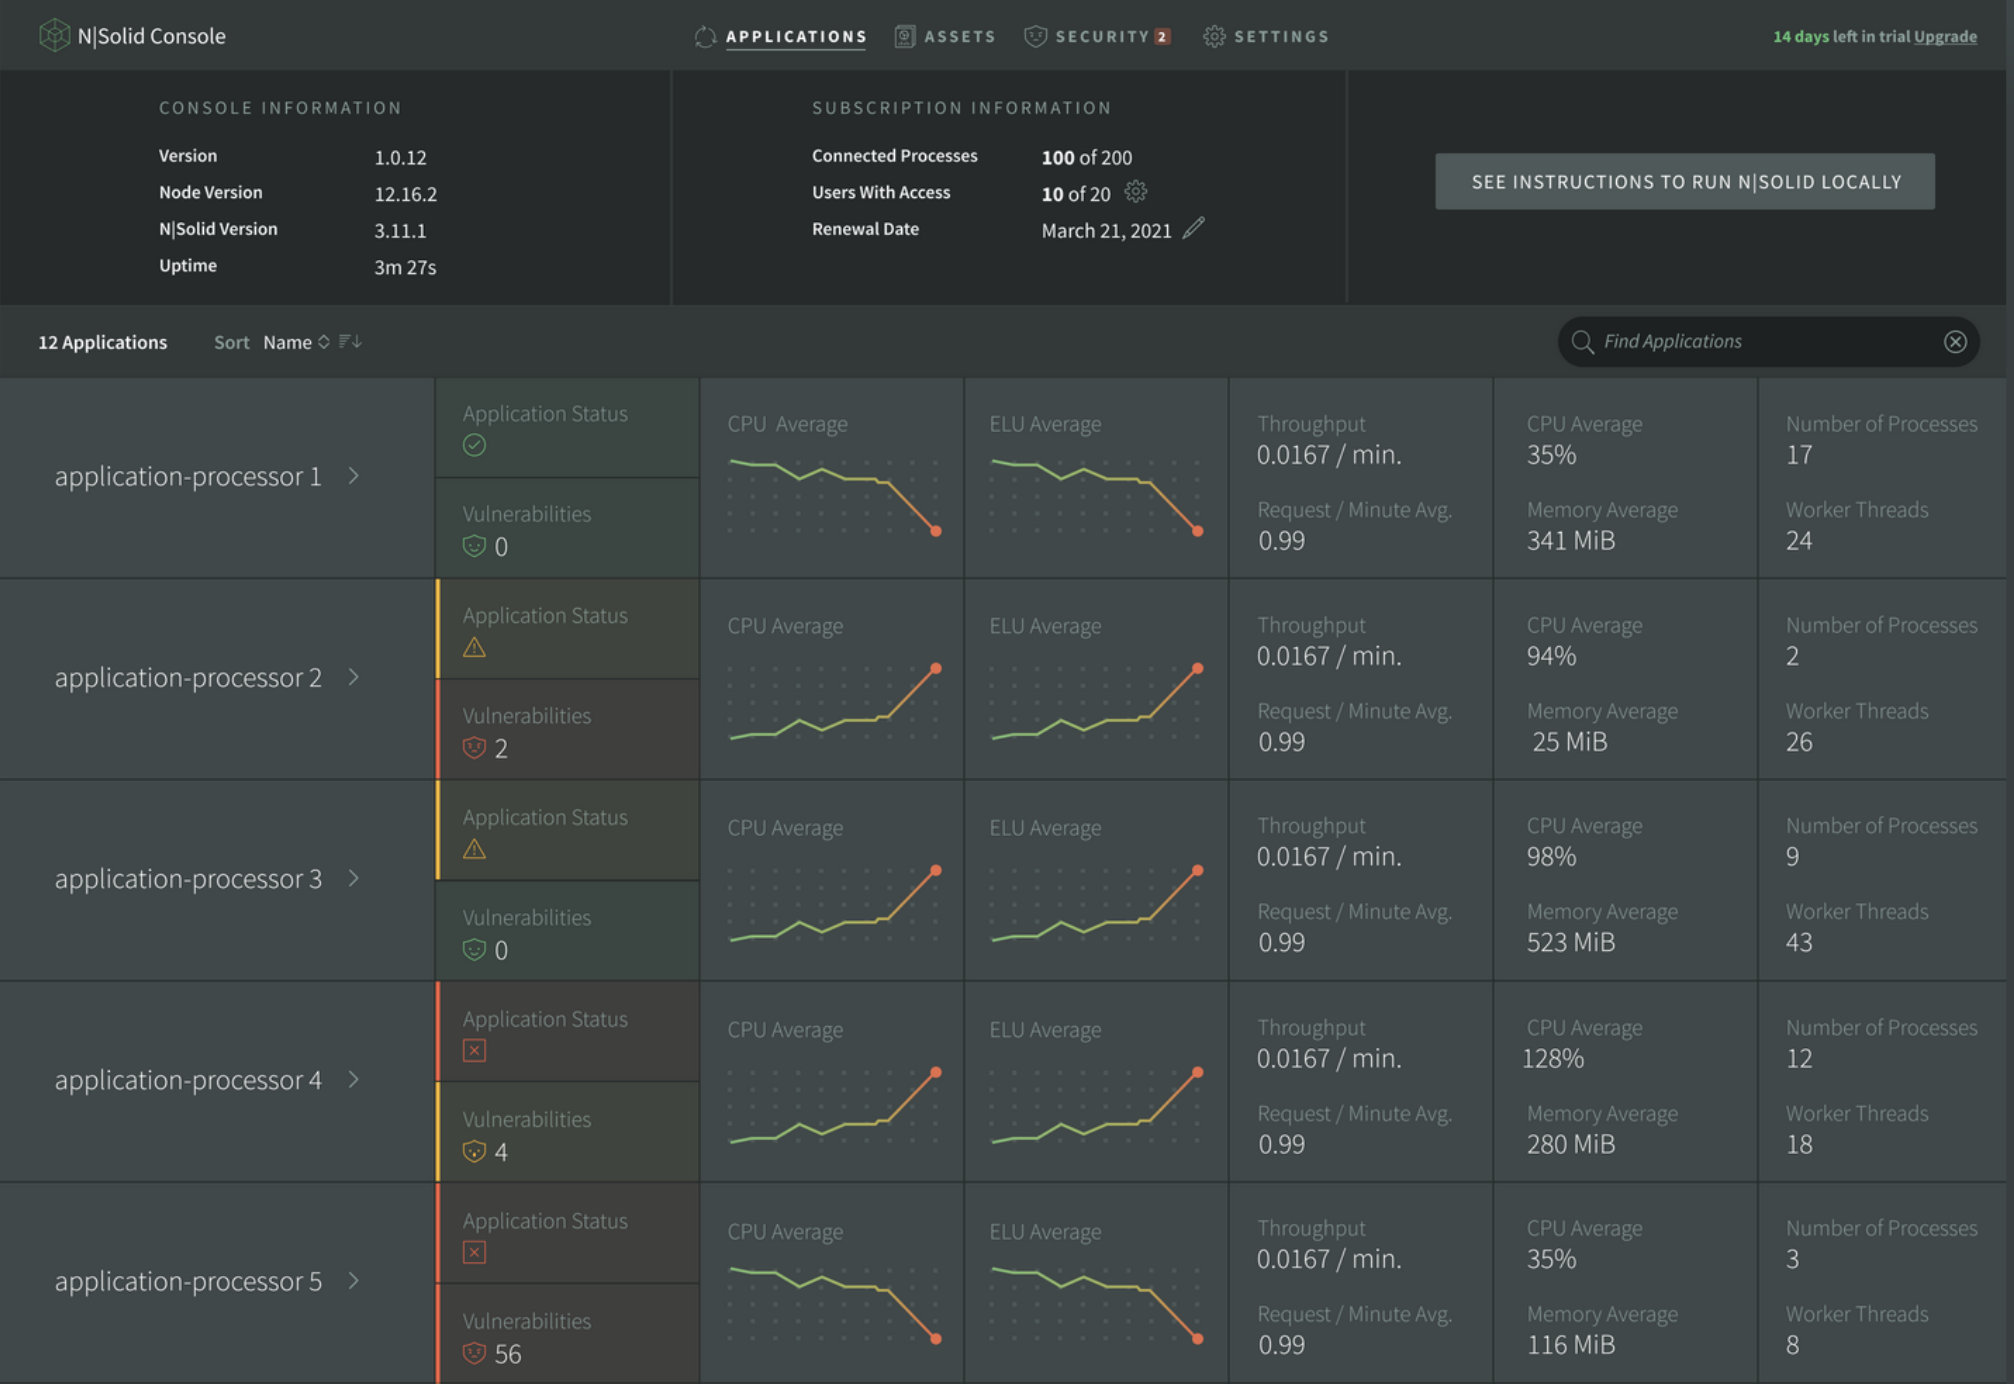
Imagine you are responsible for the health of your node applications and you have N|Solid in place, you would regularly check the N|Solid Console to review your Projects and Applications to quickly view how well things are running.
The Console provides you a visual view of application behavior and enables you to identify if there are any performance or security issues to investigate; if you set up global alerts you would receive notice when things are not running as intended, we will cover that later 😉.
 Applications Dashboard - N|Solid
In the scatter plot, we can review the heap-used and estimated event loop lag of processes. Each process is represented by different colored points. This tells us if any process is behaving poorly. You can change the view to understand many other aspects of the application including; a 5-minute load average, Active Handles, CPU Used(%), and more.
With Application Monitoring, you can track a website or any application based on Node.js. This feature allows you to collect your log data to help developers detect bugs, and processes use, track downtime and improve performance to be consistence and center in the end-user experience.
Project & Applications Monitoring —Zoom in—
 Detail Applications Dashboard - N|Solid
-
Advantage: Visually view application behavior and identify performance and security issues.
-
__Benefit: __ With this feature, you quickly see the status and issues of the applications.
Projects & Applications Monitoring lets you get more detailed and atomic information from your Node.js applications.
- See how your applications behave through a graphical summary.
- Take advantage of the power of NCM by viewing vulnerabilities filtered by applications.
- Find in one place the CPU profiles and Heap Snapshots of the application.
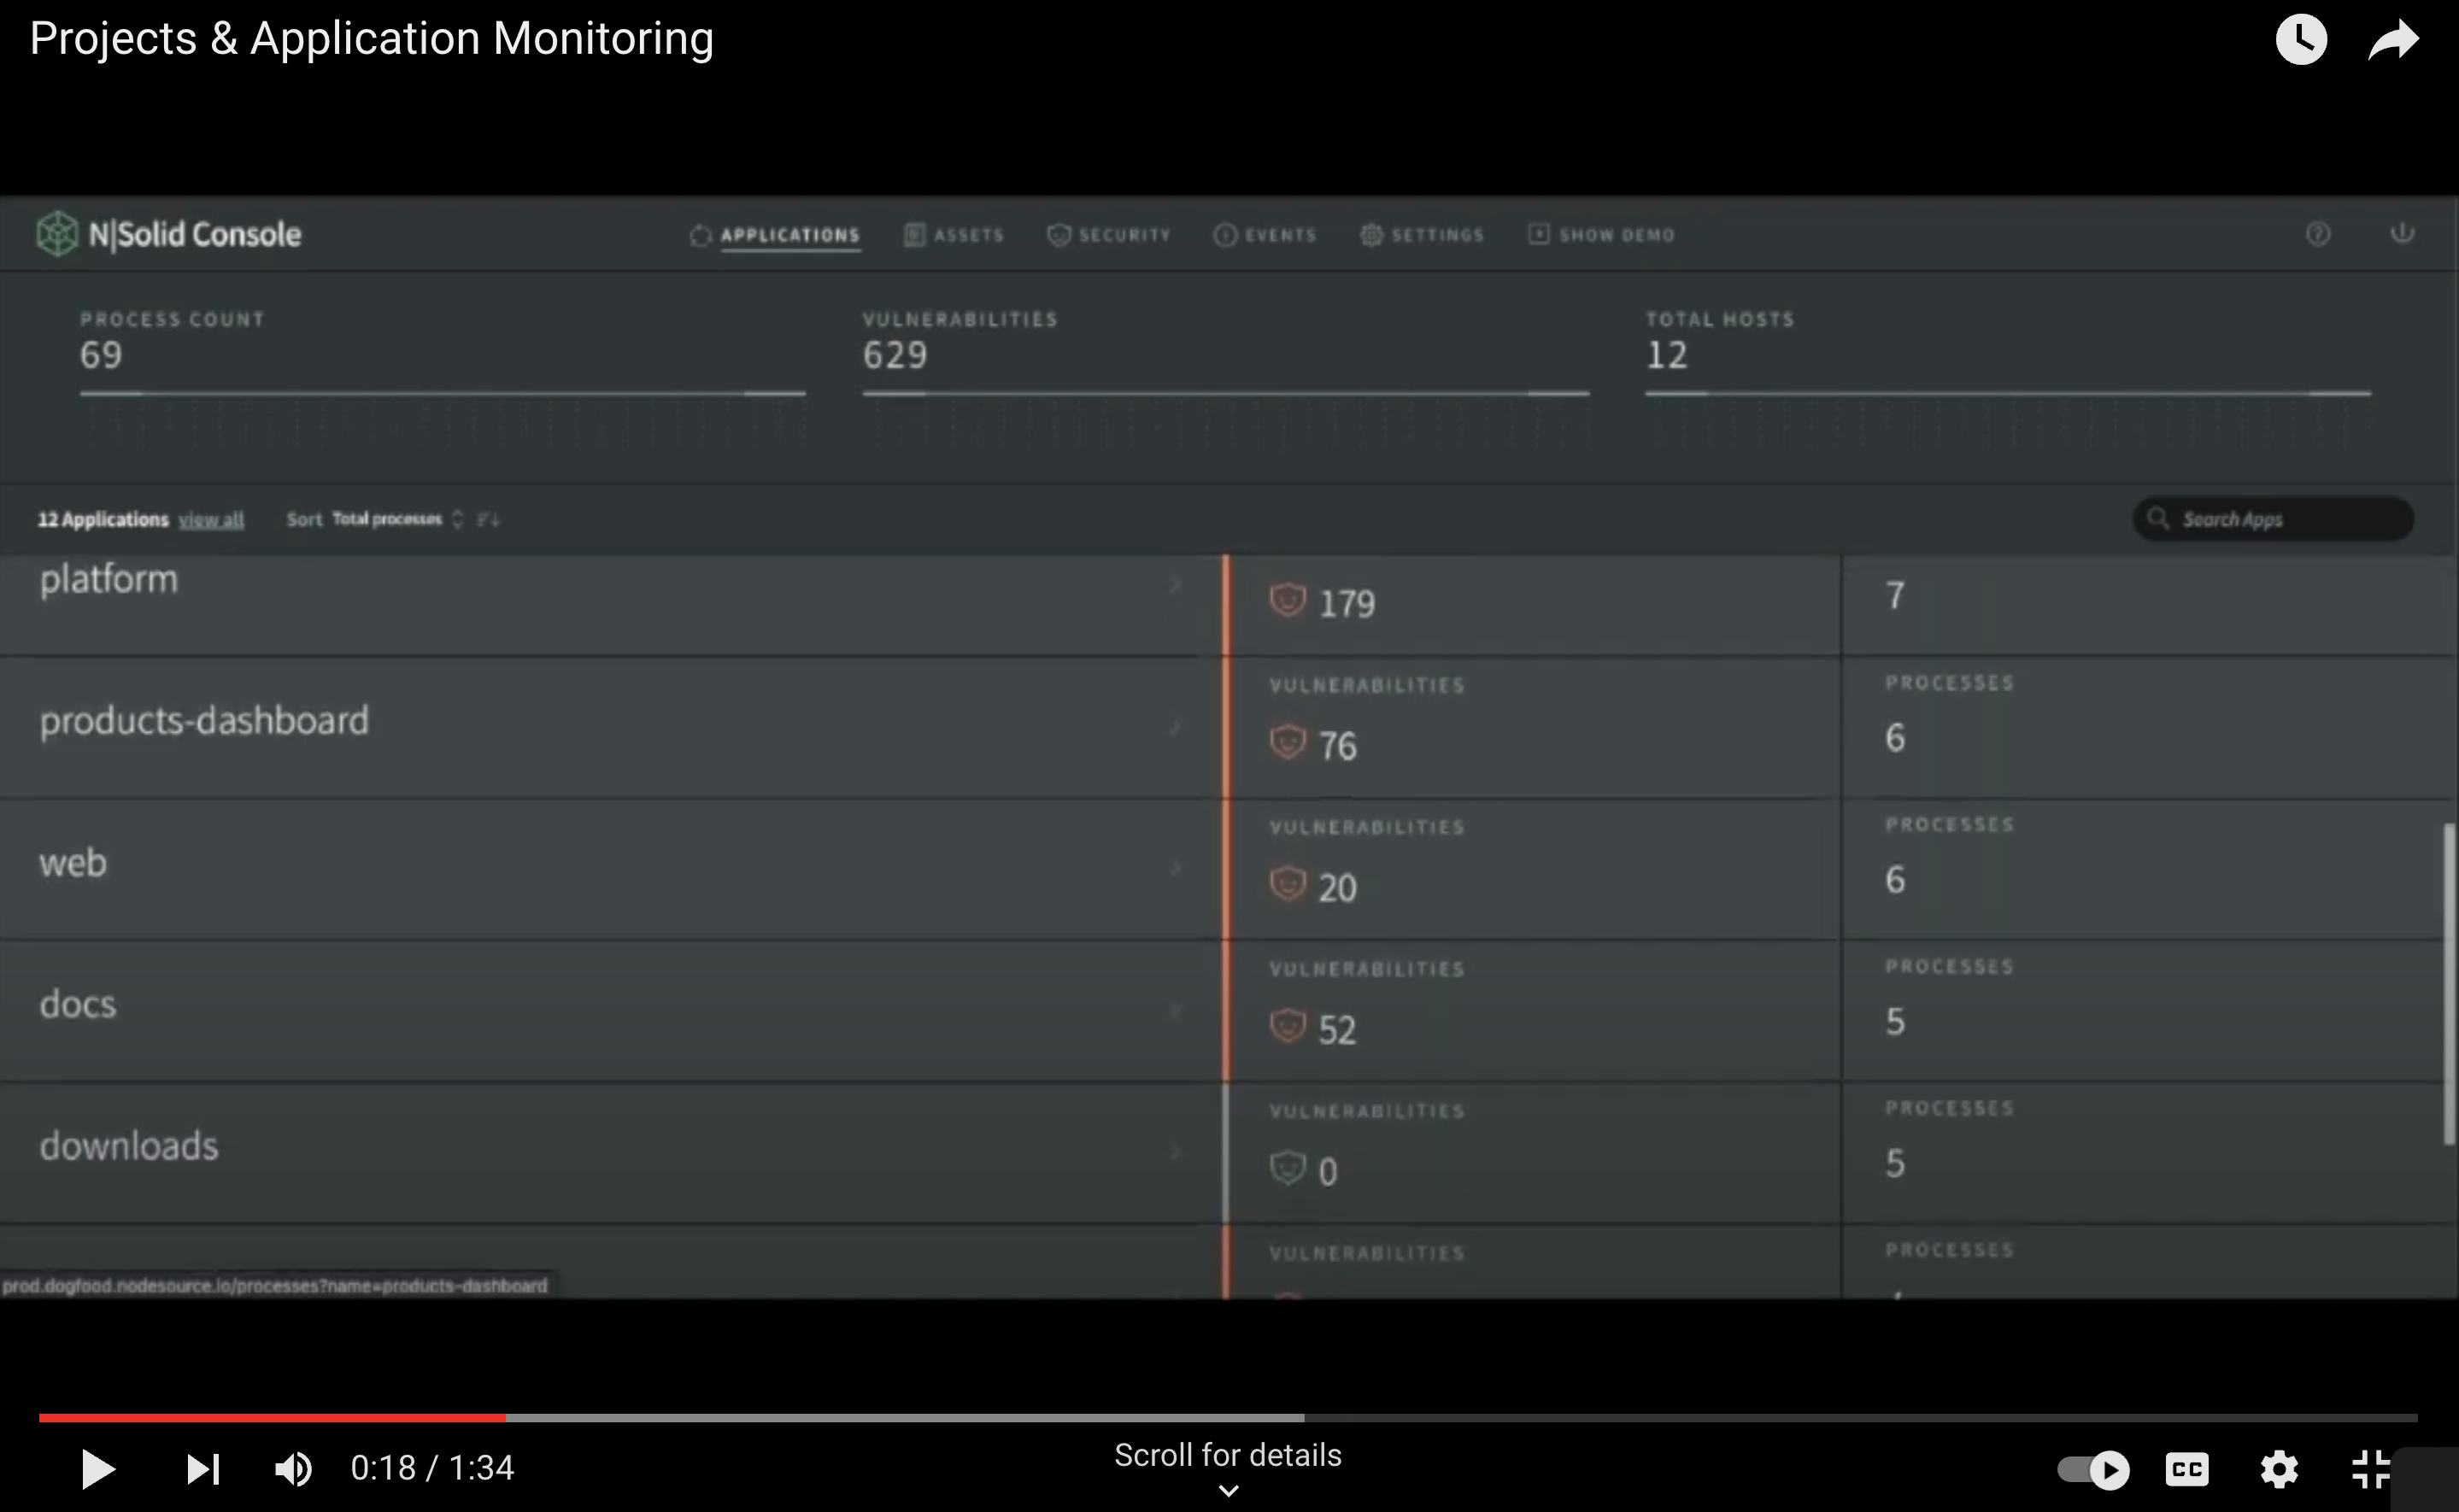
Demo Video — Project & Applications Monitoring in N|Solid
__Note: __ For a better experience, you can activate the closed captions in the video, they are available in English.
In N|Solid Console in applications, we can see the process count, the number of vulnerabilities, and the number of hosts of our application. We can search for a specific app or choose them all.
Want to try N|Solid?
Do it right now! 🏃🏿♂️🏃♀️, We release in Openjs World 2022 some codes to redeem 50% in 8 or 12 processes in our SaaS version.
50% off using:
- 8 processes OPENJS-8T
- 12 processes OPENJS-12T
Or sign up for our FREE option for 4 processes and get started with N|Solid!
To check out the top 10 features and more in N|Solid, create your account in sign up or sign in, in the top right corner of our main page. More information is available here.
