Distributed Tracing Support in N|Solid [10/10] The best APM for Node, layer by layer.
The Complexity of Distributed Architectures.
Complex modern systems are the new reality for infrastructure teams, and this is due to the evolution of Cloud Computing and working with Distributed systems, containerization, and microservices by default. The teams now have different infrastructures and virtual services with which they must take care of scalable, reliable, and performative applications.
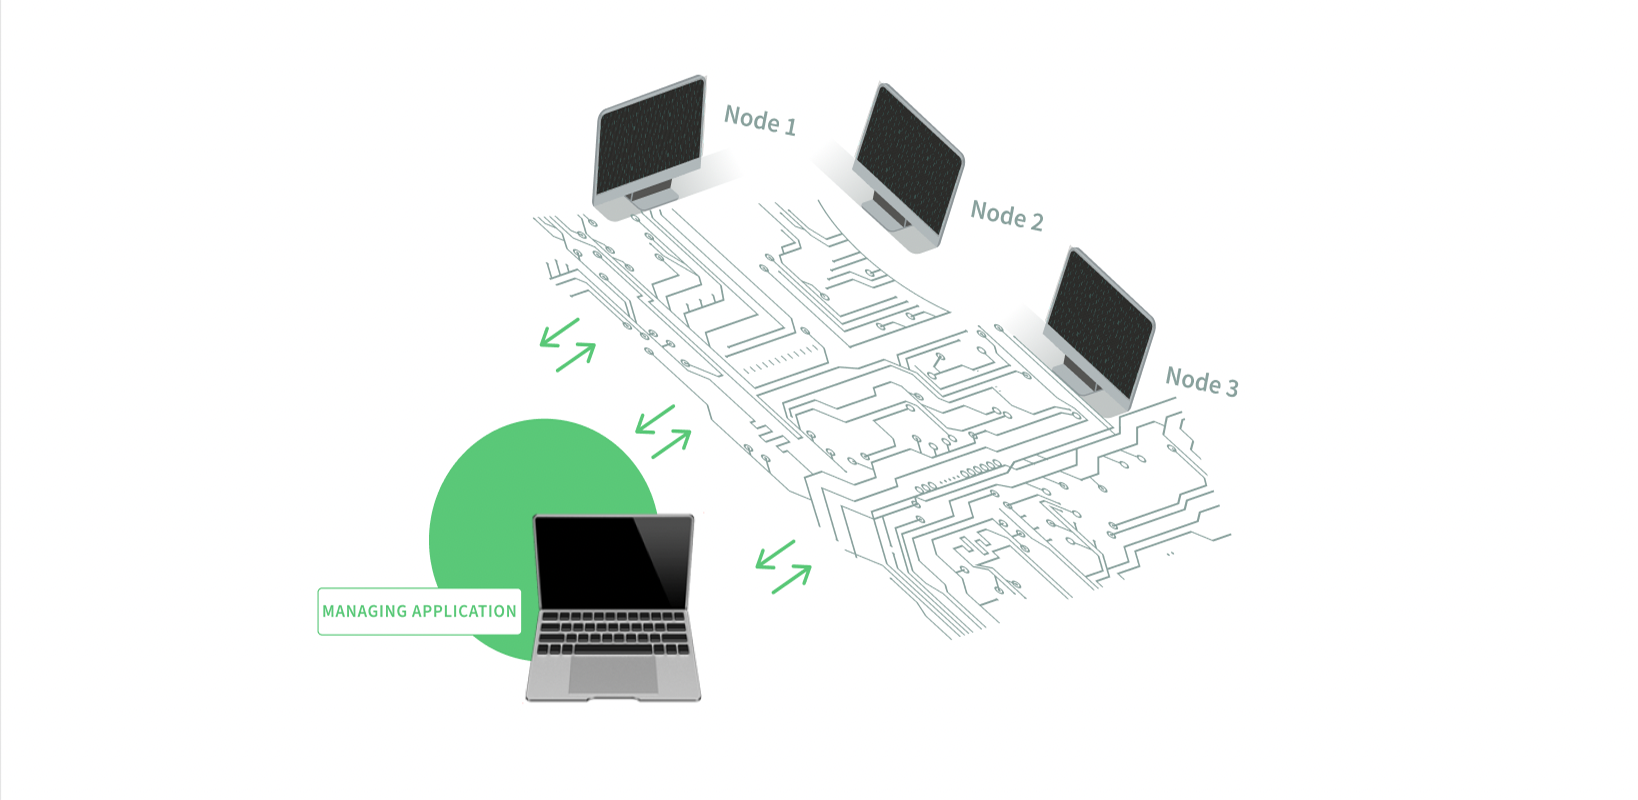
Today, a single request from a user can go through thousands of microservices, making it challenging to quickly identify the point where things started to go wrong. For this reason, it is necessary to have an observability platform, which allows us to have a centralized view to inspect how requests are performing across services.
Before jumping into our definition of Distributed Tracing, let's define a core concept. __What is a "Distributed system"? __
We're going to use the "Splunk" definition:
"A distributed system is a computing environment in which various components are spread across multiple computers (or other computing devices) on a network. These devices split up the work, coordinating their efforts to complete the job more efficiently than if a single device had been responsible for the task." Splunk
So in this same line, we can say that Distributed tracing is: __A method for tracking requests to get the whole panorama of your application deployed on distributed systems. __
Distributed Tracing is crucial to better understand the factors that affect an application's latency.
“Since modern applications are developed using different programming languages and frameworks, they must support a wide range of mobile and web clients, so to be effective at measuring latency, we need to follow concurrent and asynchronous calls from the end-user web and mobile clients all the way down to servers and back, through microservices and serverless functions.” Lightstep
Distributed tracing is a core component of Observability mainly used by site reliability engineers (SREs) but also by developers and is recommended in that way to obtain the greatest benefits as a team in charge of modern distributed software.
As your system scales, you'll need to add tracing and refine sampling capabilities, which means getting the context to understand the complexity of distributed architectures.
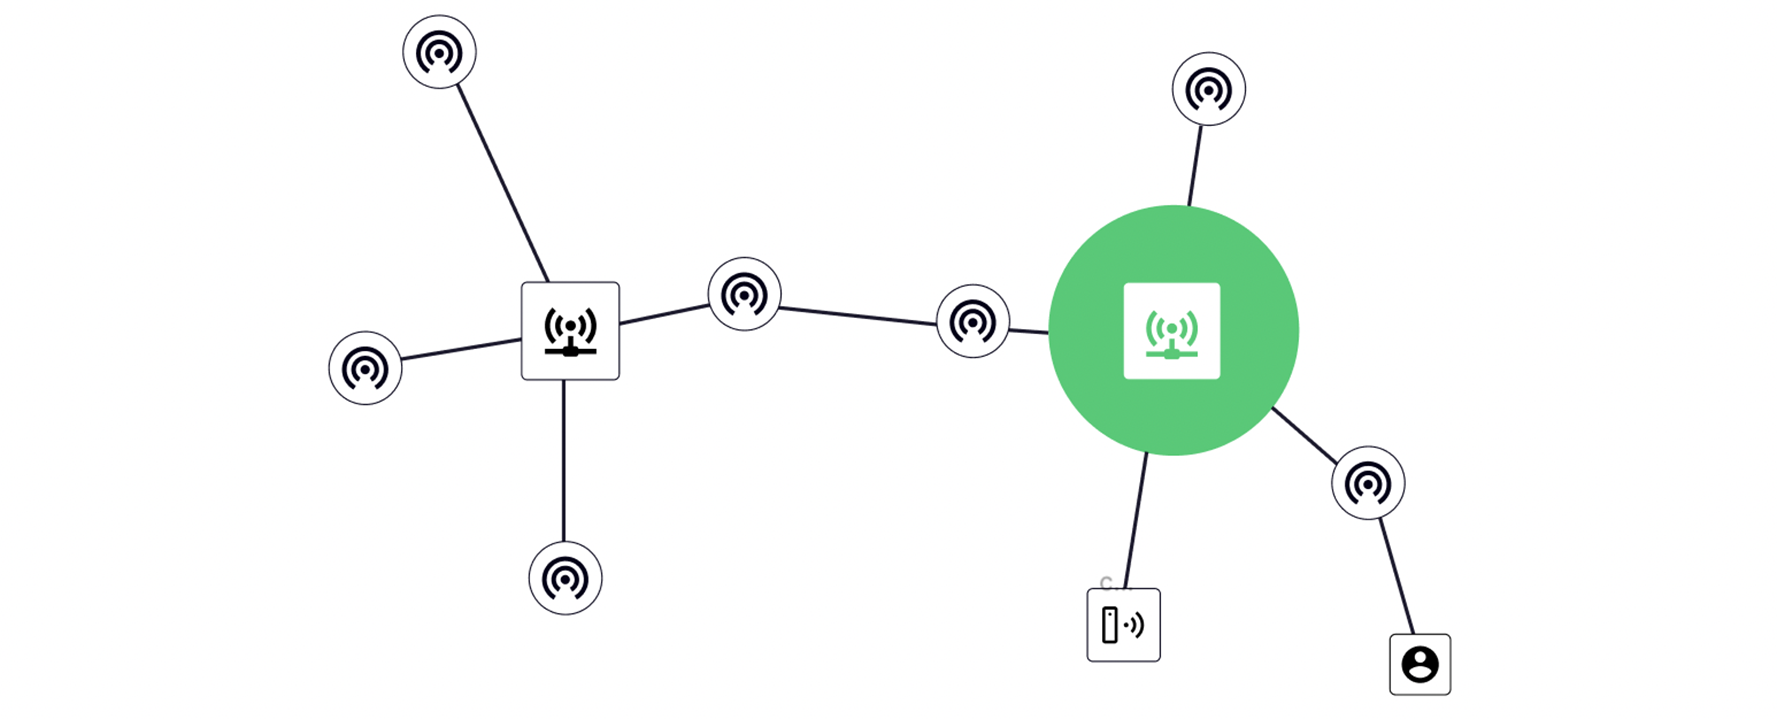
Distributed tracing provides several solutions, which include:
- Monitoring system health
- Latency trend and outliers
- Control flow graph
- Asynchronous process visualization
- Debugging microservices
Being 'debugging' is the most difficult to achieve according to complexity. Sometimes a quick diagnosis is only possible by visualizing trace data.
In this scenario, traditional tools become obsolete because the metrics collected from a single instance will not give us insights into how a user request performed as it touches multiple components. Still, we can have powerful insights if we manage it with distributed tracing.
Understanding Distributed Tracing
To understand how the different components interact to complete the user request. You first need to identify the data points that Distributed Tracing captures about a user request. These would be:
- The time is taken to traverse each component in a distributed system.
- The sequential flow of the request from its start to its end.
But before we go any further, let's talk about key concepts in Distributed Tracing:
- Request: This is how applications, microservices, and functions talk to one another.
- Trace: Represents an end-to-end user request composed of single or multiple spans.
- Span: Tagged time interval. It represents a logical unit of work in completing a process in a user request.
- A root span is the first span in a trace.
- A child span is a subsequent span, which can be nested.
- Duration or Latency: Each span takes time to complete its process. Latency is a synonym for a delay.
- Tags: Metadata to help contextualize a span.
__NOTE: __ We have tags associated with each process, and each process has a unique id in N|Solid. The processes messages with the spans that arrive at the console came with this unique ID, so when the ID is passed, we know the origination process (datacenter, network, availability zone, host or instance, container).
Explain Tracing Standards in N|Solid
In N|Solid 4.8.0, we announce the support of Distributed Tracing for multiple applications sharing requests and/or microservices architectures in our product.
In N|Solid Console now, you can find a new section to gather information throughout the lifecycle of an HTTP/DNS/Other request traversing multiple Node.js applications, providing a comprehensive overview of the communication between multiple services.
Before we go deeper through the console, we should talk about N|Solid runtime, which had built-in support for something called "HTTP Tracing" for a while now; it follows the "Open Telemetry Protocol"(OTEL). More specifically, N|Solid runtime relies on the OTEL Traces concept to monitor the HTTP operations handled/dispatched inside a Node.js application.
Let's use OTEL's Tracing definition to make this straightforward:
- Tracing in OpenTelemetry: Traces give us the big picture of what happens when a user or an application makes a request. OpenTelemetry allows us to implement Observability into our code in production by tracing our microservices and related applications.
It uses the next JSON schema:
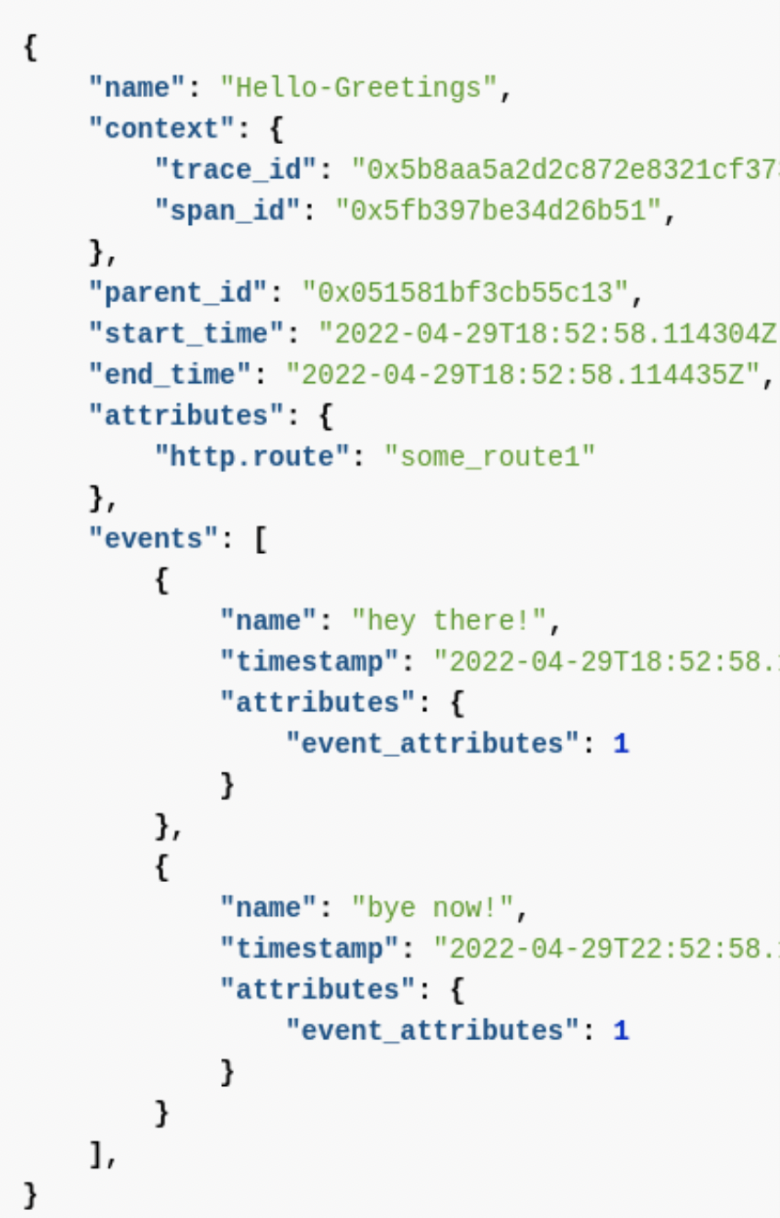
Using standards like OTEL allowed N|Solid runtime to make it more compatible with different APMs.
A use case of this functionality occurred when one of the largest airlines in the USA (‘The client’) used one of the renowned APMs, one of the tops from Gartner's magic quadrant, and they evidenced through NSolid that when using HTTP Tracing, The other APM performance hit on was overkill on their application. Still, they became excited about having both cuz' It was no extra money, and they could still jump from one to one for visualizations. — NodeSource Services
Now we know what a trace is and how N|Solid runtime uses them for the console or another back-end (like another APM), it's time to jump into distributed tracing in N|Solid console.
Distributed tracing in the N|Solid console by @juanarbol
Distributed tracing in the N|Solid console is an extension of HTTP tracing in N|Solid, but now; you could make that cover your distributed system, too <3
Now it's time to cover how things work on the console side; before that, let's assume the following sentences as true:
- A fake "console" node.js app supports login with Google
- Google auth is using N|Solid (crossing fingers 🤞)
- Google auth supports 2FA (if you don't have 2FA enabled, please do it… like now…)
- The Google auth uses Twilio (which uses N|Solid -crossing fingers again 🤞-) to send the SMS messages.
- We control this whole distributed system.
__How to see the distributed tracing view in the console: __
Click on "Distributed tracing" in the navbar

The view will be something like the "HTTP tracing" view.
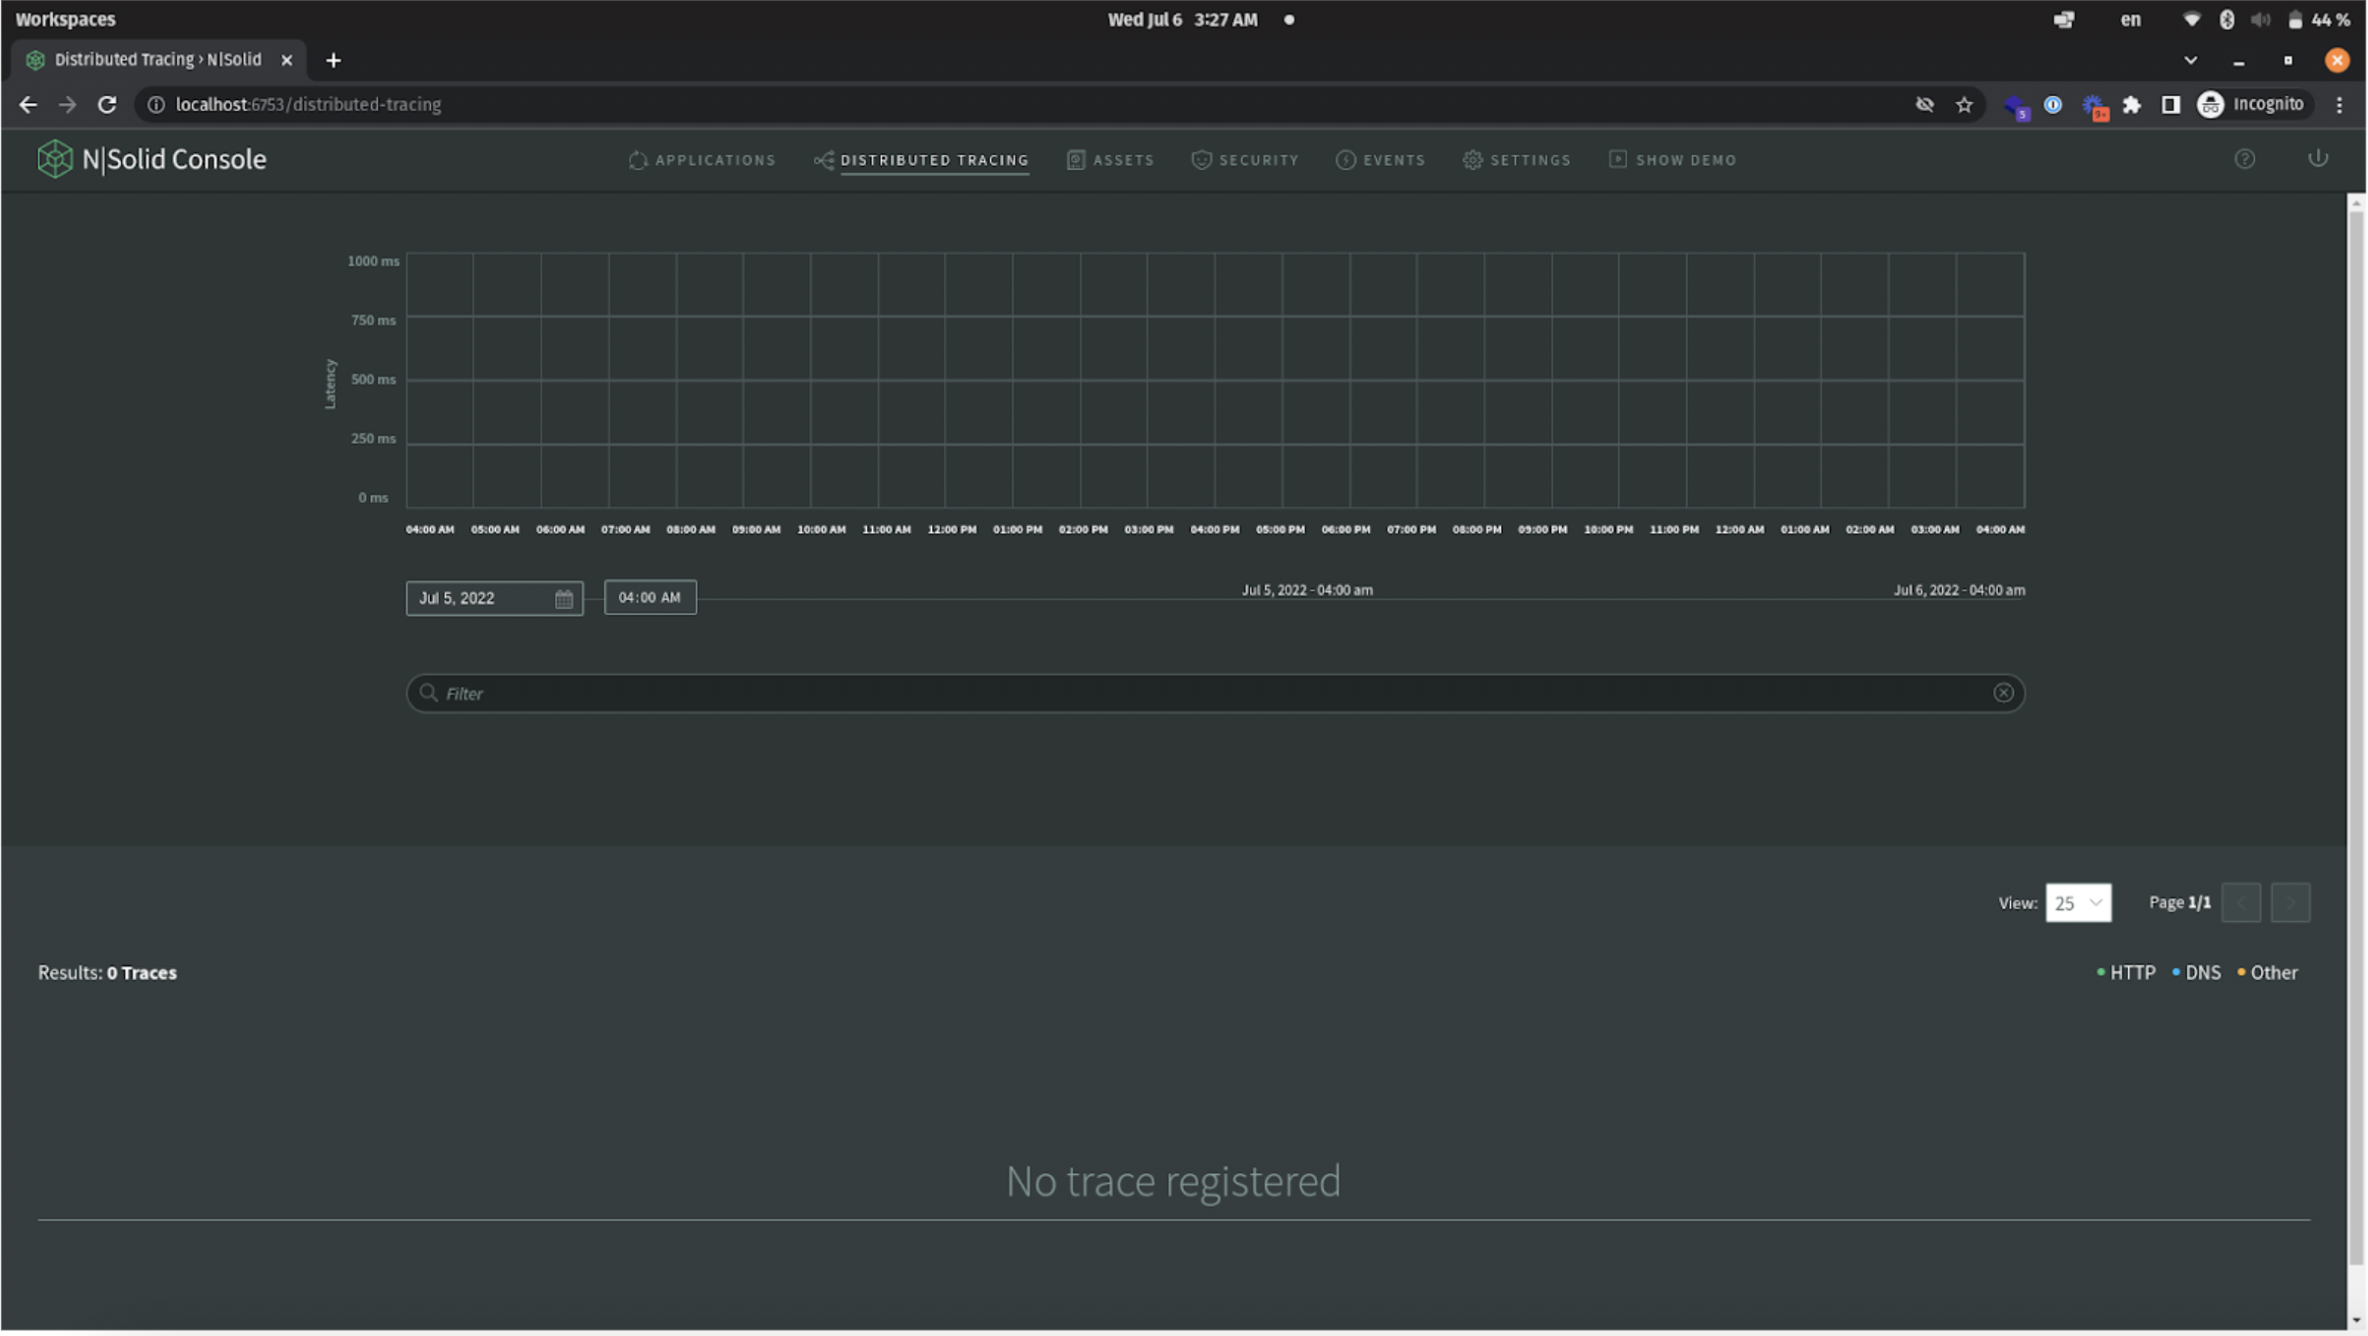
Now is time to monitor traces; I will make a simple request to the "console" service:
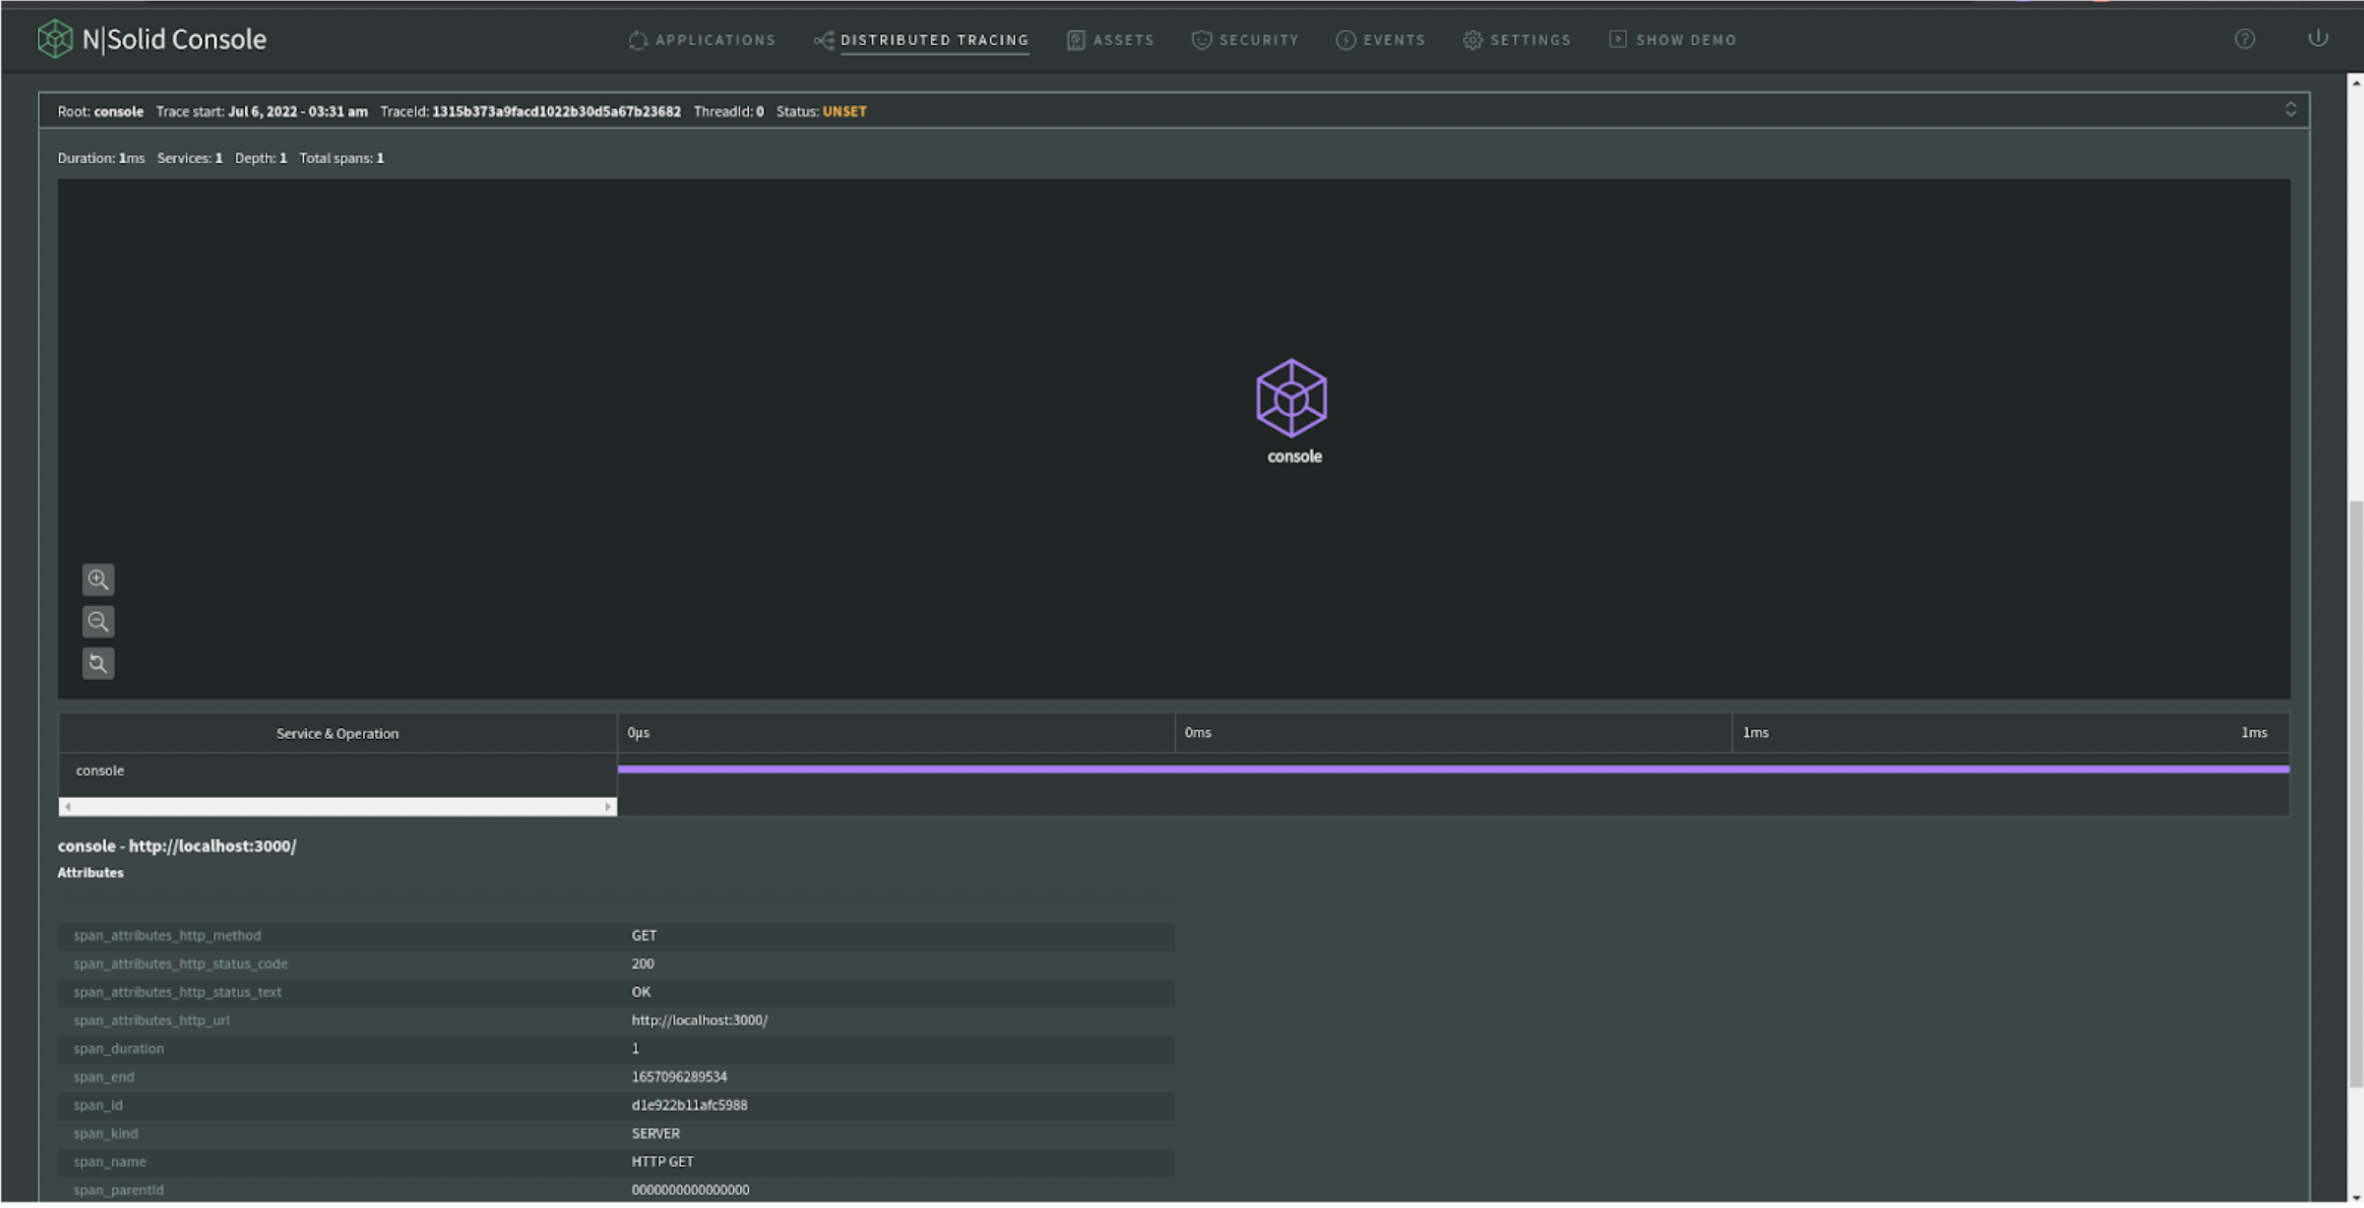
There we go; we get the whole "span" information.
Now is time to authenticate using the console service, which is going to perform a request to the "google-auth-service" to, you know, log in with google, basically.
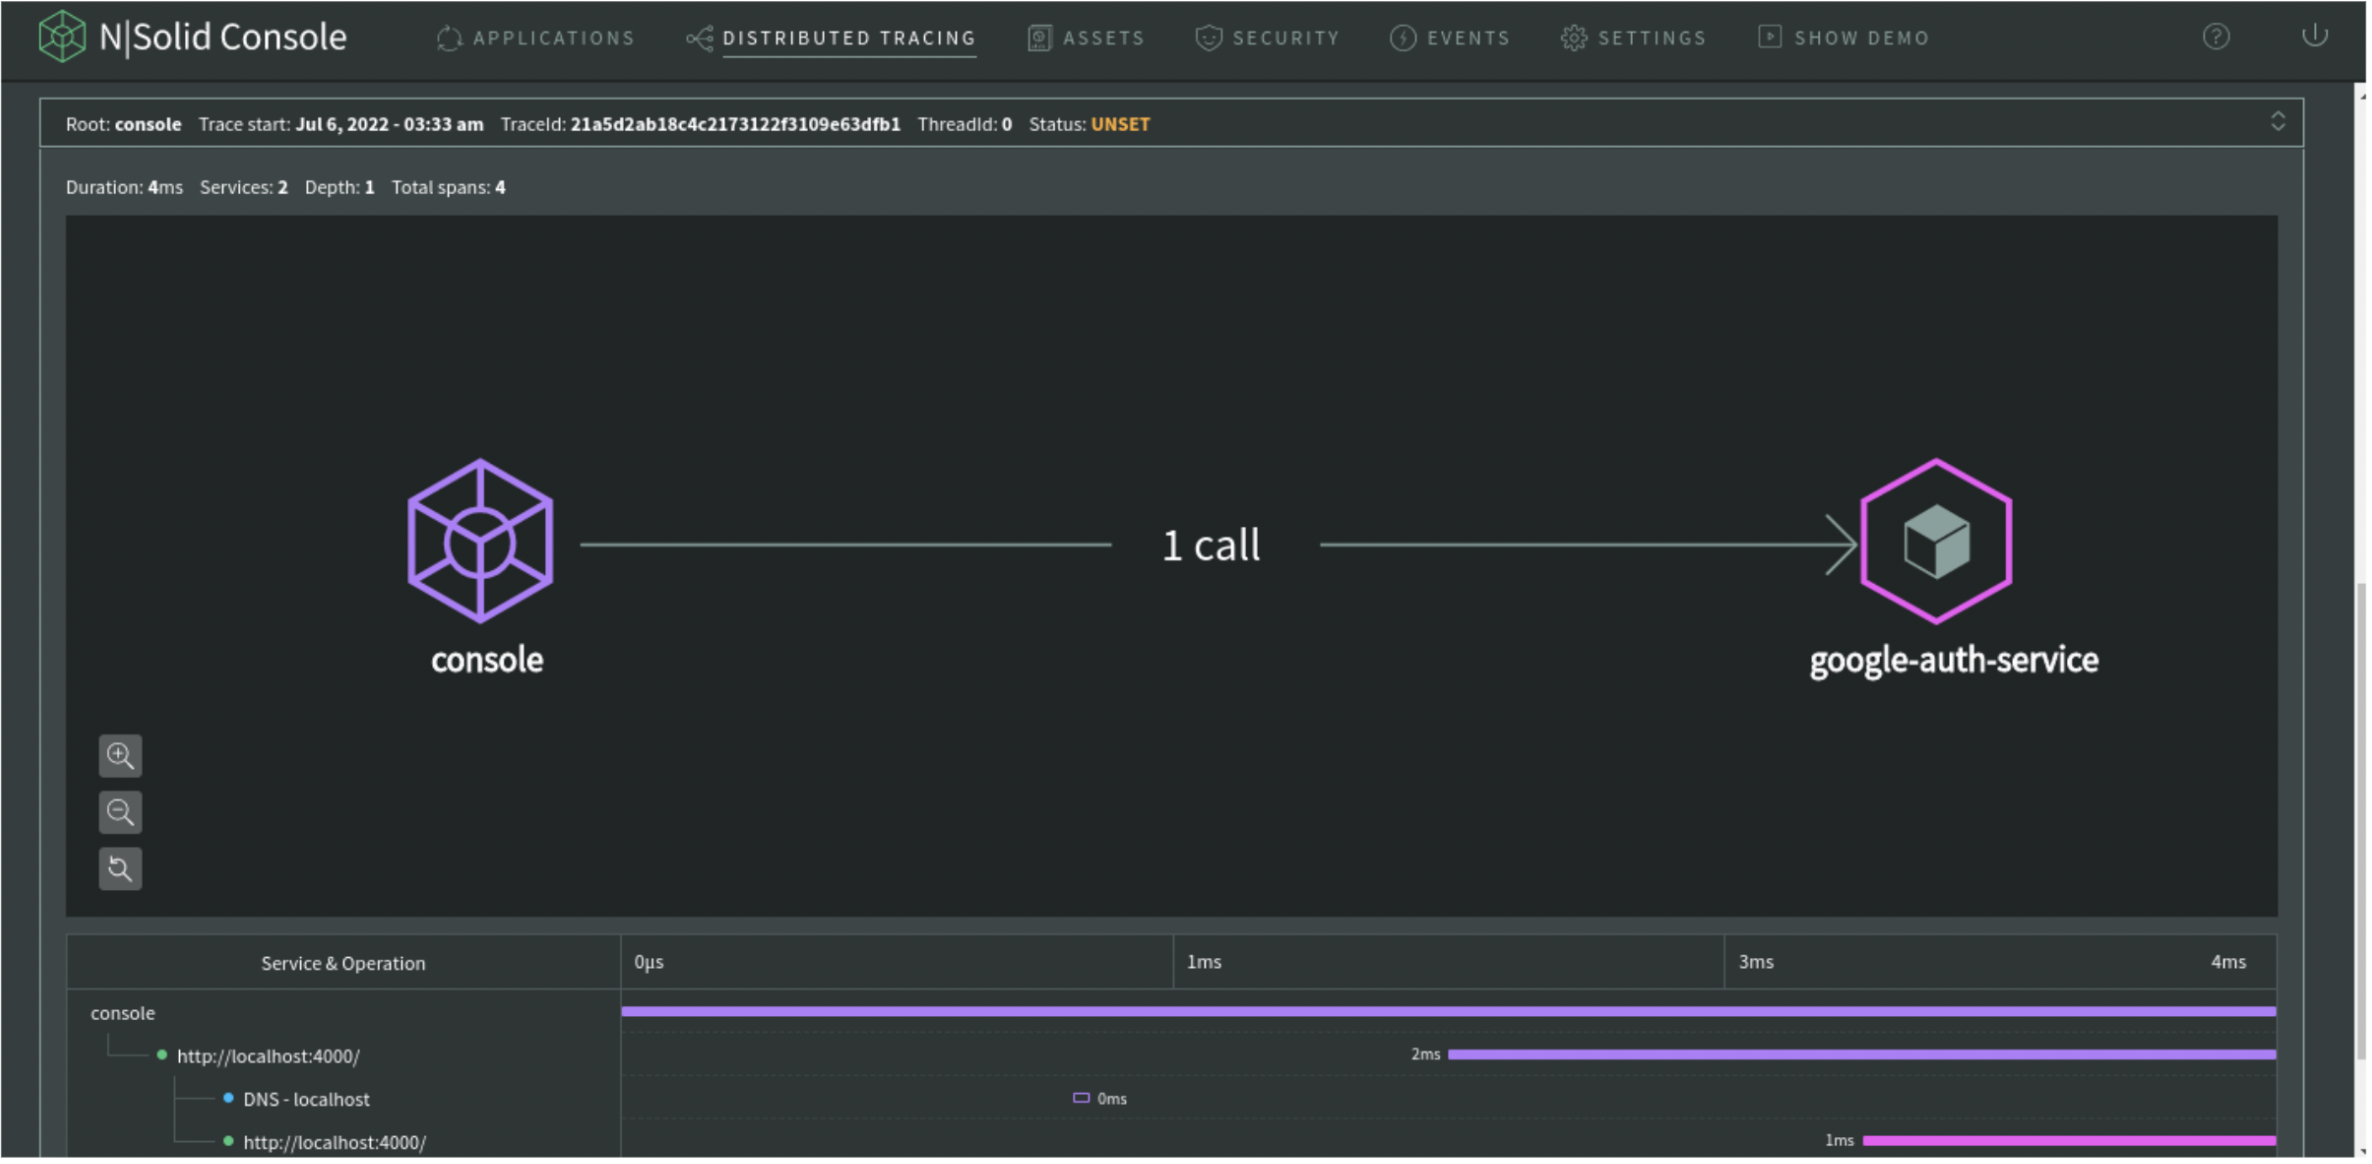
Now the graph is showing me a "path" from the console service to the google auth service, N|Solid is monitoring HTTP traces in a distributed system; well, it is time to use 2FA, so… we expect to have an extra span from "google-auth-service" to "Twilio" service.
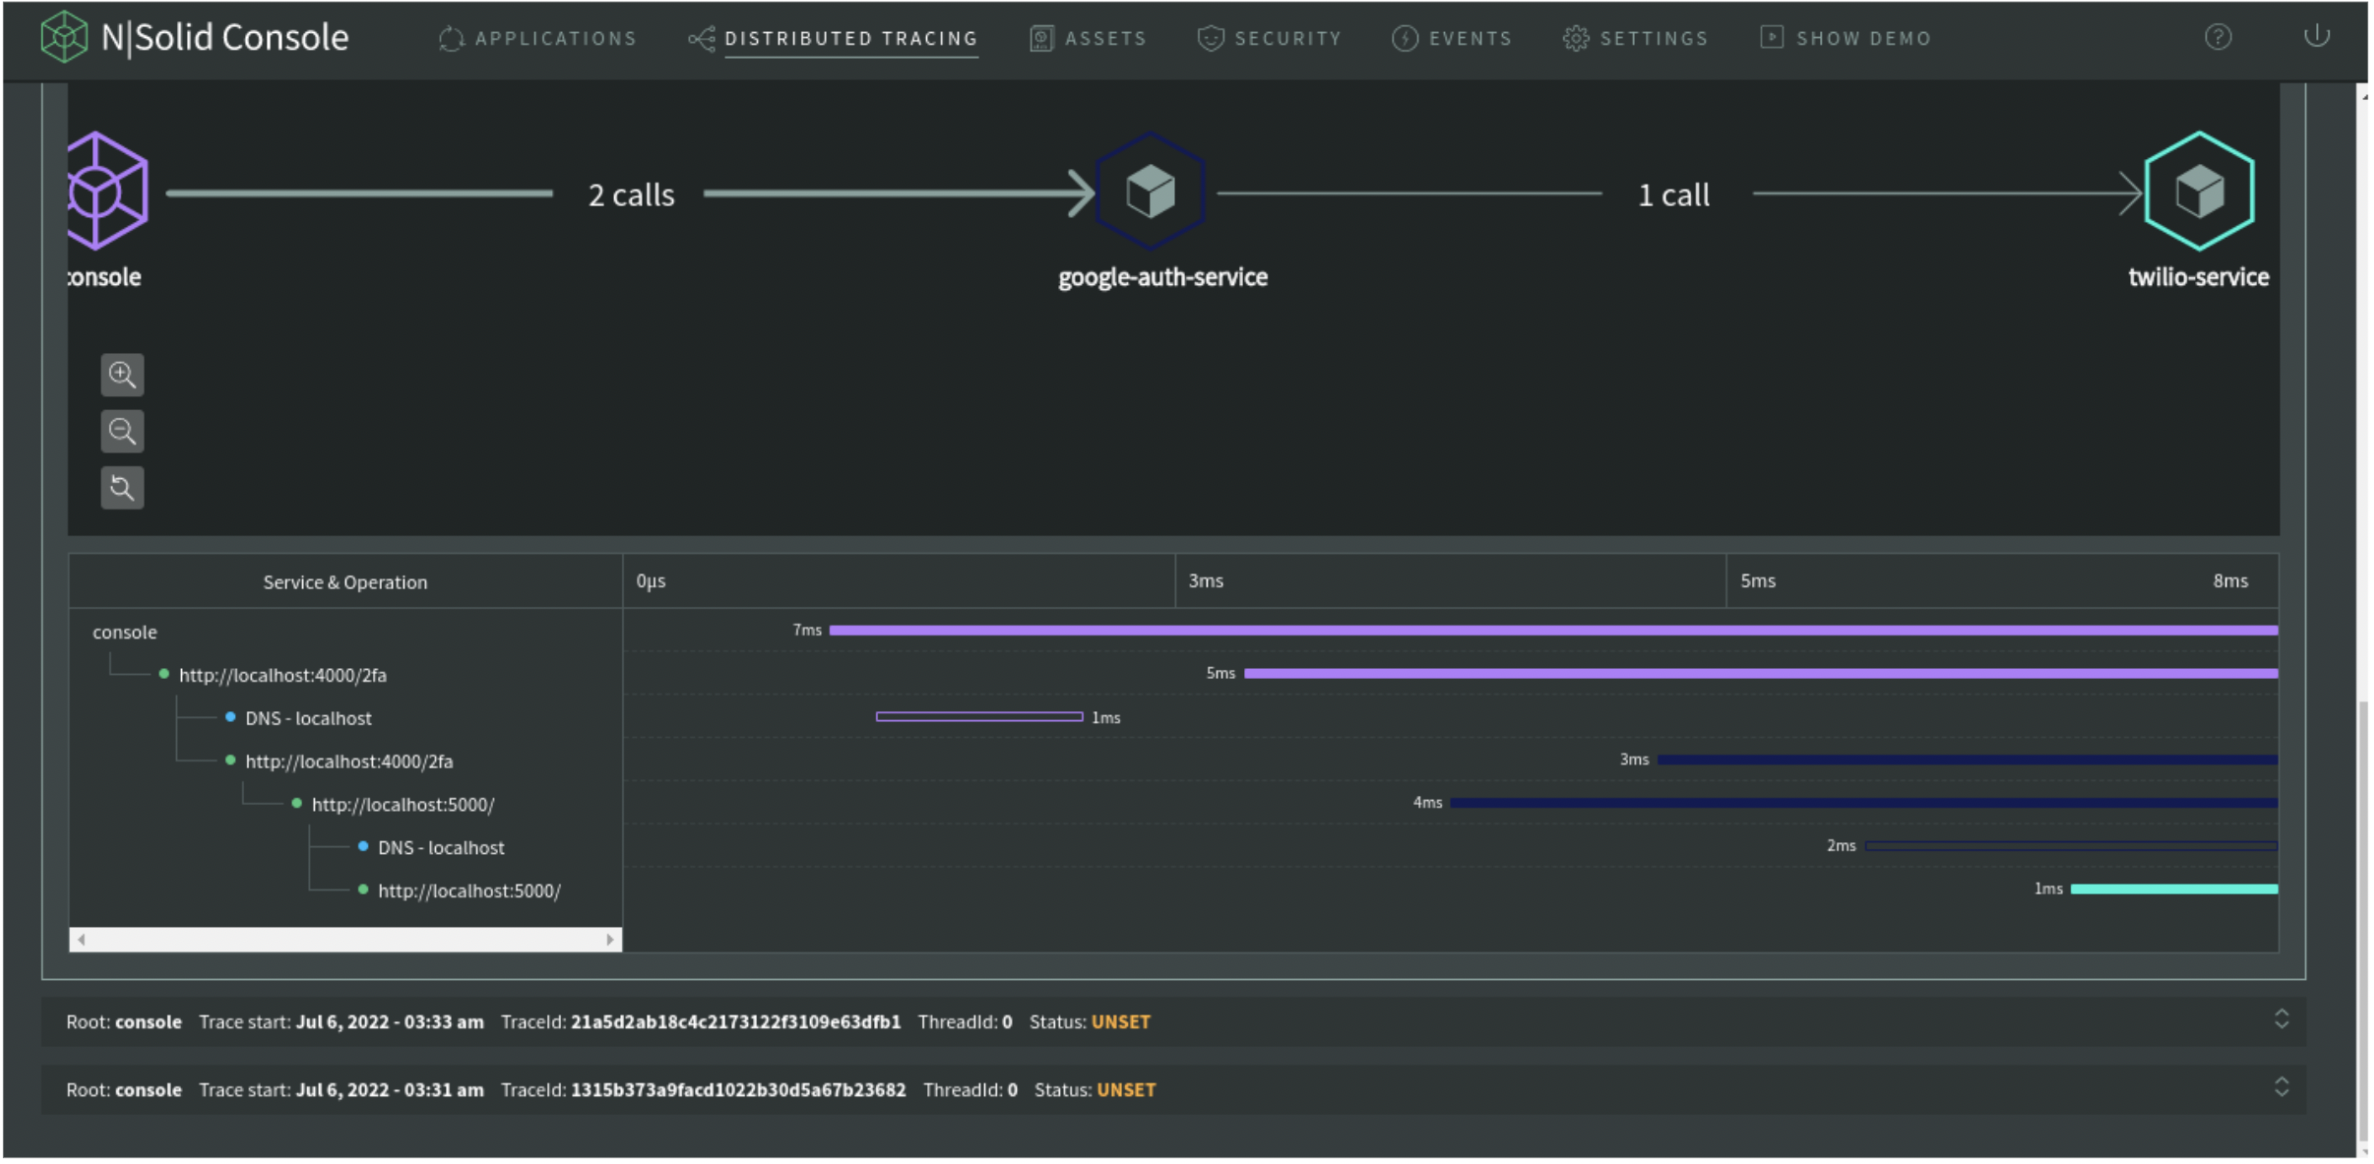
There we go. The graph shows the whole "path," starting from the console and finishing with Twilio. This is how distributed tracing works using N|Solid managed systems.
The collected information can be used for debugging latency issues, service monitoring, and more. This is a valuable addition to users for those interested in debugging a request latency. Tracing traces of user requests through multiple Node applications and collecting data can help find the cause of latency issues, errors, and other problems in your distributed system.
NOTE: This is all the code used to simulate these whole systems.
- Doing a request to "console" will be a single instance service.
- Doing a request to "console/auth" will be a request from the console going to "google auth".
- Doing a request to "console/auth-2fa" will be a request from the console to google Twilio.
Analytical data falls short without context
Distributed Tracing allows us to explore and generate valuable insights about these traces to put them in the right context for the issues being investigated.
To achieve this level of depth in the engineering department, it is important to keep in mind:
- Aggregate trace data analysis on a global scale.
- Understanding historical performance.
- The ability to segment spans.
From a business standpoint, companies using microservices can find these benefits by implementing Distributed Tracing on their teams:
- Analyze the traces generated by an affected service to quickly troubleshoot the problem.
- Understand cause-and-effect relationships between services and optimize their performance.
- Identify backend bottlenecks and errors to improve UX.
- Collaborate and improve productivity across the team: Frontend engineers, backend engineers, and site reliability engineers can benefit from using distributed tracing.
Finally, it leads to a proactive attitude in the implementation of best practices in their production environments, putting themselves in a position where they can establish growth goals according to performance.
Features in N|Solid 2022
N|Solid is a comprehensive tool that can help your team solve bottlenecks quickly and confidently in production. Our latest release includes Distributed Tracing and Opentelemetry Support in N|Solid.
__Summarizing tracing in a comprehensive way. __
We support automatic instrumentation in two ways:
- HTTP and DNS core modules.
- Or using instrumentation modules from the Opentelemetry ecosystem.
However, we also support manual instrumentation using our implementation of the OpenTelemetry JS API.
N|Solid is a powerful APM that can help you with its features to proactively solve problems in your Node.js base applications in a safe, reliable, and performative way.
Get to know our major features and get the most out of N|Solid now!
- 🧭 Project and Applications Monitoring in N|Solid
- 🌌 Process Monitoring in N|Solid
- 🔍 CPU Profiling in N|Solid
- 🕵️♂️ Worker Threads Monitoring in N|Solid
- 📸 Capture Heap Snapshots in N|Solid
- 🚨 Memory Anomaly Detection in N|Solid
- 🚩 Vulnerability Scanning & 3rd party Modules Certification in N|Solid
- 👣 HTTP Tracing Support in N|Solid
- ⏰ Global Alerts & Integrations in N|Solid
To check out the top 10 features and more in N|Solid, sign up to create your account or sign in at the top right corner of our main page. More information is available here.
As always, we're happy to hear your thoughts – feel free to get in touch with our team or reach out to us on Twitter at @nodesource.