In-depth analysis of the APMs performance cost in Node.js
TL; DR: Based on the APMs benchmarks results it is that one of the main performance problems for a Node.js application in a production environment is the usage of the very same applications in charge of monitoring the performance for the application itself. This article explains how with an in-depth analysis to show why using most APMs in a Node.js application can be very expensive performance-wise and how N|Solid is different.
Intro
In NodeSource, since last year, we started an effort to provide visibility for a problem affecting the performance of many users in their production environment. While helping many different customers, we found that one of the principal causes of substantial performance degradation is the usage of applications providing observability over their processes operations. These applications are commonly known as APM (Application Performance Management).
We launched an open source benchmark showing multiple key metrics comparing a few different solutions widely used in the Node.js ecosystem. The results are catastrophic; many cases show more than 100% overhead.
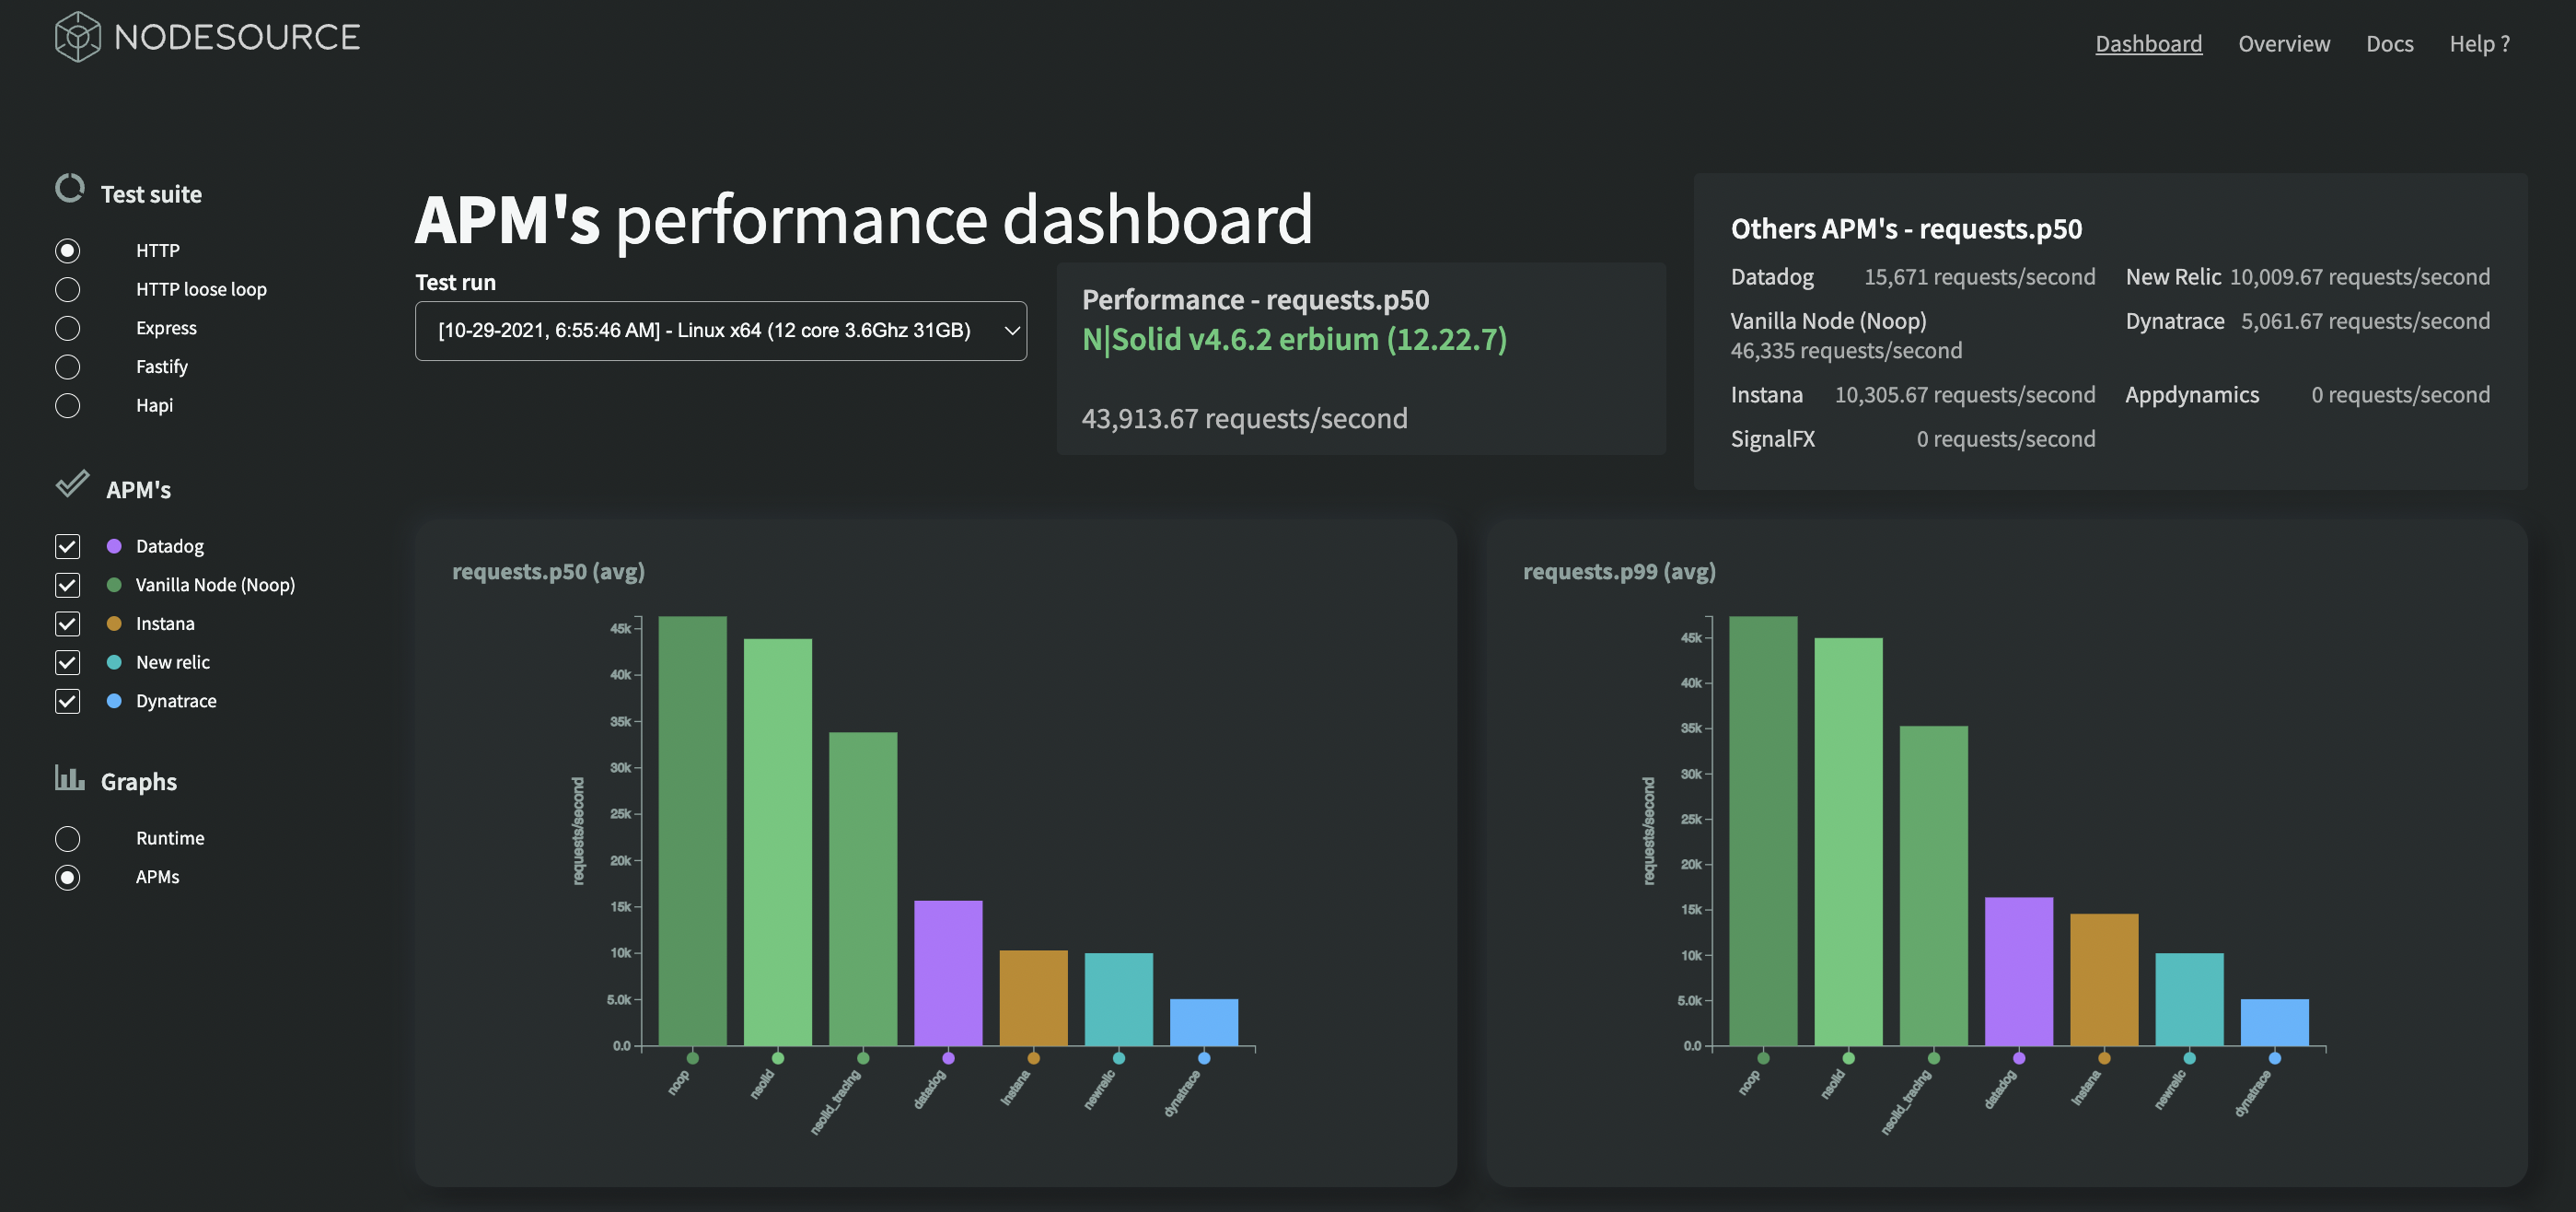
An example would be the scandalous situation of having a simple hello-world server dispatching 45.000 requests in 60 seconds, dropping drastically to just serving 15.000 requests by adding one of the most common APMs out there.
In November 2021, I did a talk in the excellent conference NodeTLV where I talked about performance issues in production environments; obviously, one of the main topics was uncovering the cost of using APMs in Node.js applications. Later, I received great feedback from some very reputable members of the Node.js community and speakers at the same conference. They asked not just to see the results but provide an in-depth technical explanation of the performance cost, and this article pursuits that goal.
Starting with an elementary application
To research the impact of adding an APM to a Node.js application, let's use a basic Fastify server, which is the best performing web framework in the Node.js ecosystem at the moment:
'use strict'

const Fastify = require('fastify')
const fastify = Fastify({
  logger: true
})

// Declare a route
fastify.get('/', (request, reply) => {
  reply.send({ hello: 'world' })
})

// Run the server!
fastify.listen(3000, (err, address) => {
  if (err) {
	fastify.log.error(err)
	process.exit(1)
  }
  fastify.log.info(`server listening on ${address}`)
})

// Exit after 30 seconds
setTimeout(() => {
  process.exit()
}, 30000)
The code above starts a Fastify server with a single endpoint returning a hello world in JSON; the process will automatically exit after 30 seconds.
To benchmark the performance, immediately after executing the script, 10.000 requests will be sent using AutoCannon. As a first step, the idea is to measure the time used by the server to process all these requests.
This process is essentially following a different approach than the published benchmark, where it is measured how many requests can take the server in a minute. The main reason for changing this analysis approach is that we want to identify the difference in the execution while performing the same operations with and without APMs.
For this study 3 APMs will be used:
- Dynatrace: The top leader APM according to the APM 2021 Gartner Magic Quadrant using the module @dynatrace/oneagent
- Datadog: The second best performing solution among the APMs tested in the bechmark using the module dd-trace
- N|Solid: The best performing and specialized Node.js APM using its runtime
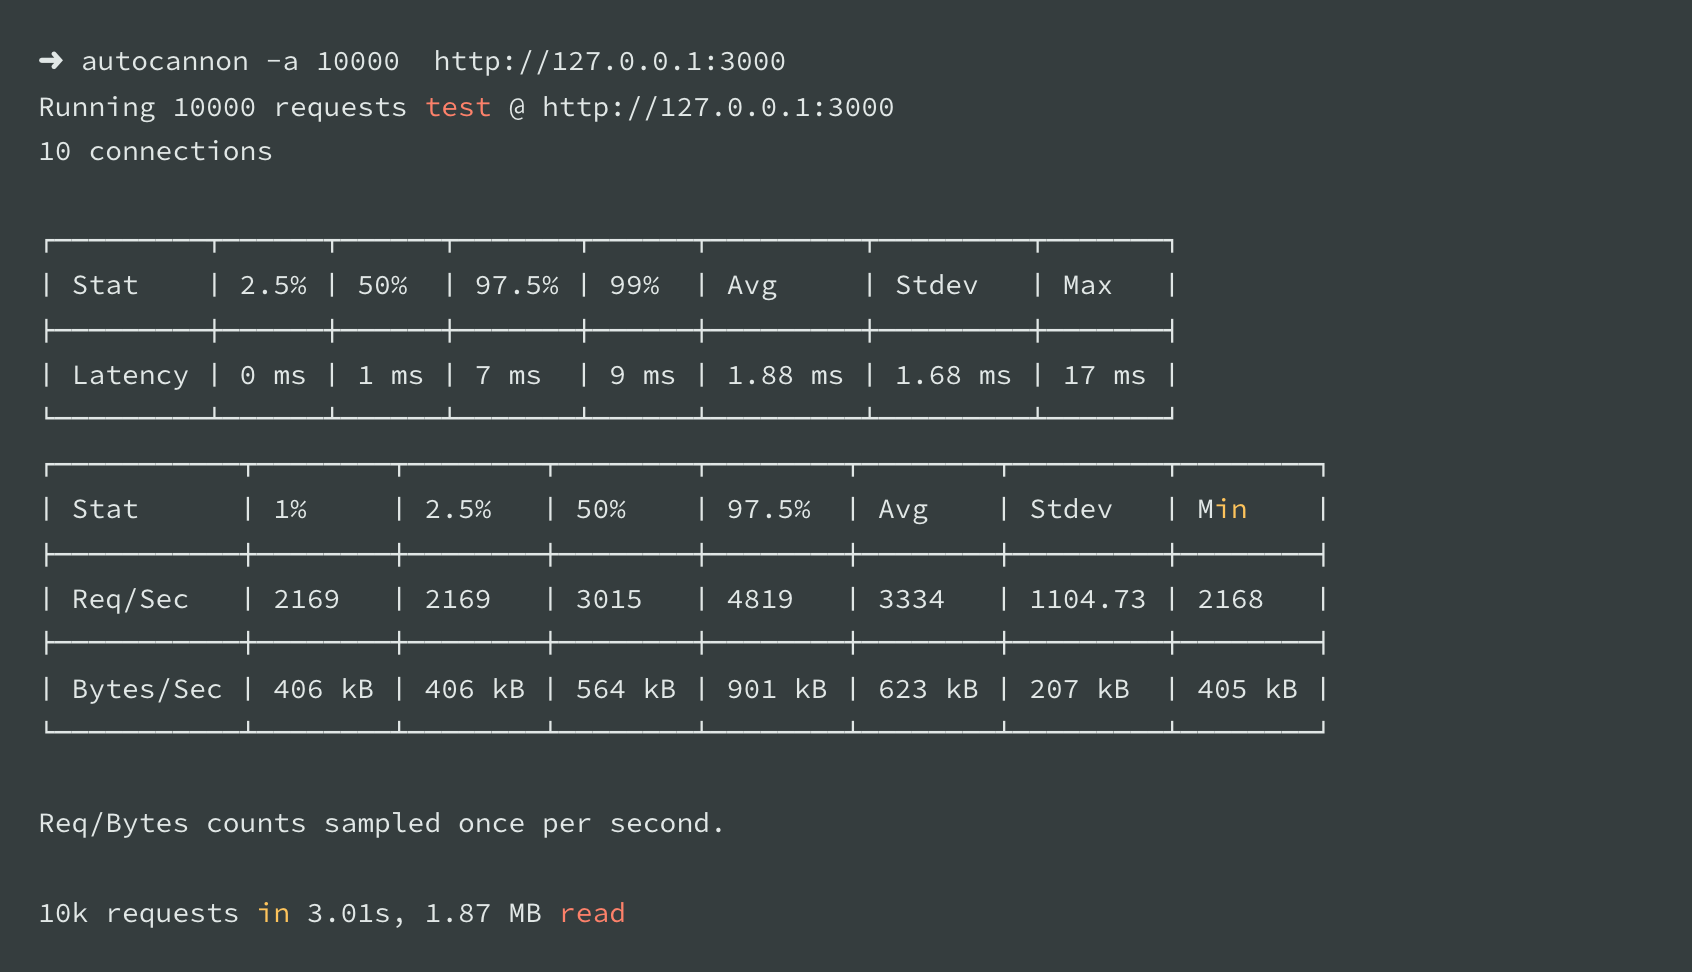
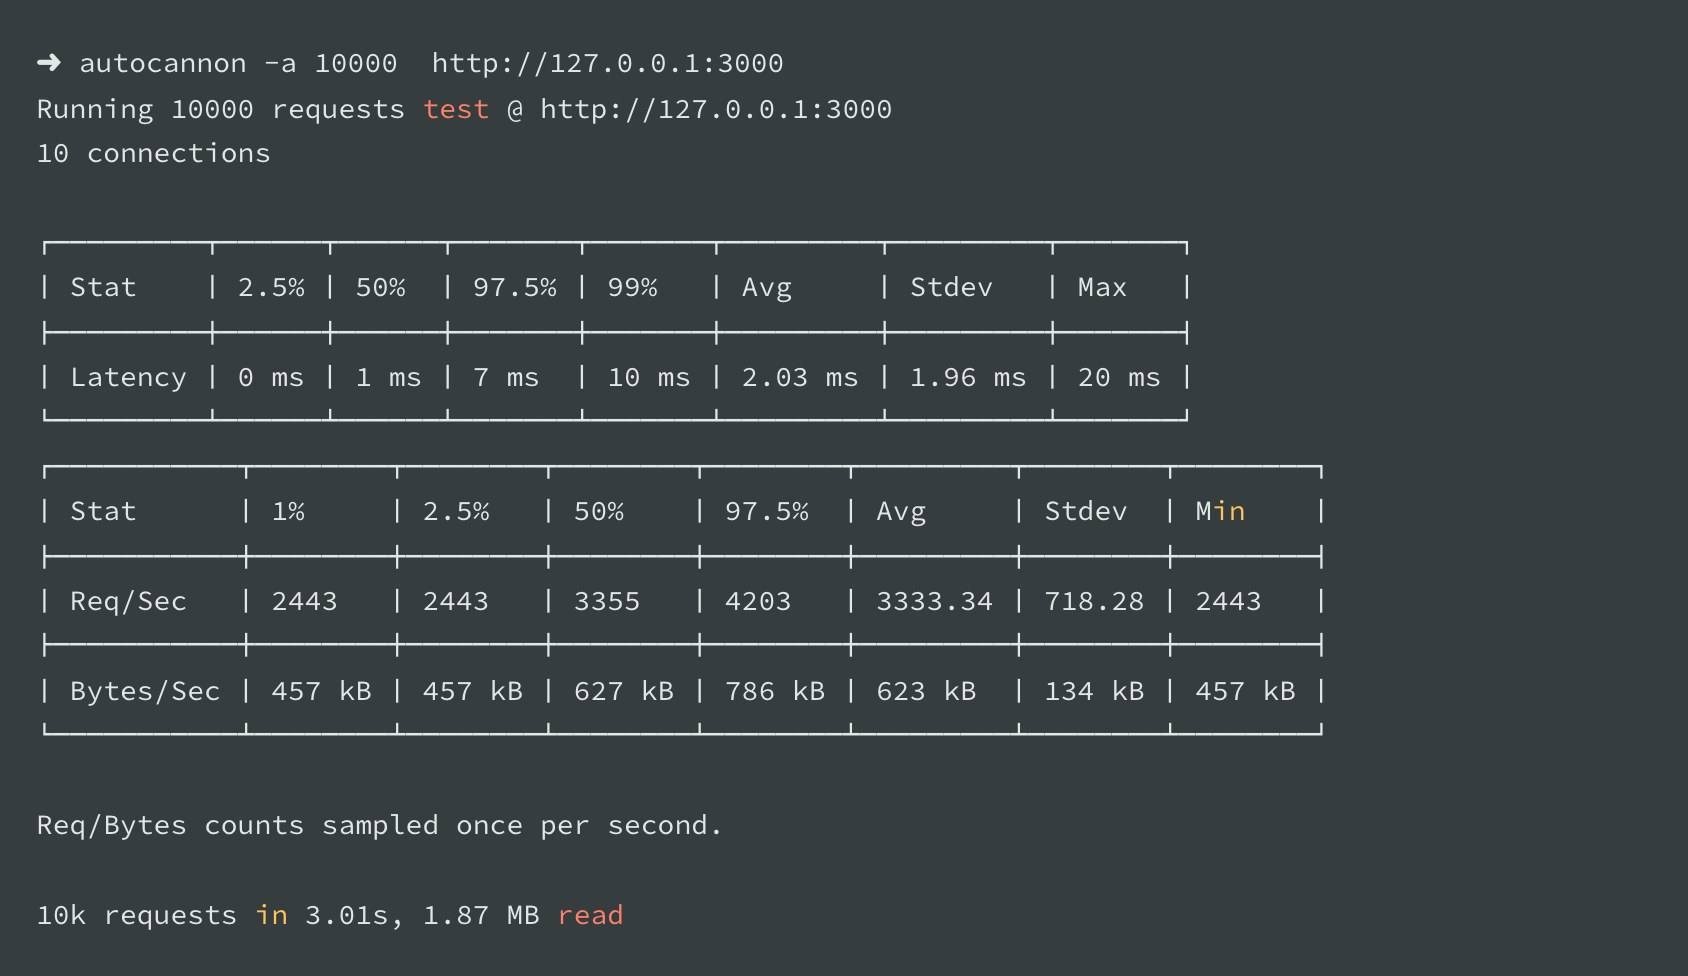
Here is the execution for the base script without any APM in a virtual machine running Ubuntu with 2 VCPU:
To add Dynatrace, is needed to install the module @dynatrace/oneagent and then add this code snippet at the top of the original script with the right values, saving this to a different file:
require('@dynatrace/oneagent')({
  environmentid: 'myDynatraceId',
  apitoken: 'dt0c01.myDynatraceToken',
  endpoint: 'https://myDynatraceId.live.dynatrace.com'
})
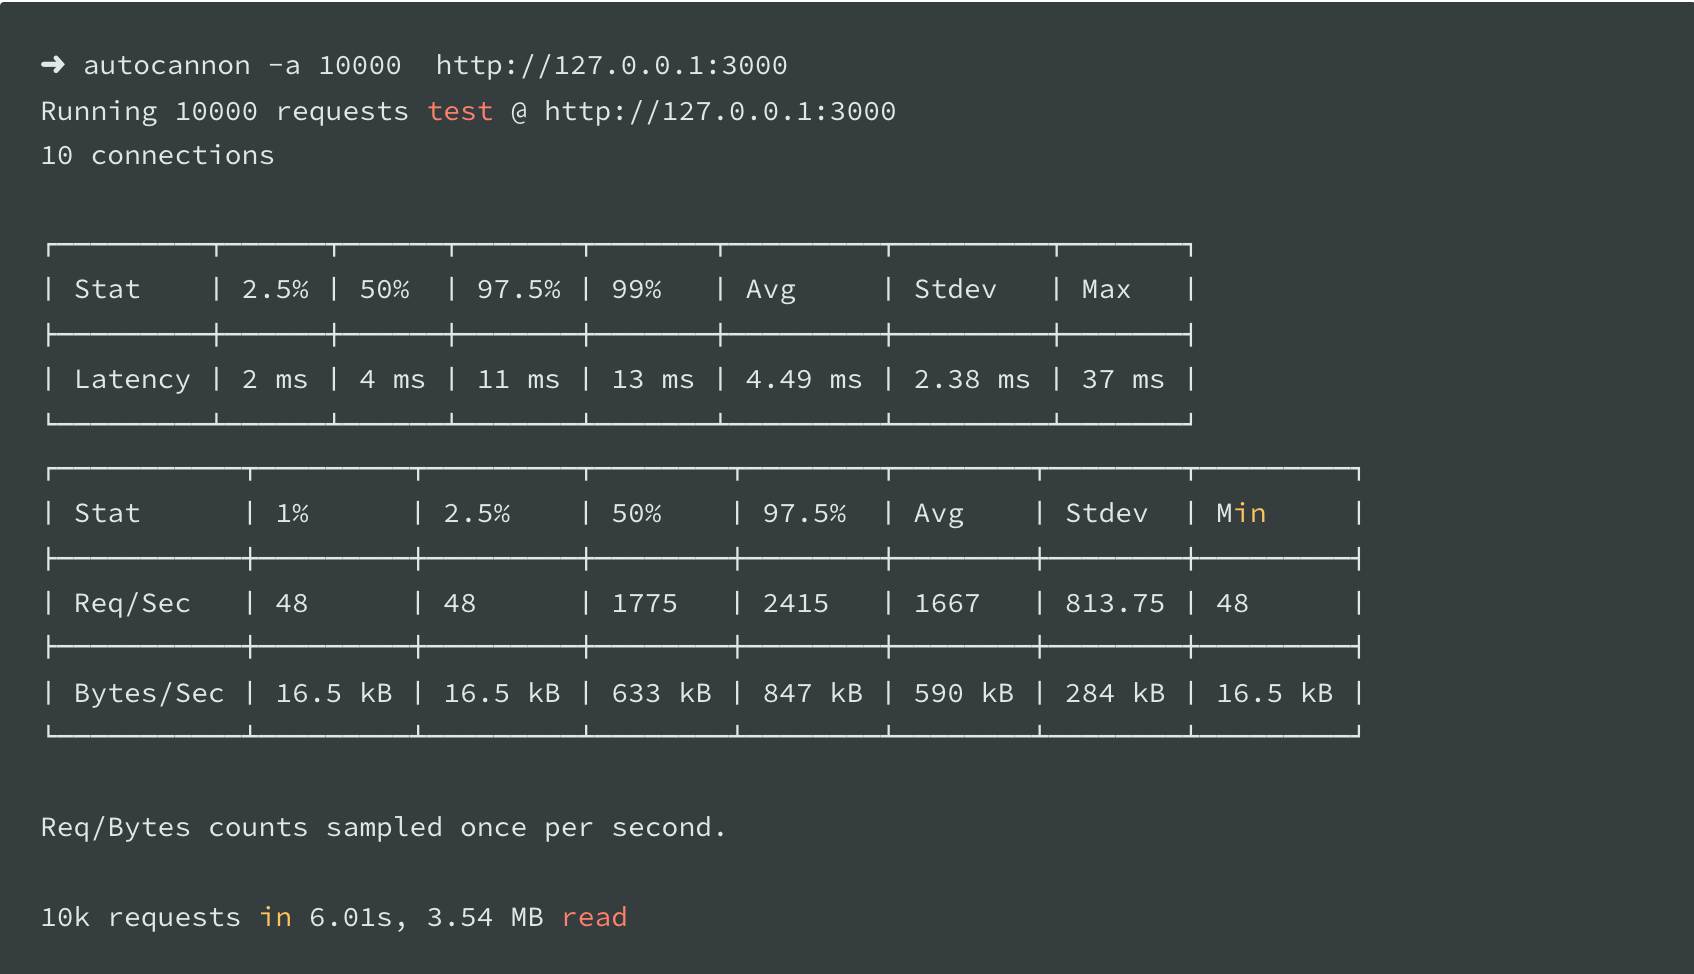
After following these instructions, here is the execution for the new script with Dynatrace configured in the same virtual machine:
Then, we proceed to add Datadog; for that is needed to install the Datadog agent in the machine and then the module dd-trace, as the last step add this code snippet at the top of the original script and save it to another file:
require('dd-trace').init()
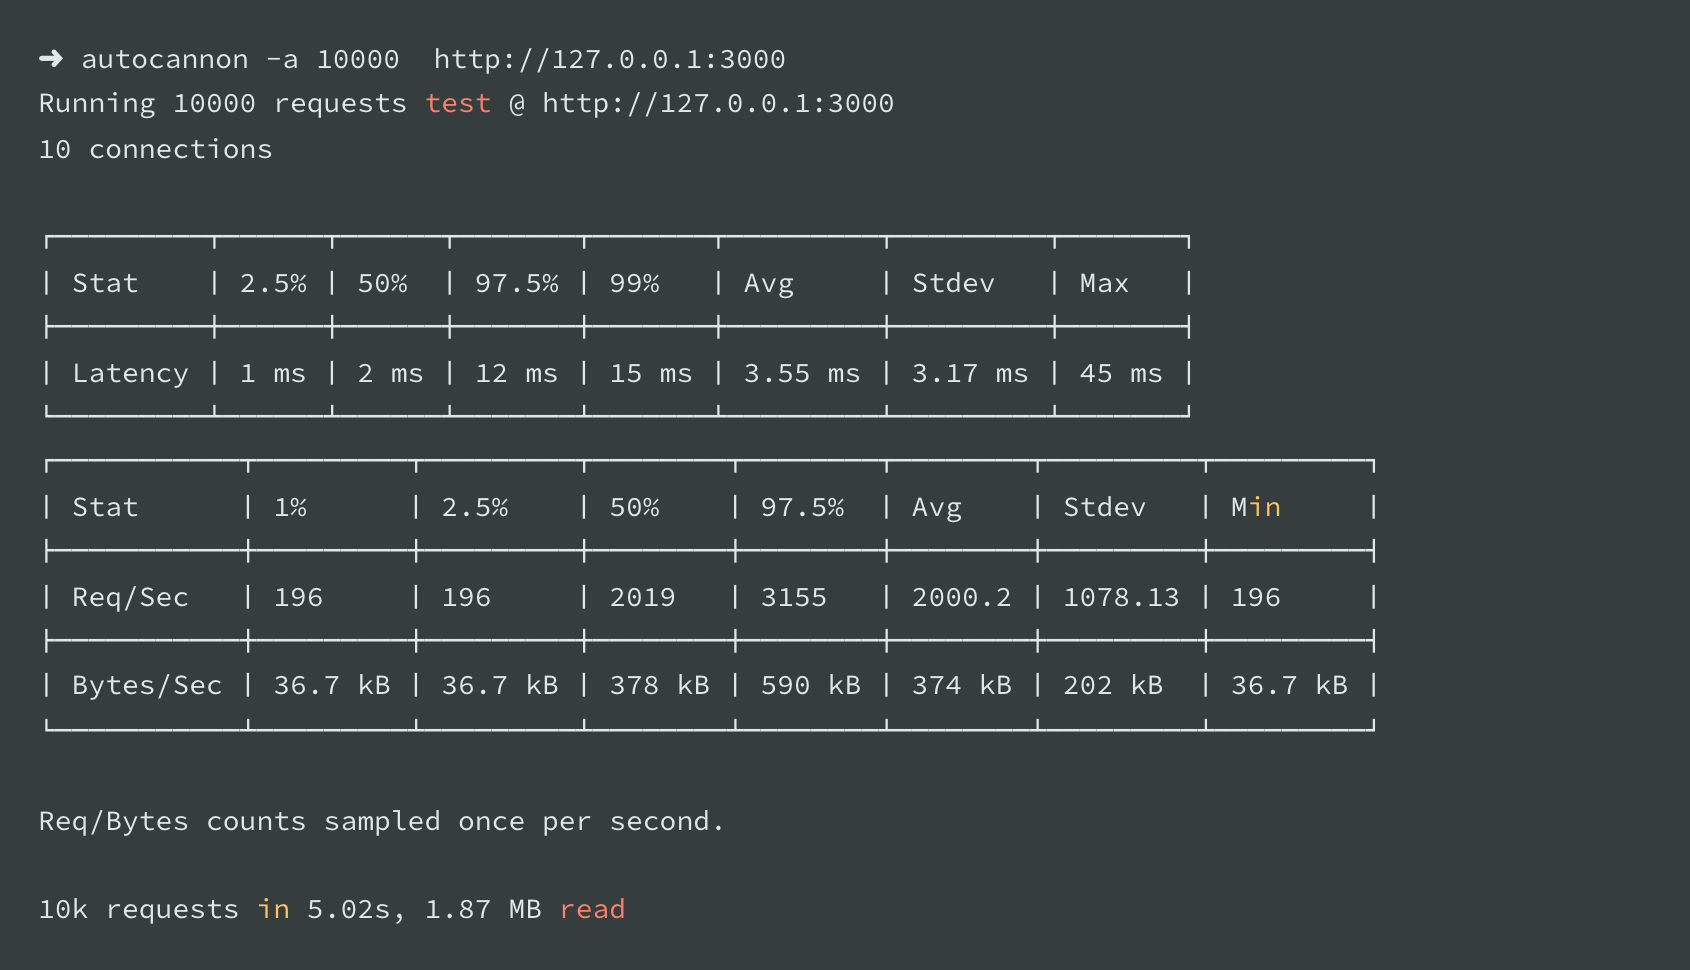
After following these instructions, here is the execution for the new script with Datadog configured in the same virtual machine:
Then we focus on testing with N|Solid; for this, we need to install the runtime, which is essentially the same process as installing Node.js runtime.
Once installed, we add the environment variable NSOLID_SAAS pointing to an N|Solid SaaS instance and then run the original script (no need to add anything in the code) with the nsolid command. Here is the execution for the base script with the N|Solid runtime installed in the same virtual machine:
In summary, here are the results sorted:
- Node.js without APM execution: 10K requests in 3.01 (baseline)
- N|Solid execution: 10k requests in 3.01 (virtually no overhead, which means no notable performance degradation)
- Datadog execution: 10k requests in 5.02s (66% overhead, which means a notable performance degradation)
- Dynatrace execution: 10k requests in 6.01s (99% overhead, which means a costly performance hit)
Now that we have the results with this minimal benchmark, there is considerable overhead with the traditional APMs but almost no change while using N|Solid. An in-depth analysis is required to understand these results from the technical point of view to identify what is happening.
There are many different techniques to analyze the execution of a Node.js script; we will use two of them.
Tracing events to analyze the execution
The Trace Event provides a mechanism to centralize tracing information generated by V8, Node.js core, and userspace code; basically, it records all the events in the execution.
We can capture the information of the specified events categories in the execution of every iteration of the test explained above. to accomplish that, we will execute the script for the regular baseline Node.js script like this:
$ node --trace-event-categories=v8,node,node.async_hooks --trace-event-file-pattern='node-trace-node.log' index.js
The flag --trace-event-categories allows us to track the V8 and Node.js operations, specifically the async_hooks events for this case. You can check the available categories here.
The tracing module does log rotation by default, putting the events in multiple files. In this case, we want to have all events for the whole execution in a single file to compare the file stats easily. For that, we set the flag --trace-event-file-pattern='node-trace-node.log' so everything goes to one big single file (~ 75MB).
Once we have the log file, we can use Chrome Devtools to load and inspect. Just go to the URL chrome://tracing/ and click on the load button, then you will see this:
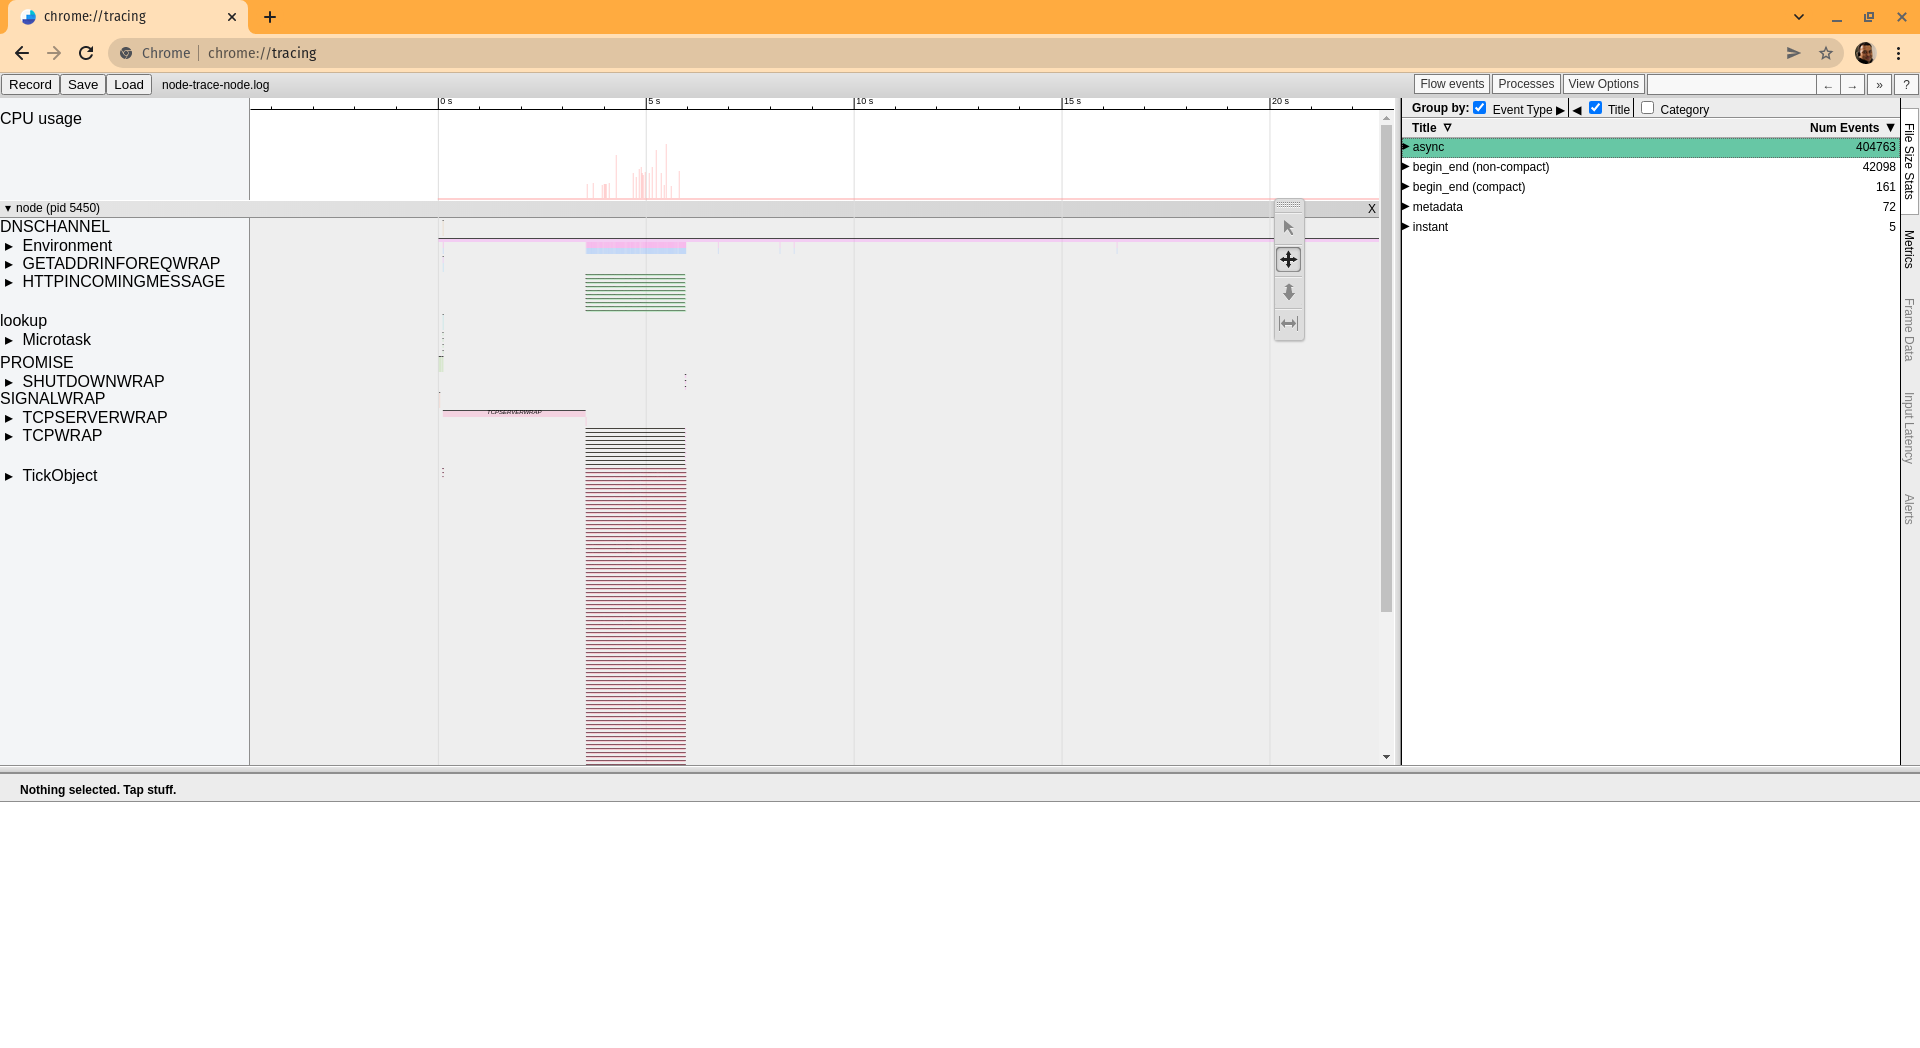
The file size stats tab provides a good summary of the file content divided into some categories grouping events types, and that's what we are going to compare for all the executions, so we proceed to execute all the scripts as described above to get each log.
After capturing the traces for all scripts, here is the stats comparison:
The first column is the baseline execution stats meaning Node.js without an APM, and then we have N|Solid, then we have Datadog, and finally Dynatrace. A cell highlighted in light yellow indicates a difference in the stats for that specific event type in the current execution comparing it with the baseline. A cell highlighted in a darker yellow means a new type of event present in the APM execution but not present in the baseline execution.
Here are some facts about the comparison above:
-
N|Solid execution stats are the closest to the baseline execution with just 11 stats different and adding 1 new type of event. The stats difference is widely the smallest compared to the other APMs, except in the
fs.sync.lstatand the new event type,fs.sync.access(primarily due to the scan the runtime does once for all dependencies to detect vulnerabilities). -
Dynatrace is the next one with 19 stats changed compared to the baseline and a new event type. 9 of the altered stats are in the async category, which tracks the asynchronous operations, and almost all
fsevents stats have a higher number; also, half of theV8events type stats are altered. -
Datadog execution is more extreme with 29 event types with higher stats and a vast difference than the baseline. Also, it is adding 13 new event types. The async category receives most of these changes where disturbing numbers like the
PROMISEstats where the baseline number is 14 and stay almost the same in the other executions (N|Solid 14, Dynatrace 22), in this case, it goes up to 52. All thefsmetrics are higher, but 1, also Garbage collection events are higher here, and allV8stats are also higher than any other execution.
Visually analyzing the executions
Another technique that we can use to compare the executions is CPU profiling. Using it, we can generate visualizations to analyze each run. One very common to do this is the flamegraph.
A flamegraph shows the data in a CPU profile, which is a unique set of stack traces captured during the profiling, with the "area" of the stack indicating the proportional time spent in a function compared to that of its parent, which is the bottom, it shows the time along the x-axis. The y-axis shows the function calls that make up a particular stack trace.
Each APM of the ones analyzed here counts with a feature for CPU profiling, but we are looking for an external solution to get impartial and uniform results. For that, we will use 0x, a well-reputed tool in the Node.js ecosystem.
After installing 0x, we need to execute the script and repeat the test like this:
$ 0x index.js
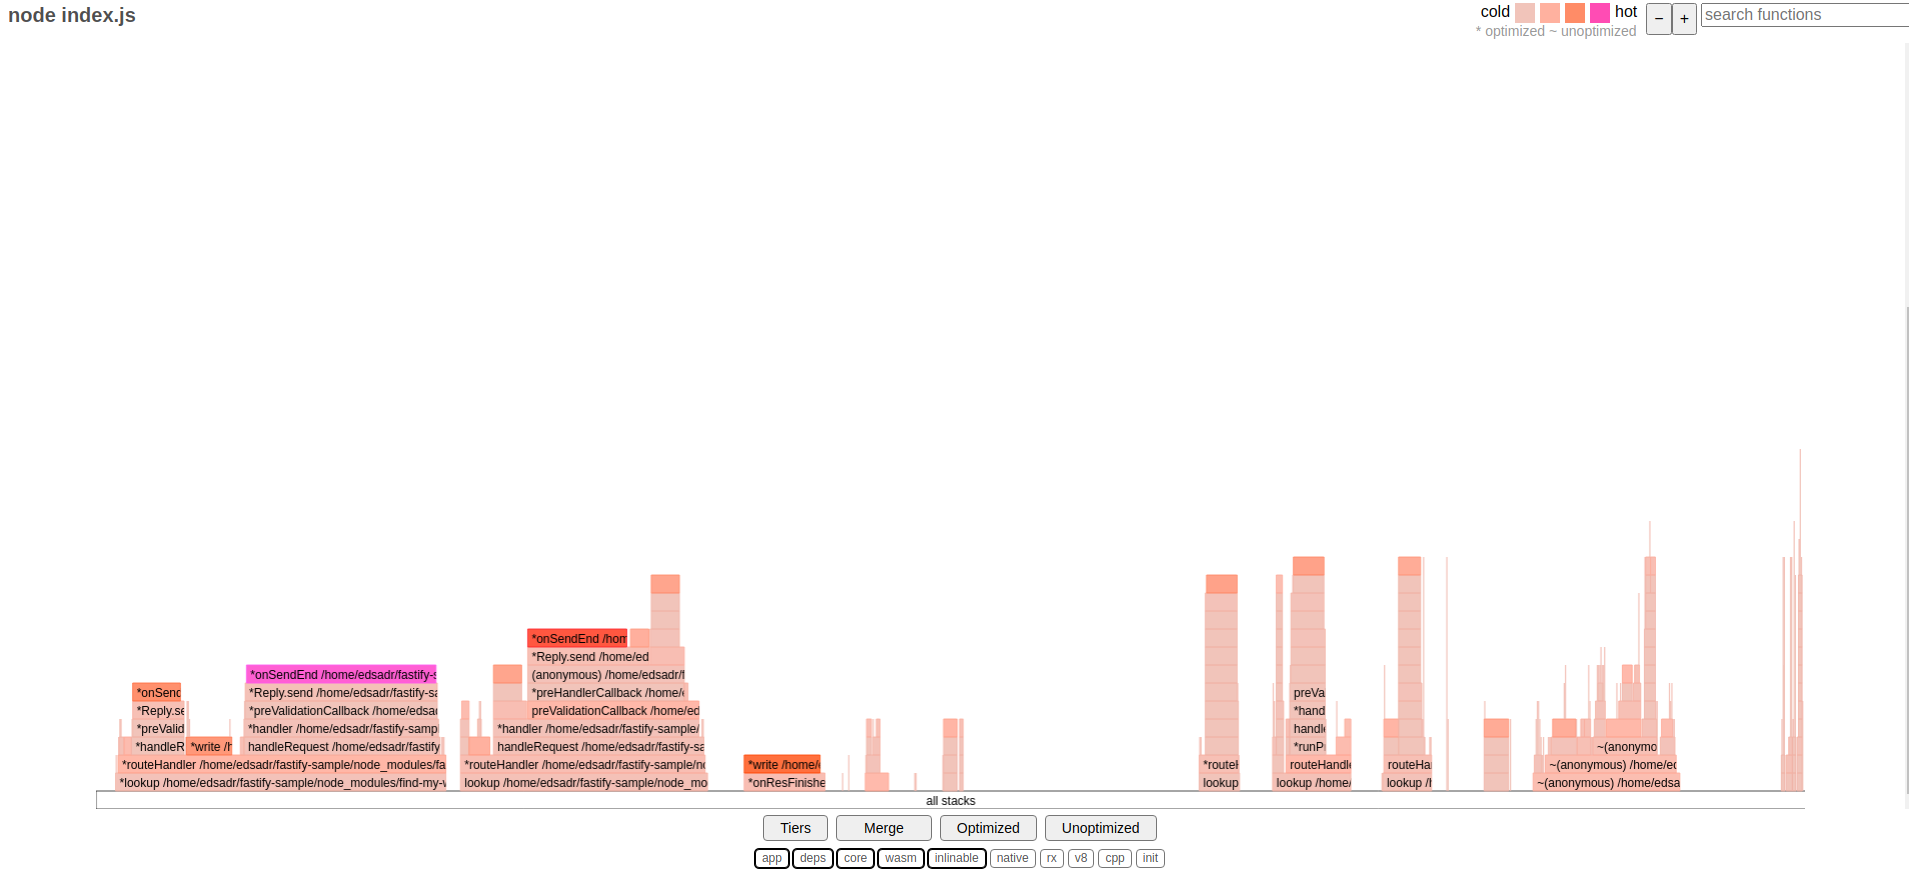
After finishing the execution, 0x generates a flamegraph for each, here are the results for the Node.js baseline execution:
Now, let's see what it looks like for N|Solid:
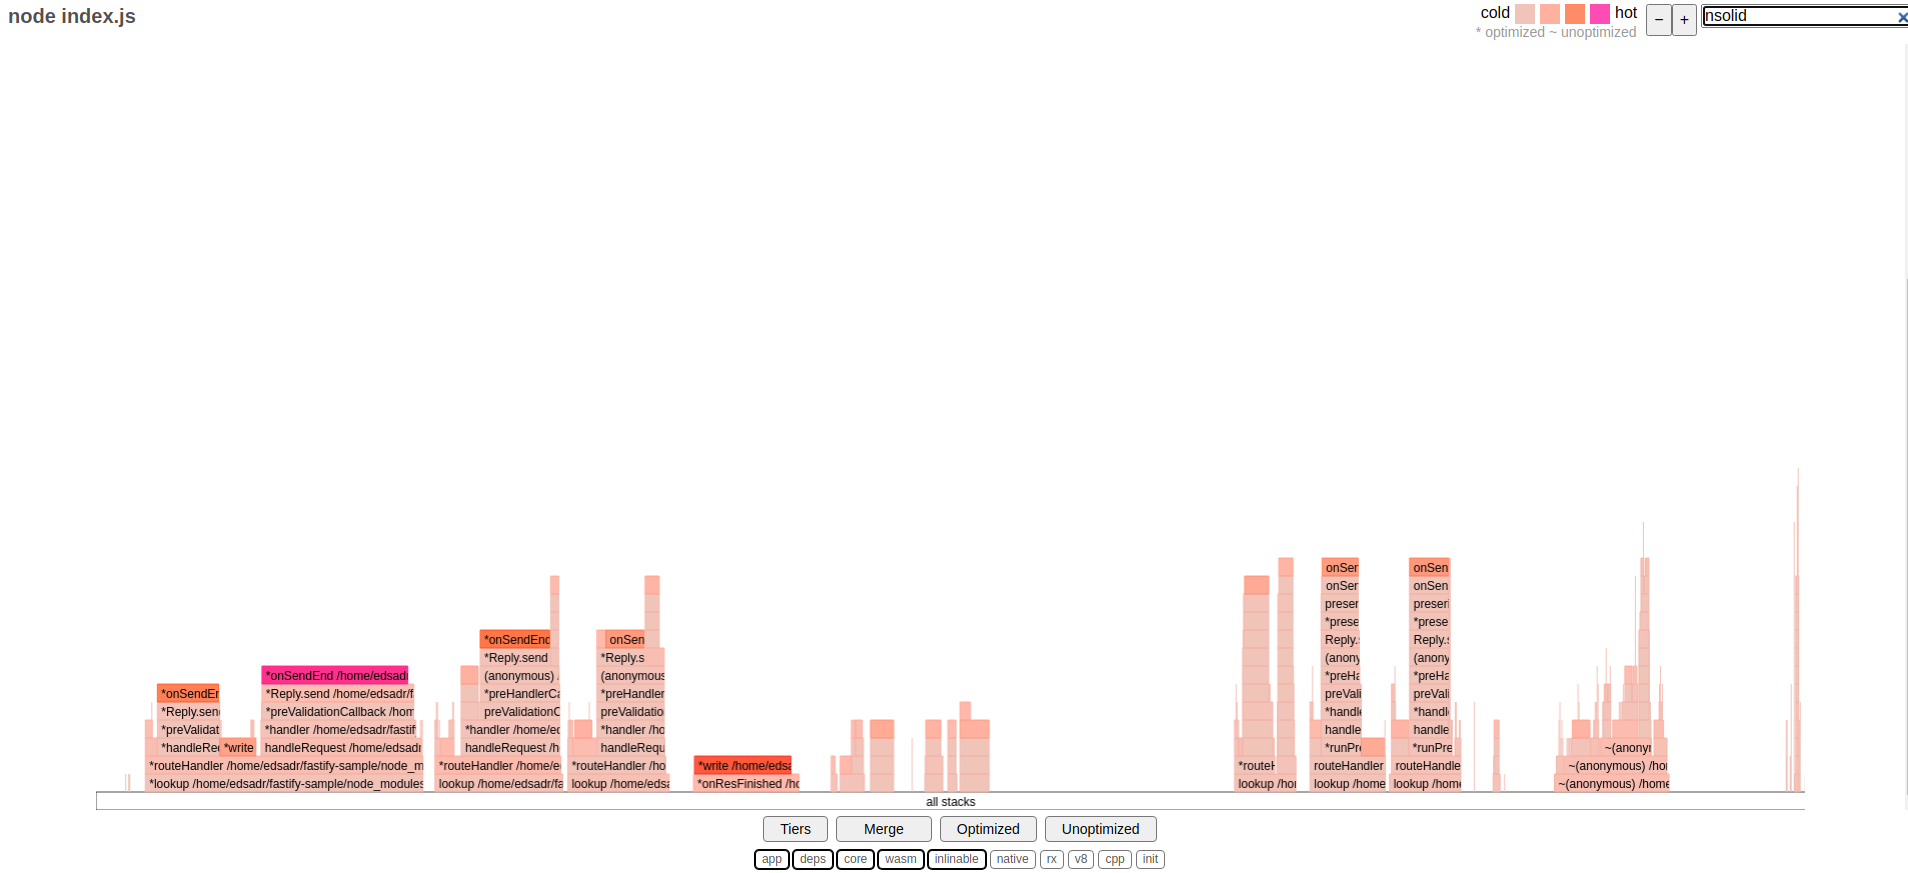
At first sight, both flamegraphs for Node.js baseline and N|Solid executions look pretty similar. The results are consistent with the data obtained while using tracing. One thing to notice is that if you search for the nsolid module execution in the flamegraph, you will not see any match; we will expand on this one later.
Here is the flamegraph for the execution with Dynatrace:
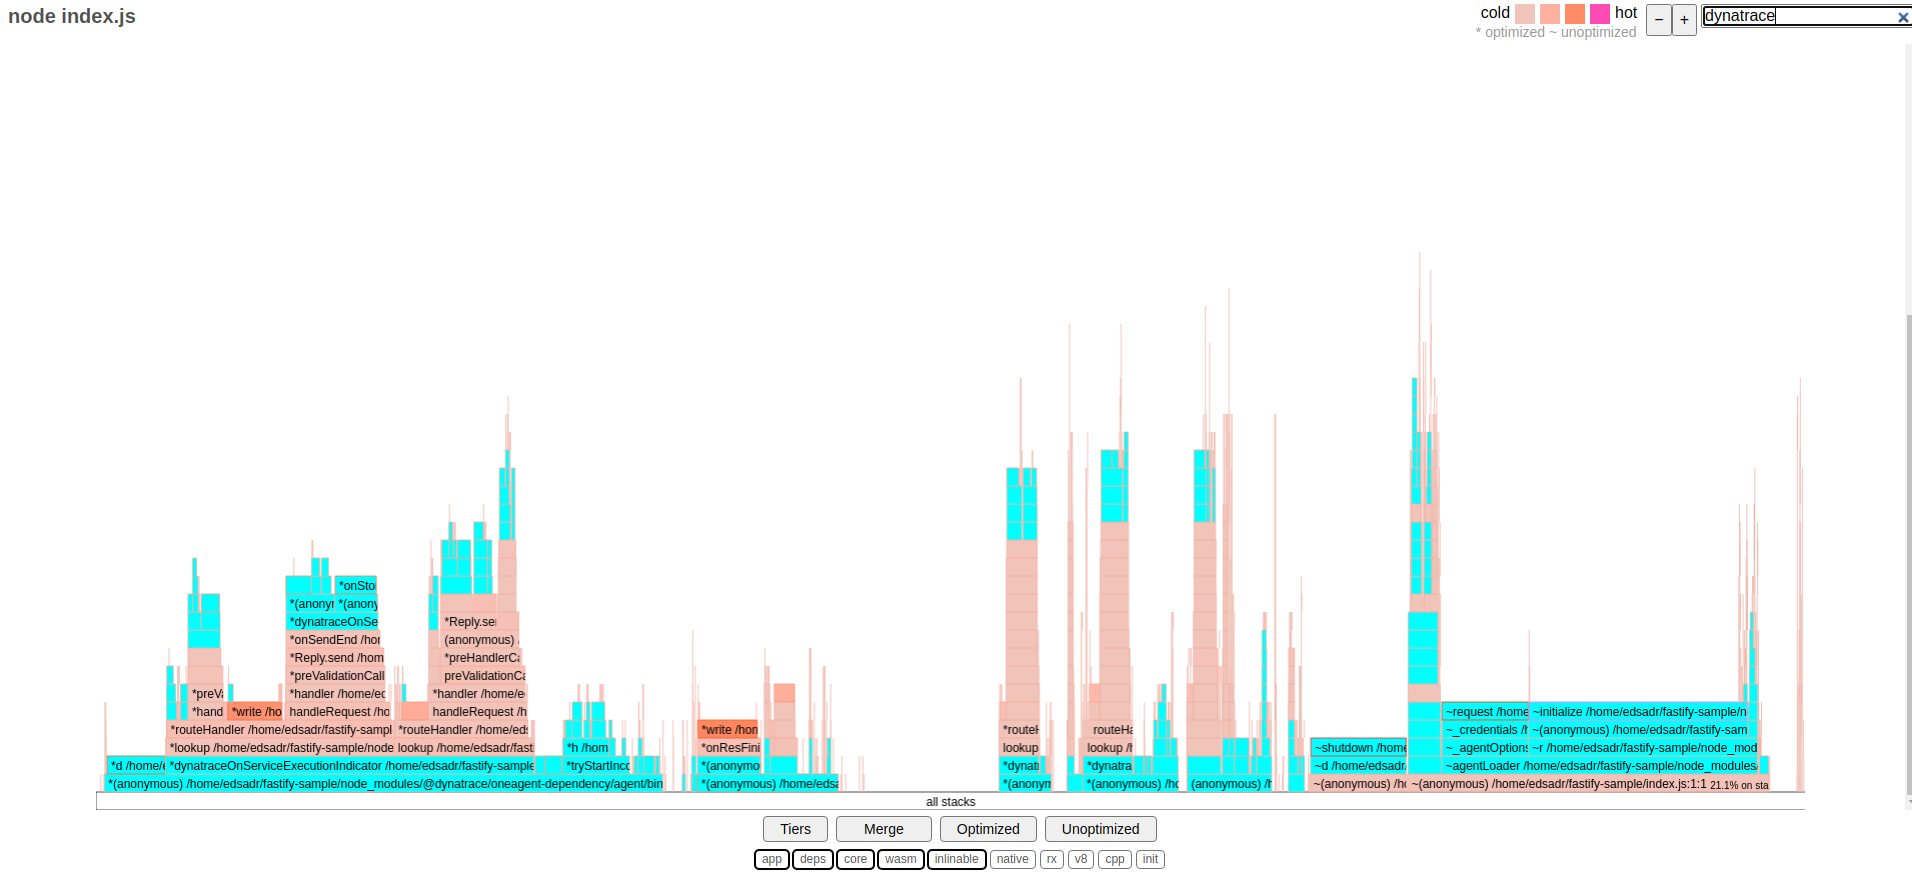
The flamegraph above is the opposite. You can see just by judging the height of the stacks; also, filtering by dynatrace, there are many different parts highlighted in light blue, which clearly shows a lot of code from the Dynatrace module being executed.
In a flamegraph, when you want to look for slow code being executed, you need to analyze the width of the stacks. In this case, in the last part (the right side of the flamegraph), you can see a dynatrace function taking a considerable amount of execution time. That could explain the massive overhead we saw at this benchmark, making Dynatrace the worst-performing.
Now, let's take a look at the execution with Datadog:
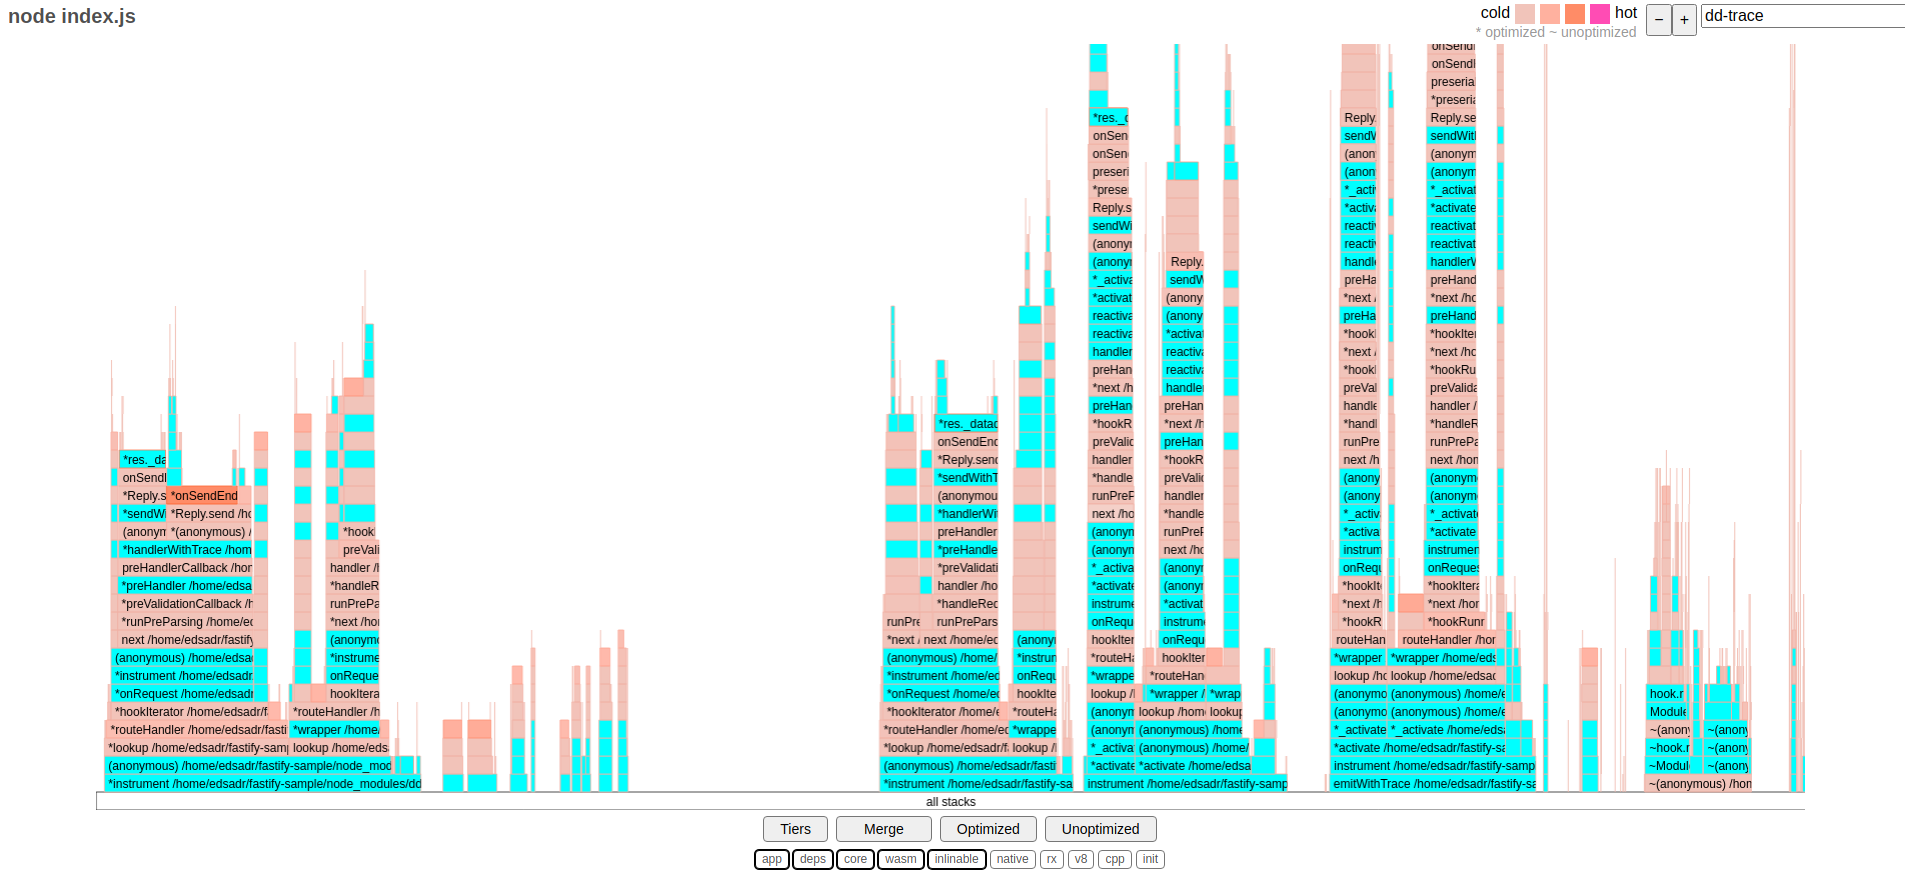
In the flamegraph above, we have a different case, same as Dynatrace previously, filtering by dd-trace (the Datadog agent). You can see even more of their agent code being executed compared with Dynatrace.
The stacks are way higher than any other flamegraph, but the width remains more reasonable than the one we observed at the Dynatrace flamegraph. According to this visualization, Datadog executes a lot more code (again consistent with the tracing results) but more efficiently with non-blocking operations. Still, it adds a lot of operations to be executed, which is the cause of the overhead shown in the benchmark.
Why are N|Solid results similar to vanilla Node.js?
Essentially, N|Solid is not a traditional APM. Traditional APMs use instrumentation to capture all the metrics and insight they want to provide, which in the end, means, as we saw previously, adding their code using different Node.js mechanisms to measure the user's code performance.
While adding their code, they steal resources to the user's code execution and make the original user's operations take more time and resources. This overhead could also grow exponentially depending on multiple variables like the modules the user adds to their program. For example, Most APMs create unique instrumentation for databases operations and frameworks, so if the user's program grows in complexity, the instrumentation could also be considerably more expensive.
The N|Solid runtime is a build of Node.js bundled with an advanced native C++ component, the N|Solid Agent; it follows a different approach, instead of adding code to be executed in the main thread, The N|Solid agent runs on its own thread inside the binary, with direct access to the core elements of Node.js, libuv and the V8 JavaScript engine where it gets the necessary metrics to analyze the user's code performance in a non-obtrusive way, that's why its execution is almost identical to the Node.js baseline execution.
The N|Solid suite also follows a different approach for observability. Let's take, for example, CPU profiling or capturing heap snapshots; instead of continuously performing a CPU profile or capturing the memory obsessively like other solutions, it has a way for the user to set the conditions for taking a CPU profile or a heap snapshot in production environments when is needed.
The user could specify that it would be interesting to profile a specific process when the event loop is being blocked for X seconds, the CPU is spiking higher than 60 %, or the Event Loop Utilization is over 0.8. Any conditions and specific metrics could be used to trigger these observability actions.
This approach is more efficient than adding a continuous performance hit and capturing unnecessary data because, let's be honest, 90 % of the time, your processes will be ok; if that's not the case, then we can recommend investing more time in load-testing before sending your code to production.
Conclusion
It is essential to have observability in place. Still, most of the time, it comes with a very high price, making your applications have worse performance, directly affecting the cost of your infrastructure, and making performance issues present in your code more severe.
Remember, It is not just the code performing poorly; the one being executed. In every execution, the code for the observability tool will run, adding to the lousy performance, which is not insignificant.
We also need a change in the paradigm, we need to observe smarter, and we need APMs to be more honest and thoughtful with the impact of their operations so they do not affect the performance in the significant way we see these days.
All files generated in this analysis are available to download here
- 🛠️ Use the ✨APM's Performance Dashboard✨ here:
- https://benchmark.nodesource.com
- 📗 Read the full blog post here: https://nsrc.io/4xFaster
- 💚 Contribute here: https://github.com/nodesource/node-APMs-benchmark
If you have any questions, please feel free to contact us at info@nodesource.com or in this form.
To get the best out of Node.js and low cost observability, start a free trial of N|Solid.