CPU Profiles as a Diagnostics tool in Node.js
With Node.js applications and services, spotting the performance bottlenecks in your applications is deciding to take real advantage of the speed and reliability that Node.js has to offer.
A CPU profile is a way to understand how your application is executed, what functions devour what percent of CPU time, and provides enough information for a more precise application diagnostic.
Node.js provides a way to run a CPU profile, but it is important to consider the cost of profiling your application (at the time of this blogpost publish date). The CPU profile option in Node.js will profile the application from the startup until the process exits, which is an experimental feature and not recommended in production environments.
N|Solid runtime is a production-ready drop-in alternative to Node.js. With N|Solid, organizations are not obligated to the profiling tools limitations of Node.js runtime. N|Solid can start and stop a CPU profile on-demand or programmatically with various instruments like command-line tools, custom views, JavaScript API, or C++ API. After that said, the performance hit of taking CPU profiles in N|Solid is a lot cheaper than in Node.js or any other traditional APM.
A pretty usual and not healthy pattern in Node.js is the callback hell. In the image shown down below, we ran a CPU profile using N|Solid in a simple application that uses recursion to simulate a callback hell (the recreation of an appreciable call stack tower is complicated, and it does represent the opposite of our Node.js code ideals here at NodeSource).
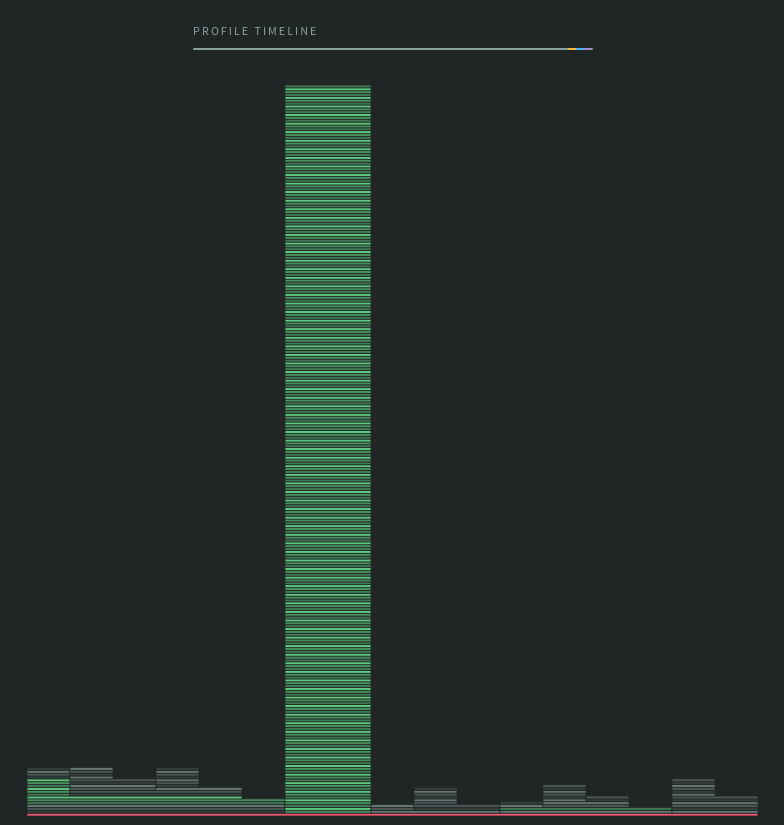
That is the flame graph representation of a CPU Profile, the wide of the rectangles represent the CPU time, and the stack of blocks is a recreation of the call stack.

The first thing that gains our attention is the big tower, which is our recursive code.
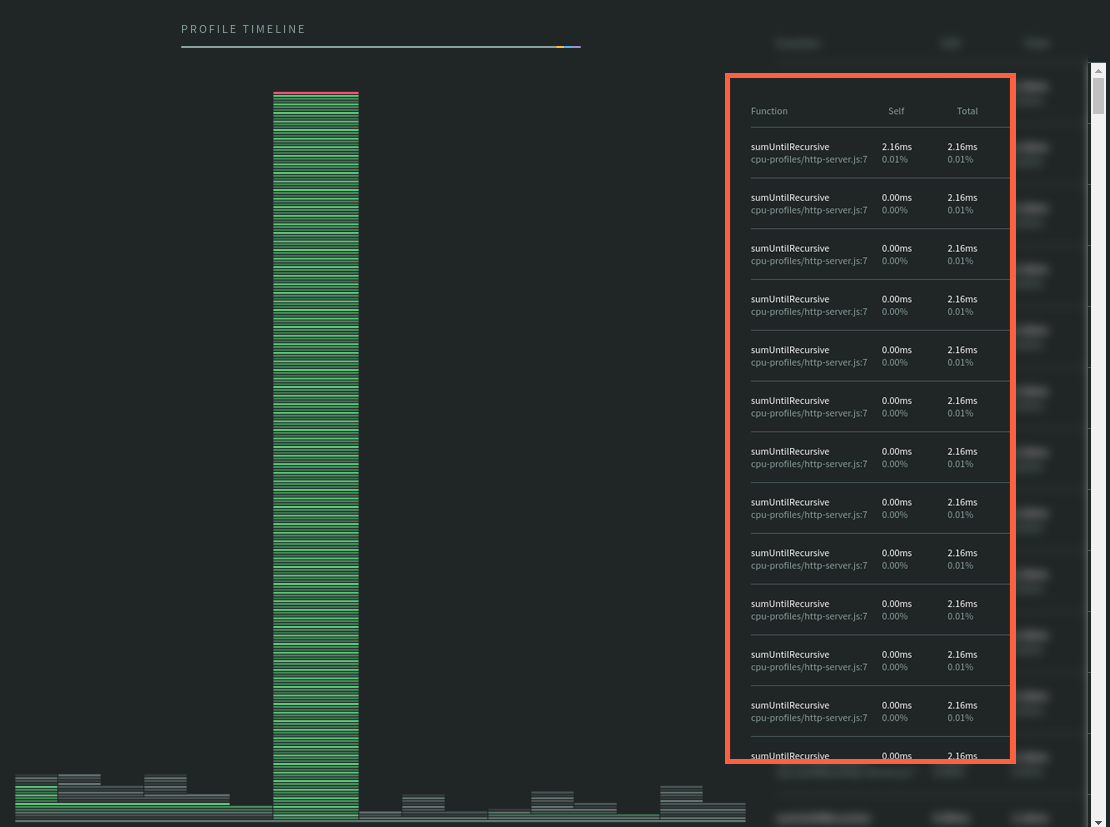
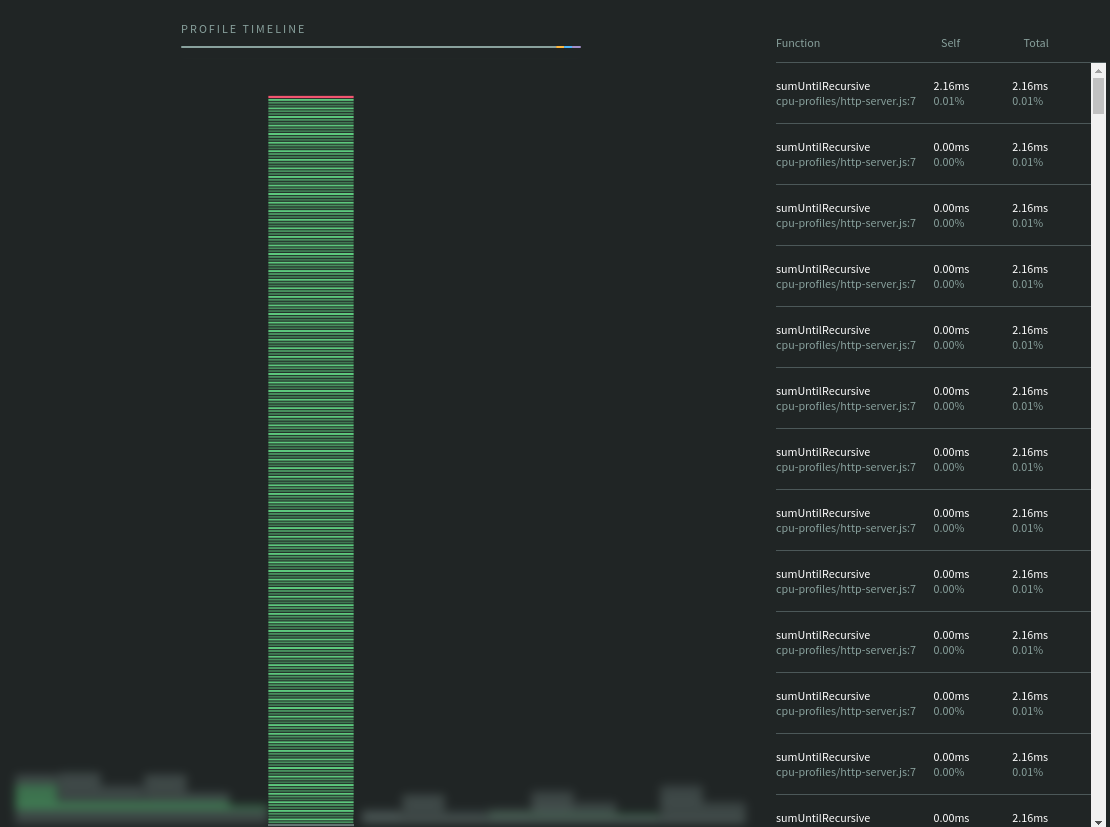
The N|Solid profile visualization also provides a textual representation of the call stack with the respective function name, self-time function, total time function.
We may find the simulated callback hell and the main problem in this application based on a simple observation. It is not that big tower is being resolved in a relatively short time.
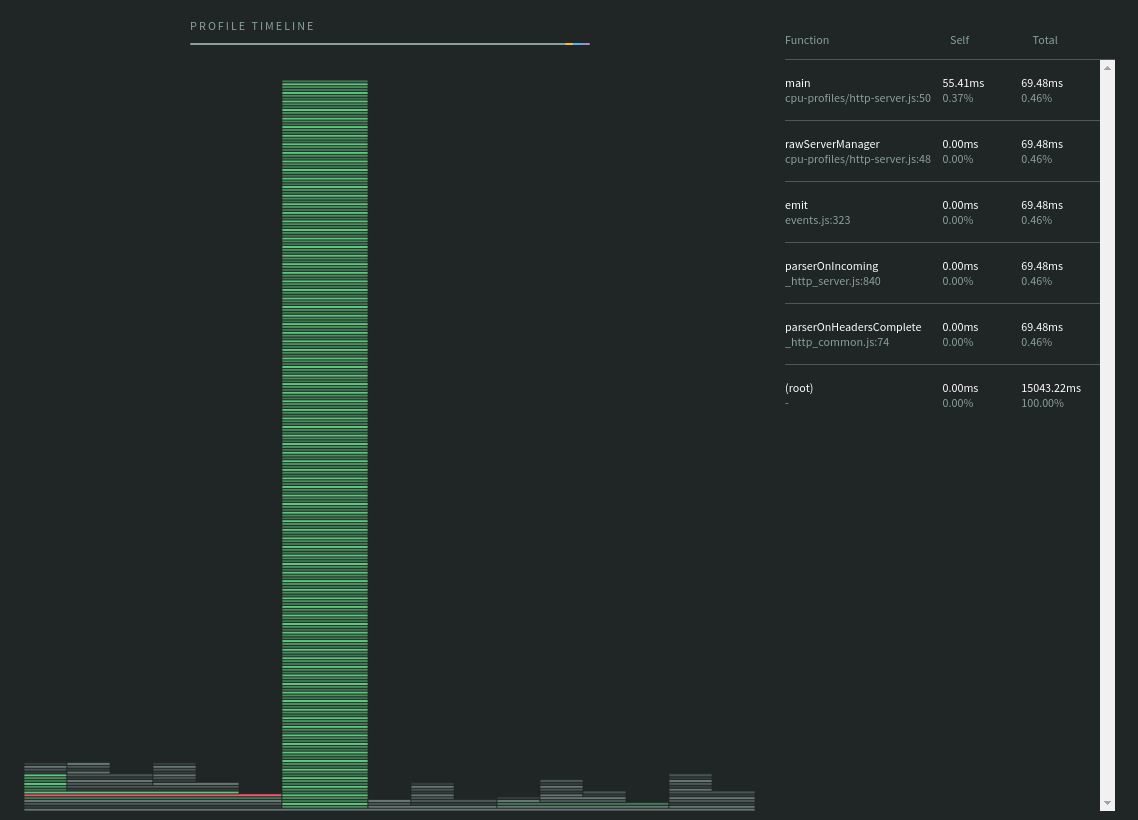
The main function is taking around 32.16 times the whole big tower! That's where our bottlenecks lie in.
To conclude, that's how N|Solid helps organizations to find bottlenecks, even the tricky ones, without sacrificing too much of the resources as it is in Node.js or a traditional APM.
The N|Solid CPU profiler viewer also supports sunburst and treemap visualizations and different highlighting modes and search functionality. Learn more at: https://docs.nodesource.com/nsolid/4.5/docs#visualizations-explained
Need a helping hand?
If you have any questions, please feel free to contact us at info@nodesource.com or in this form.
To get the best out of Node.js, start a free trial of N|Solid, an augmented version of the Node.js runtime, enhanced to deliver low-impact performance insights and greater security for mission-critical Node.js applications. #KnowyourNode