Introduction to Event Loop Utilization in Node.js
In the last year, I've spent many hours writing patches for libuv and Node to collect new metrics. The goal of this was to indirectly infer the state of the application without introducing measurable overhead. I've run a few hundred hours of benchmarks and collected over one million data points to make sure my analysis was correct. Eventually, I plan to write about all aspects of my research, but today we will focus on a metric that has already been added to Node.
A quick note before we continue: Terms are inconsistently thrown around to define parts of the event loop, such as the "event loop tick" that can either refer to the next event loop iteration, the next event loop phase, or a "sub-phase" of the event loop that is processed before the stack has completely exited. To prevent further confusion, at the end of this post are proper definitions of event loop related terms.
Initially, I added measurements for over 30 additional metrics to libuv and Node. For example, a few of these are counting the number of events processed, timing measurements for every phase and subphase of the event loop, and tracking the amount of data written and read from streams. Two things quickly became apparent. First, most of these metrics didn't give additional insight. Either because there was too much noise or because the information could be replicated through other metrics. Second, a few of the lowest level metrics showed surprising patterns that revealed how the application was performing. One of those is now known as event loop utilization.
The simplest definition of event loop utilization (or ELU) is the ratio of time the event loop is not idling in the event provider to the total time the event loop is running.
It sounds simple enough, but some subtlety can be easily missed. By the end of this post, I hope to have explained adequately about the ELU and how event loops work in general to give you the confidence to interpret the resulting metrics.
What is an event loop
The following is a diagram about the event loop from the official Node.js docs (which is a variation of a diagram I created for a blog post back in 2015) about the order of execution for each of libuv's phases:
Now that we have had a brief review, it is time to put that information out of our minds. Those implementation details will only distract us from understanding how the event loop works at a more fundamental level.
Three key differences to note before we continue between Node's digram and the event loop we'll be focusing on are:
- The only two phases of execution are: first, entering the event provider and second, calling the event dispatcher.
- An iteration of the event loop starts when calling the event provider (e.g. poll).
- All activity within the event loop should be seen as an extension of received events.
The sequence of operations for the event loop are:
- Events are received from the event queue (e.g. kernel) via the event provider (e.g. epoll_wait).
- If the event queue contains an event, then it is immediately returned.
- Otherwise execution is blocked until an event arrives.
- The list of events are then dispatched (e.g. libuv processes the file descriptors).
- In most cases the event handler (e.g. the callback) associated to each event is called.
- Other operations can occur, such as removing the file descriptor from the watch list.
The fact that libuv runs the poll phase in the middle of phase execution, instead of at the beginning, has to do with needing to handle its other APIs. For example, if a timer's timeout has expired before calling the event provider then the timer's callback will be called first.
All execution time within the event loop can be seen as an extension of processing events because, for all intents and purposes, the primary purpose of an event loop is to handle incoming events. So any work performed can be interpreted as work triggered by a previously received event.
Now that we've drawn the line between the core of an event loop and what are Node's implementation details, it's time to proceed.
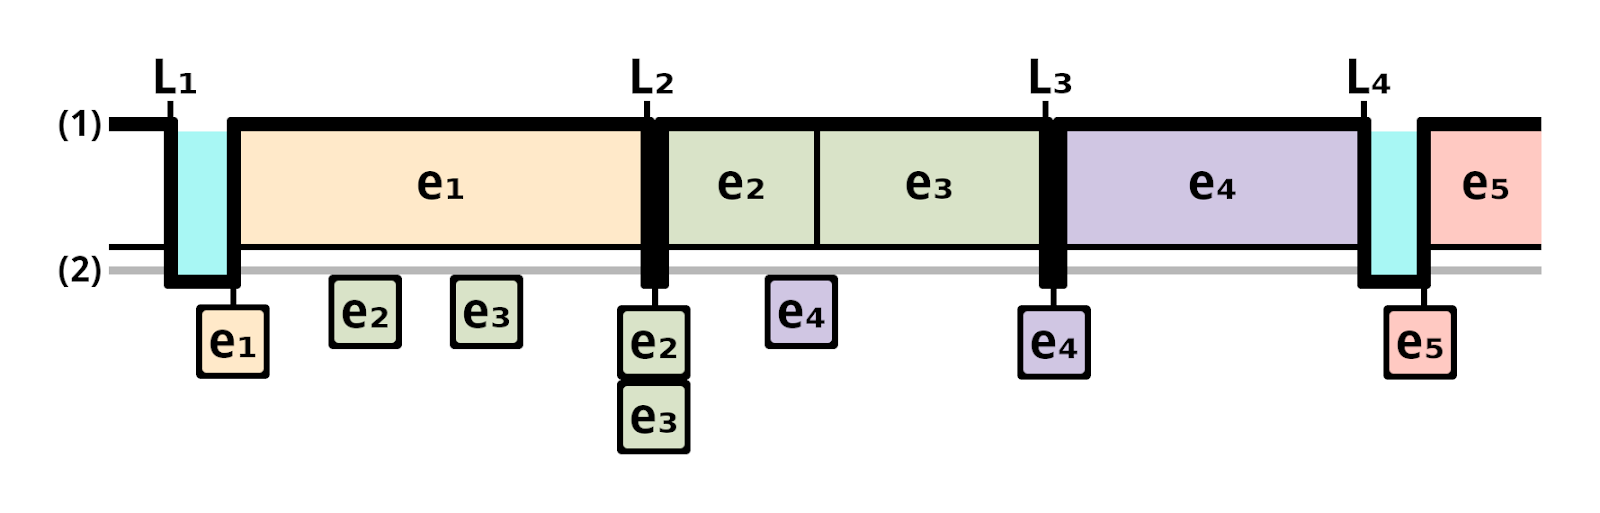
This graphic is a timeline of receiving and processing events. (1) is the event handler (the part that calls the callback associated with the event) and (2) is the event queue, the mechanism that holds onto events until they're ready to be received by the event handler (also referred to as the "task queue" or the "callback queue").
Events are retrieved from the event queue via a call to the event provider (such as epoll_wait). The dark line represents the execution stack. Since this is simplified it is either processing an event or waiting idle for an event to be placed in the event queue. The time between two event provider calls is a "loop iteration" (sometimes incorrectly referred to as a "tick").
Now to step through the timeline in the above diagram.
L₁ through L₄ are each event loop iteration. e₁ through e₅ represent individual events received and processed.
L₁: the event provider is entered. no events are waiting in the event queue so the event loop becomes idle. when e₁ is placed on the event queue and immediately received by the event handler and processed. while e₁ is being processed, e₂ and e₃ are placed on the event queue.
L₂: the event provider is entered. events e₂ and e₃ have already been received and are waiting to be processed. they are immediately received by the event handler and processed. while e₂ and e₃ are being processed, e₄ is placed on the event queue.
L₃: e₄ is immediately received by the event handler and processed.
L₄: No events are waiting in the event queue so the event loop remains idle until event e₅ arrives.
One important thing to note is that the event handler (or Node) doesn't know when an event is placed in the event queue. Considering this, we can see the actual delay in processing an event occurrs when the event is placed on the event queue until it can be processed. How to calculate the delay from when an event is placed in the event queue until the event provider receives it is also part of my research, which I plan to share in a future blog post.
Also, notice there is no accumulated idle time for event provider calls when an event is already in the event queue. The reason idle time does not accumulate is that the event provider never actually idles. Instead, the duration of time in the event provider is busily retrieving events.
As a quick recap of all the operations that take place in a single loop iteration:
- An event is placed in the event queue (this is independent of the event loop's execution state).
- The event provider is entered (e.g. epoll_wait() is called).
- If there are one or more events (e.g. file descriptors) in the event queue (e.g. system kernel) then they are received by the event provider.
- If there are no events (e.g. file descriptors) in the event queue (e.g. system kernel) then the program (e.g. node.js) halts execution and waits idle until an event is received.
- The event provider passes received events to the event dispatcher. (e.g. list of file descriptors are returned by epoll_wait() to libuv)
- Implementation note: libuv uses the "reactor design pattern" in order to handle receiving multiple events simultaneously and dispatching them synchronously.
- The event dispatcher (e.g. libuv) calls the event handler for each event (e.g. libuv calls each file descriptor's callback).
- While this is usually done by calling the associated callback, other operations can be performed such as filtering out file descriptors that are no longer needed.
- Once all events are dispatched the event loop has completed a single loop iteration and the event provider is re-entered.
ELU vs CPU
CPU is no longer enough of a measurement to scale applications. Other factors such as garbage collection, crypto, and other tasks placed in libuv's thread pool can increase the CPU usage in a way that is not indicative of the application's overall health. Even applications that don't use Worker threads are susceptible to this issue.
In addition, there is no cross-platform way of measuring the CPU usage per thread, which doesn't mean that CPU is useless. Further down, we will see that using CPU and event loop utilization (or ELU) is crucial to see if an application is reaching hardware limitations. But not being able to gather metrics on a per-thread basis drastically limits our ability to determine when the application is reaching its threshold.
Below are a set of graphs of several scenarios where ELU and CPU show different results that impact our ability to understand the process's health and when it should scale. All the graphs were generated by running an HTTP server that emulated different types of workloads.
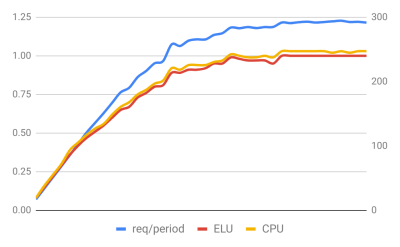
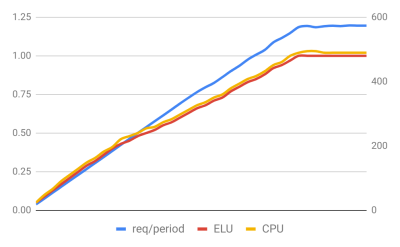
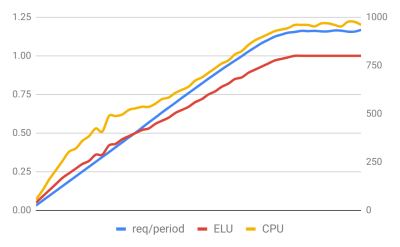
Let's start with a quick explanation of what each graph contains. The left vertical axis and red and yellow lines show ELU and the CPU usage. The right vertical axis and blue line are requests per period, which means the number of requests collected during the collection interval (in this case, several seconds)—the reason for correcting the data is to account for timing discrepancies that can occur when the event loop becomes overloaded.
The two graphs above represent the most common case that is seen in the wild. The application spends almost all execution time processing events on the main thread. The general curve of the number of requests completed is practically identical to the increase in ELU and CPU usage. In these cases, scaling the application is relatively straightforward.
As to why the scaling curve of each server is different is a topic for yet another future blog post.
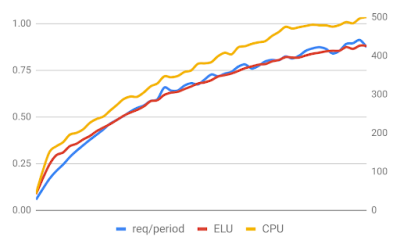
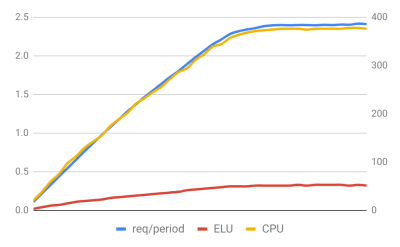
Both graphs above show different scenarios where the CPU usage is noticeably higher than the ELU.
The first graph has garbage collection issues. Each request generates a large number of objects, then retains them until the request is complete. Since each request requires making more than one call to an external service, the server holds onto the set of generated objects long enough to give the garbage collector heartburn. Fortunately, V8 performs garbage collection off the main thread, but we are not taking advantage of a great feature in V8 by scaling too early unless we account for this.
The second graph is an HTTPS server that does additional crypto work after the request is made. These operations are done in the SSL library and off the main thread, causing the CPU usage to reach the scaling threshold sooner than it should.
Both of these graphs are examples of using Worker threads to generate some complex templates to complete the request. These two graphs are the same process but notice the CPU usage in the first graph. While the first graph has a very similar scaling curve as the number of requests/period, it reaches its maximum throughput at 250% CPU.
The second graph shows the main thread never exceeding 50% ELU. In this scenario, using CPU usage as the scaling factor is pointless since the server will start to scale at only one-third of its actual maximum capacity. At the same time, it would be impossible to predict when the application should scale based on the ELU of just the main thread. It's necessary to look at the ELU of all threads and make scaling predictions based on that.
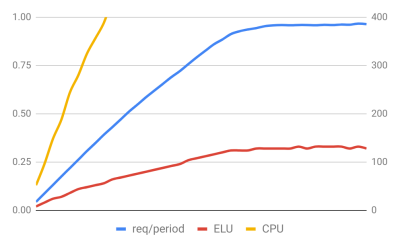
This graph shows an intriguing and unusual scenario. It is the same application as the above that uses Worker threads, but it is run in a container with limited CPU resources. Using the data gathered from both the CPU and ELU, we can determine that this process's limiting factor is the amount of allocated hardware. Though, to detect the problem, it is necessary to know when total CPU usage reaches the limits of available hardware resources.
This final graph shows the inverse problem of everything we've looked at so far. Notice that ELU is far higher than CPU. The server is doing synchronous file system writes to an NFS mount that has been opened for reading and writing in synchronous mode (rs+). Writing to a file opened in synchronous mode prevents the kernel from buffering data and only returns once the file is fully written. If the synchronous fs module API's are used, and because the file is located over a network, the process is stuck idling until the file has been fully transferred and written.
Examples using ELU
With this understanding we should now be ready to look at some simple examples of using ELU.
The ELU API has three forms.
const { eventLoopUtilization } = require('perf_hooks').performance;

// Get the ELU from the start of the thread.
const elu1 = eventLoopUtilization();

// Get the ELU between now and a previous point in time.
eventLoopUtilization(elu1);

// Get the ELU between two previous points in time.
const elu2 = eventLoopUtilization();
eventLoopUtilization(elu2, elu1);
The following is an example of how to report the loop utilization at set intervals to an external metrics collector:
const { eventLoopUtilization } = require('perf_hooks').performance;
let lastELU = eventLoopUtilization();

setInterval(() => {
  // Store the current ELU so it can be assigned later.
  const tmpELU = eventLoopUtilization();
  // Calculate the diff between the current and last before sending.
  someExternalCollector(eventLoopUtilization(tmpELU, lastELU));
  // Assign over the last value to report the next interval.
  lastELU = tmpELU;
}, 100);
Remember that the reported ELU is Worker specific, so calling it from a worker thread will report the ELU for each specific thread. Here is an example reporting the ELU from a worker via a message channel at regular intervals so we can monitor the health of the worker.
const { isMainThread, Worker, MessageChannel, parentPort } = require('worker_threads');
const { eventLoopUtilization: elu } = require('perf_hooks').performance;

if (!isMainThread) {
  parentPort.once('message', (msg) => {
    let lastMetrics = elu();
    // Setup the interval that will report ELU metrics to the parent thread.
    setInterval(() => {
      const tmpMetrics = elu();
      msg.metricsCh.postMessage(elu(tmpMetrics, lastMetrics));
      lastMetrics = tmpMetrics;
    // Unref this so it doesn't accidentally keep the worker alive.
    }, 100).unref();
  });
  // Other worker stuff here.
  return;
}

const worker = new Worker(__filename);
const metricsCh = new MessageChannel();
// Send the channel to the worker thread to receive metrics.
worker.postMessage({ metricsCh: metricsCh.port1 }, [ metricsCh.port1 ]);
// Listen for those metrics.
metricsCh.port2.on('message', (metrics) => {
  console.log('metrics', metrics);
});
Now, all of the above code is sort of a pain. So I recently landed a new API in Node that allows thread-safe access to the ELU in spawned Worker threads.
const { Worker } = require('worker_threads');
const worker = new Worker('./some_worker.js');

setInterval(() => {
  // Check the worker's usage directly and immediately. The call is thread-safe
  // so it doesn't need to wait for the worker's event loop to become free.
  worker.performance.eventLoopUtilization();
}, 100);
Using this it is now possible to monitor the state of each Worker thread independent of its state. This will make it easier to write code that monitors Worker threads so they can be automatically maintained.
This post was mainly meant to cover the reasons why I added ELU, how to interpret the metric and some simple implementation. Look forward to future posts about more in depth information on how to use ELU in your applications, and how to use it to help you scale.
Terminology
This includes terms that are commonly used, but have been included for consistency. Terms that have not been used in this blog post have also been included as they will be used in future blog posts.
event loop: a programming construct that pauses execution of the program while waiting to receive an event that has been placed on an event queue. The event is then dispatched for further processing.
event: an entity that encapsulates an asynchronous task and passed as a contextual variable by an event handler to a callback to be handled by the program. Events are also referred to as messages.
event queue: a construct that holds a reference to the event upon completion of an action or task and prior to being received by an event provider.
event dispatcher: a mechanism to dispatch an event received by the event provider to the program. Usually, but not always, by calling the event handler associated with the event. This is synonymous to "processing the event".
event handler: the mechanism that handles calling the callback associated with an event.
callback: any executable code passed as an argument to other code and that is expected to be called or executed later at a given time.
event provider: a mechanism used to pause execution of the event loop and wait for an event to be placed on an event queue. Received events are then dispatched by the event dispatcher.
event provider request: a request made by the event loop to the event provider. A timeout may be given to the event provider request at the time of execution. The timeout is a maximum duration of time the event provider remains idle before returning execution control back to the program.
event loop iteration: a single execution of the event loop; beginning at a first event provider request; ending at a subsequent event provider request.
event loop phase: a single phase of the event loop as it relates to libuv's implementation details; such as timers, poll, close callbacks, etc.
event loop subphase: is the execution of the next tick queue and microtask queue, which occurs at the end of all event loop phases.
event loop duration or loop duration: a duration of time required to execute the loop iteration.
events processed: a quantity of events processed by the event handler upon return of the event provider request for a single loop iteration.
event loop idle time: a duration of time the event provider spends idle during the event provider request for a single loop iteration.
event loop processing time: an aggregate duration of time taken to process all events in a loop iteration, and is equal to the loop duration minus the loop idle time.
event loop utilization: the ratio of time the event loop is not idling in the event provider to the total time the event loop is running, and is equal to the loop processing time divided by the loop duration.
event provider delay: a duration of time starting at the time an event is placed in the event queue and ending when the event is received by the event provider.
event processing delay: a duration of time when an event is received by the event provider until the event is processed by the program.
loop events processed: a quantity of events that are processed for a loop iteration, or the quantity of events dispatched to the event handler for a loop iteration.
loop events waiting: a quantity of events that were immediately available to be received by the event provider upon the provider request.