Generating statsd metrics from N|Solid
N|Solid provides a gorgeous and functional web-based console that you can use to monitor your Node.js applications. But what if you're already using some other monitoring product to monitor your applications? It would be nice to be able to augment that monitoring product to be able to show some N|Solid-specific metrics, as well, such as the amount of heap used and total heap allocated for an N|Solid process.
We recently released the nsolid-statsd package on npm, which can do exactly that, if your monitoring tool can handle statsd metrics. The nsolid-statsd package provides a server which you can point at an N|Solid Hub, to pull metrics from N|Solid processes, and then emit statsd metrics to a statsd server. The flow is shown below:
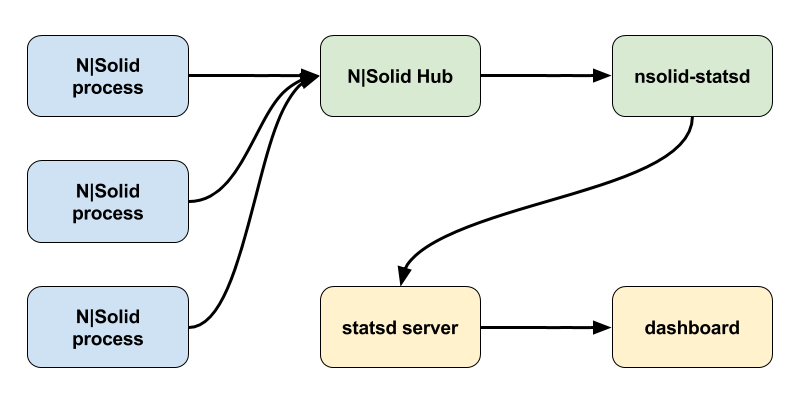
- The blue boxes represent N|Solid processes that you are monitoring, which are generating metrics.
- The green “N|Solid Hub” box aggregates the metrics from the N|Solid processes.
- The green “nsolid-statsd” box requests the aggregated metrics from the N|Solid Hub
- The yellow “statsd server” box receives the statsd formatted metrics sent to it from nsolid-statsd.
- The yellow “dashboard” box is the visualization of the metrics available from statsd, probably as a web-based user interface.
I used DataDog as an example statsd server and dashboard (yellow boxes above) while developing this package. DataDog is a very easy to use monitoring-as-a-service provider, that provides a two week free trial. You can install their agent on your system, which will send various system-level statistics to their servers, and also installs a local statsd server which forwards statsd metrics to their servers.
You can install nsolid-statsd with the command:
npm -g install nsolid-statsd
If your N|Solid Hub is running at nsolid-proxy.example.com:9000, you can then start sending metrics from all your N|Solid processes to the DataDog agent running on your system, with the command:
nsolid-statsd : nsolid-proxy.example.com:9000
The first parameter - : - is the address of the statsd server; in this case the default localhost:8125 is used. The second parameter is the address of the N|Solid Hub.
The statsd metrics that nsolid-statsd emits come from the N|Solid agent commands process_stats and system_stats. The mappings of the N|Solid metric names to the statsd metric names is listed in the documentation under statsd metric names. For instance, the "heap used" metric will be mapped to the name {prefix}.{app}.process.heapUsed, where the default prefix is nsolid, and {app} will be replaced with the N|Solid application name. So, for the N|Solid application name FooFrontEnd, statsd will be sent metric values named nsolid.FooFrontEnd.process.heapUsed.
I built the DataDog dashboard below, in just a few minutes, using just N|Solid metrics:

For two different apps - Marvelous Maple and Pretty Pine - I show the following things:
- graph showing async handles and async requests
- graph showing heap used and heap total
- current CPU usage, that changes background from green/yellow/red as the CPU usage hits certain values
- current rss, that changes background from green/yellow/red as the rss usage hits certain values
- nifty image of a tree at the bottom
If you're making use of the new N|Solid tags feature, and your statsd server accepts the statsd tags extension (DataDog does), your N|Solid tags will be available as part of the statsd metrics, if you use the --tags option when you run nsolid-statsd.
The source for nsolid-statsd is hosted at GitHub, licensed under the MIT license. If you’d like to contribute in any way, please refer to our contributing document. We are particularly interested in looking at ways of adapting this program for other monitoring solutions. Also, feel free to open an issue on nsolid-statsd if you have bug reports, questions about the way it works, or if you have new feature requests.