Is Guy Fieri in Your Node.js Packages?
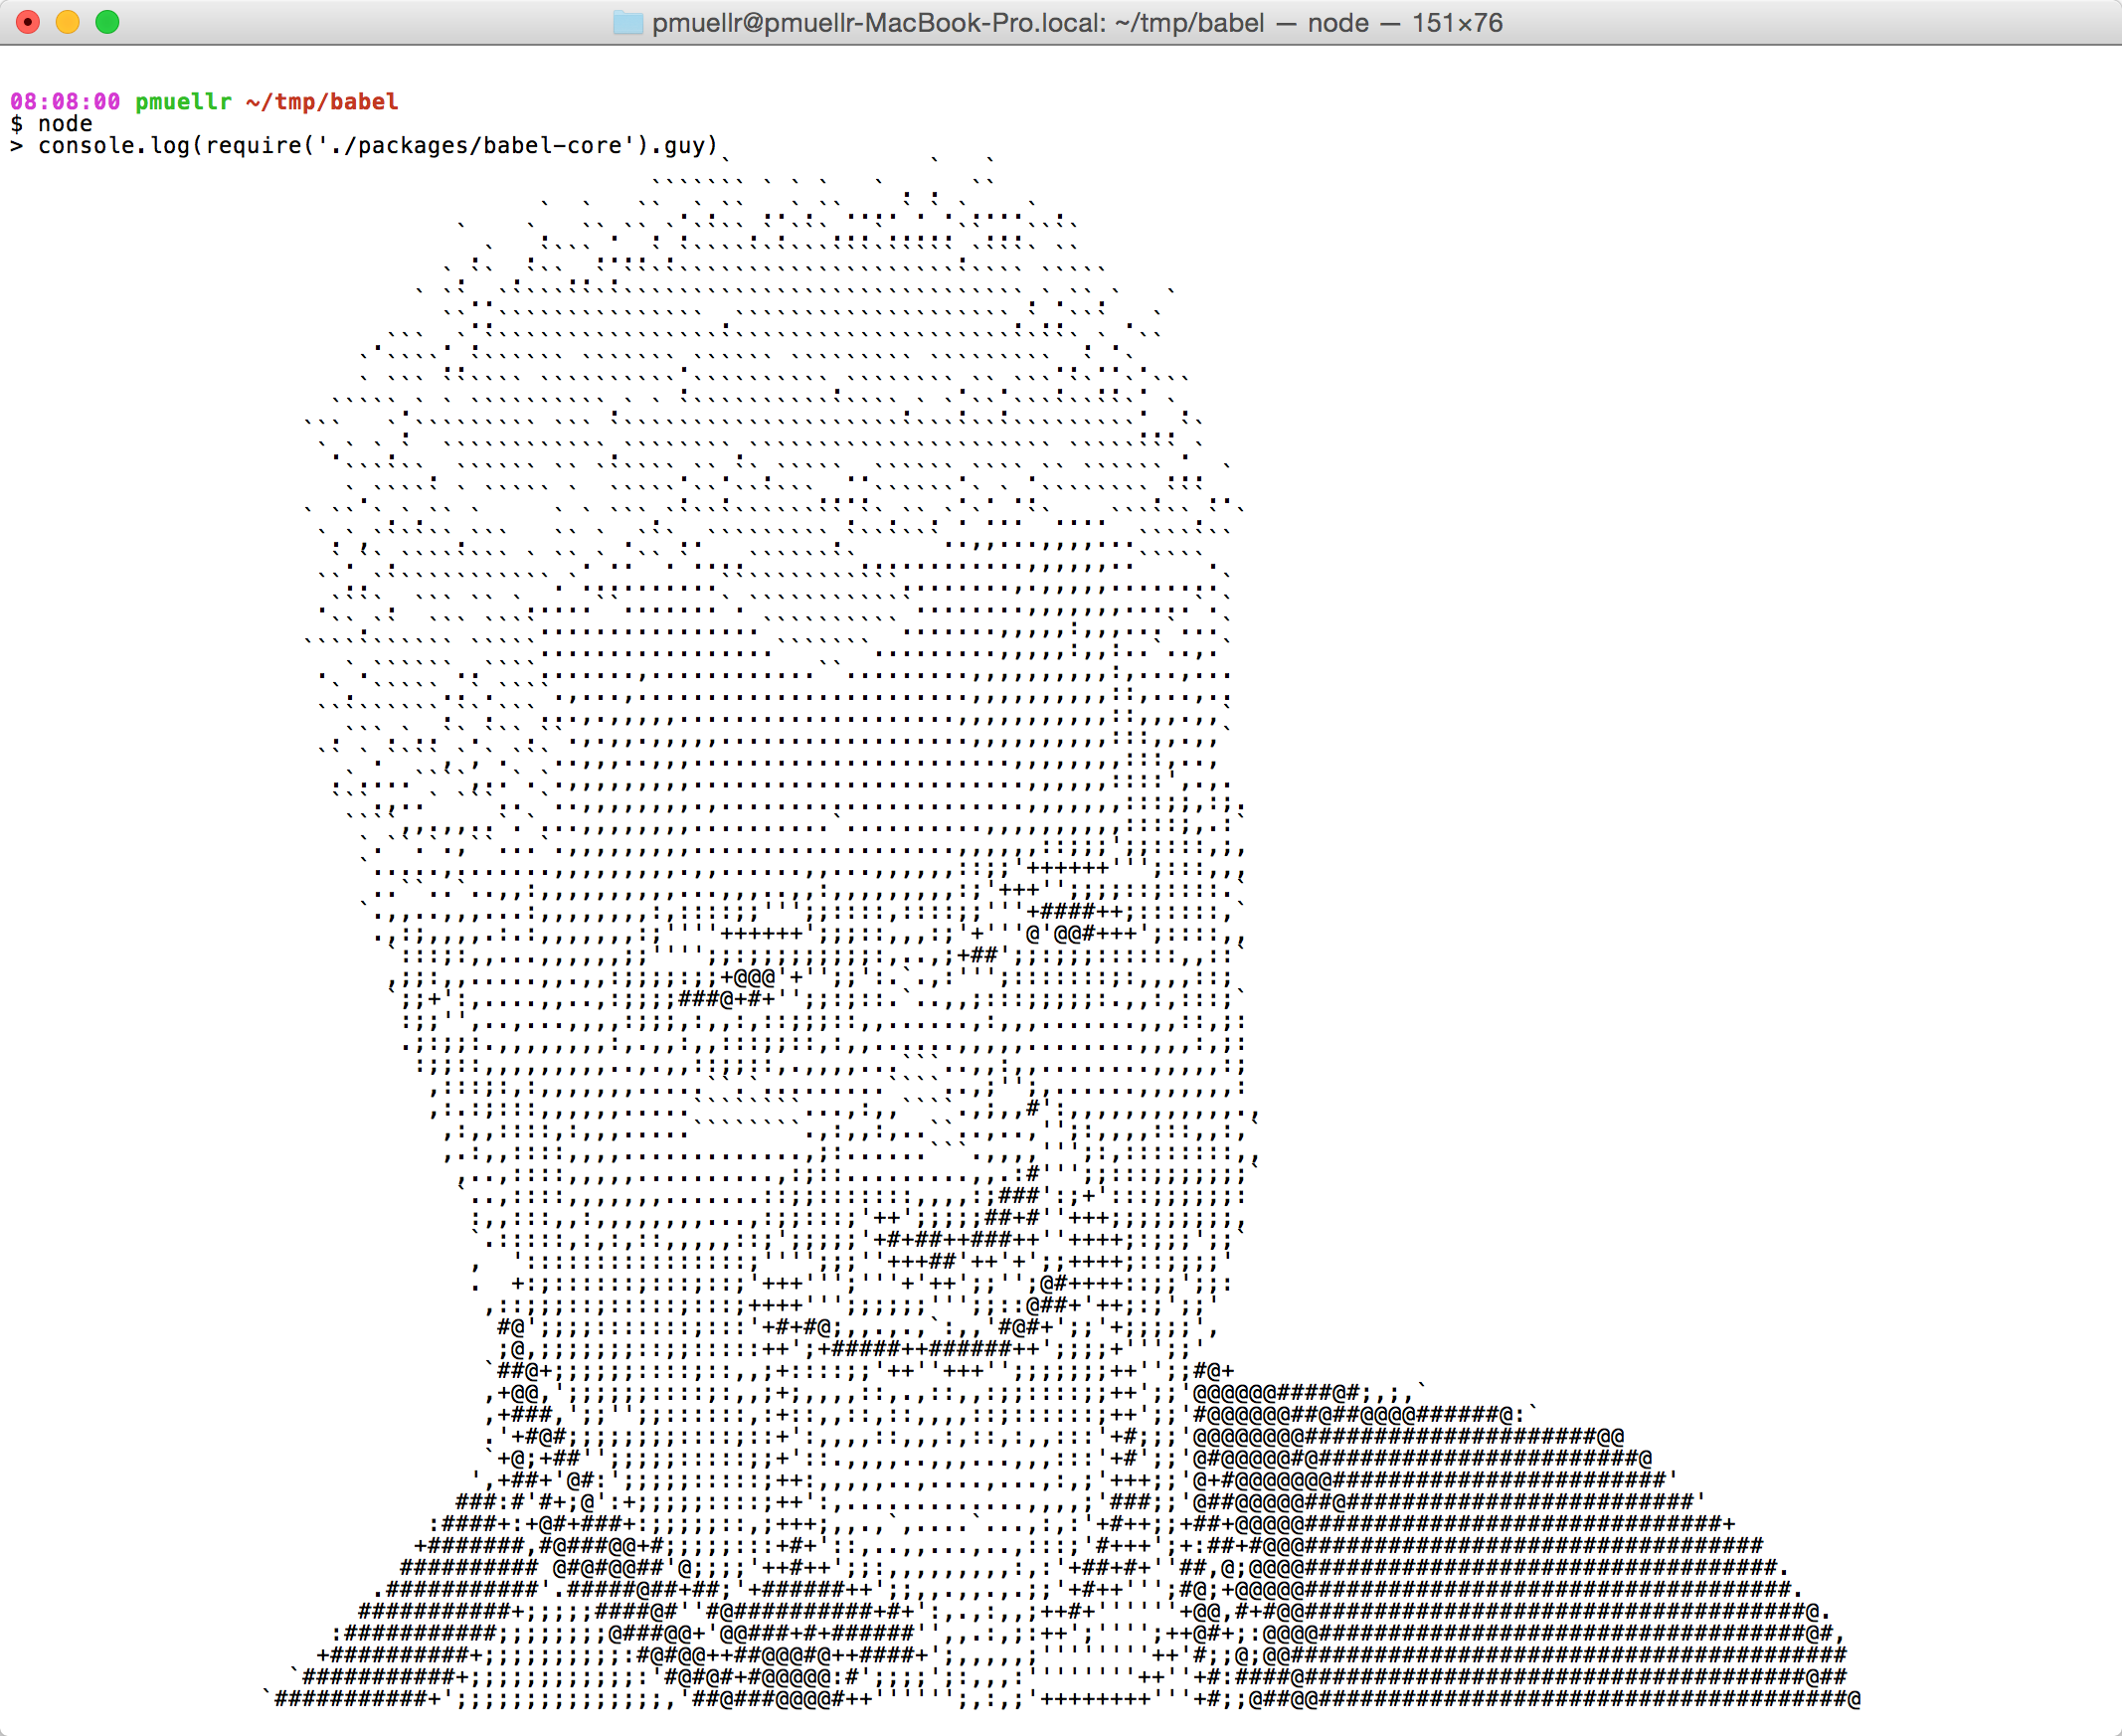
A recent satirical blog post at Medium claimed that an image of Guy Fieri is embedded in the babel-core package. Don't worry, the author was just having some fun, there is most definitely NOT an image of Guy Fieri embedded in the babel-core package. Or is there?

The blog post, while funny, does make a point, and should get you thinking about the packages your application is using. Do you even know all the packages your application is using? You are likely familiar with the top-level packages your applications use, that are listed in your package.json's dependencies. But that's just the tip of the iceberg. What do those packages depend on?
N|Solid can help you out here. The N|Solid CLI provides a package_info command that returns the list of all the packages that have been loaded by a running application, along with the version number, dependencies, and package location on disk for each of those packages. The N|Solid Console makes use of this command as part of the security vulnerabilities feature.
Let's take a look at the output of the package_info command, by running it against a small node module.
This module, sample_1.js, uses the async and lodash packages available from npm:
'use strict'

require('async')
require('lodash')

console.log('just waiting for you to press Ctrl-C ...')

setInterval(function () {}, 1000)
Here's a corresponding package.json file, to get the async and lodash packages loaded into your node_modules directory, for use in sample_1.js:
{
  "name": "sample_1",
  "version": "1.0.0",
  "dependencies": {
    "async": "~2.0.1",
    "lodash": "~4.14.2"
  }
}
Now let's run the program with N|Solid. If you don't already have N|Solid installed, you can install it by following the directions on the N|Solid Quick Start page.
$ NSOLID_APPNAME=sample_1 NSOLID_HUB=2379 nsolid sample_1
just waiting for you to press Ctrl-C ...
Leave that program running, and open another terminal window to run the commands indicated below.
When you run the nsolid-cli ls command, you should now see the sample_1 application:
$ nsolid-cli ls
...
{"pid":35218,"hostname":"...","app":"sample_1","address":"...","id":"<id>"}
...
Now let's run the package_info command, by using the value of the id property from the ls command above, as the value of the <id> argument below:
$ nsolid-cli --app sample_1 --id <id> package_info
...
The output should be similar to what's shown below, after being expanded out for readability:
{
  "packages": [
    {
      "path": "/path/to/sample_1",
      "name": "sample_1",
      "version": "1.0.0",
      "dependencies": [
        "node_modules/async",
        "node_modules/lodash"
      ]
    },
    {
      "path": "/path/to/sample_1/node_modules/async",
      "name": "async",
      "main": "dist/async.js",
      "version": "2.0.1",
      "dependencies": [
        "../lodash"
      ]
    },
    {
      "path": "/path/to/sample_1/node_modules/lodash",
      "name": "lodash",
      "main": "lodash.js",
      "version": "4.14.2",
      "dependencies": []
    }
  ]
}
Note that, for brevity, I have removed two other properties that each packages array element has: main and modules.
Understanding package_info output
Let's unpack what's going on here:
- As expected, we have three packages:
sample_1,async, andlodash - Each package has a
dependenciesproperty array, whose elements are the package-relative path to the dependent package - Those
dependencieselements, when resolved against thepathof the project they are in, yield a new path, which will be thepathproperty of one of the other top-levelpackageselements - For example, for
async's dependency oflodash, you would... -
- Resolve
../lodashagainst/path/to/sample_1/node_modules/async,
- Resolve
-
- That would yield
/path/to/sample_1/node_modules/lodash,
- That would yield
-
- Which is the
pathproperty of the lastpackageselement
- Which is the
Following this process, you can construct a graph data structure, where each package points the exact package it depends on.
You might not think the paths of the packages is an important aspect of the output. Can't you just deal with the package name and version number? It's possible, however, for Node to load multiple copies of the same version of a package, located in different paths. This is known as a duplicated (a.k.a. duped) package. In a perfect world, your application wouldn't have any duplicated packages. In reality, the more packages your application uses, the better the chance is that you'll have duplicated packages.
There is an npm subcommand, dedupe, that can fix issues with duplicated packages, by moving those packages further "up" in the dependency graph, so that more packages can access the same version package, instead of having their own copy in their node_modules directory. This has been mitigated to some extent with npm version 3, which does a better job of preventing duplicated packages from being created in the first place.
Visualizing data graphs
The output above showing three packages is something a human can look at and make sense of fairly easily. However, your application is probably made up of more than three packages! To analyze the package dependencies for anything other than very small programs, you're going to need some kind of tool that slices and dices that data, and presents it in an easier to understand way. These package dependencies form a nice graph data structure, so tools that deal with graphs will be useful.
One of my favorite tools for analyzing data graphs is GraphViz. With GraphViz, you can create a sample.dot file with the following contents, which matches our sample output above in terms of the dependencies:
digraph packages {
    "sample 1.0.0" -> "async 2.0.1"     // sample depends on async
    "sample 1.0.0" -> "lodash 4.14.2"   // sample depends on lodash
    "async 2.0.1"  -> "lodash 4.14.2"   // async  depends on lodash
}
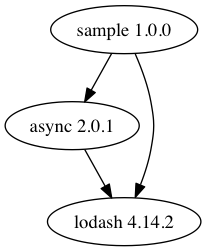
This defines three nodes in the graph, each named with the package name and version. The operator -> indicates that there should be a directed connection between the two nodes. In this case, the connection means "depends on".
You can then create a PNG image from the .dot file, by using the GraphViz command line program dot:
dot -T png -o sample.png sample.dot
The resulting image is the below:

Nice!
GraphViz can handle very complicated data graphs, provides extensive styling support, and can produce output in a variety of formats. So it's possible to write a program that reads the output of the package_info command, generates a .dot file for the entire dependency graph, and then have that converted into an image.
I've published a command line tool called ns-package-graph that does exactly that. You can use the tool to create .dot, .svg, and .html files as visualizations of a particular N|Solid process. The tool collects the package_info data, morphs that into a nice GraphViz .dot file, and then uses the Emscripten-ized version of GraphViz to create an .svg file. It will optionally create an .html file, which embeds the .svg contents in a small HTML wrapper. Although you can usually view SVG files in a web browser, the HTML file that the tool generates provides a better experience.
Using ns-package-graph with an N|Solid application
Let's walk through using ns-package-graph on a slightly more complex application than our first sample.
Here's the new sample module, sample_2.js:
'use strict'

const path = require('path')

require('request')
require('express')

process.title = path.basename(__dirname)

console.log('just waiting for you to press Ctrl-C ...')

setInterval(function () {}, 1000)
Here's the corresponding package.json:
{
  "name": "sample_2",
  "version": "1.0.0",
  "dependencies": {
    "express": "~4.14.0",
    "request": "~2.74.0"
  }
}
The difference between this and the previous sample is the packages it depends on. This sample uses the request and express packages, where the previous example used async and lodash. The async package only has a dependency on lodash, and lodash has no dependencies. The request and express packages, on the other hand, both contain a large number of nested dependencies.
Let's start the program running:
$ NSOLID_APPNAME=sample_2 NSOLID_HUB=2379 nsolid sample_2
just waiting for you to press Ctrl-C ...
To generate a package graph from this application, while it's running, run one of:
ns-package-graph sample_2               > sample_2.svg
ns-package-graph sample_2 --format html > sample_2.html
Here's a "thumbnail" of the output:

And here are links to the output files:
The HTML visualization is the easiest to navigate.
You can easily see the two subtrees for the two dependencies, and that they share some common package dependencies between them.
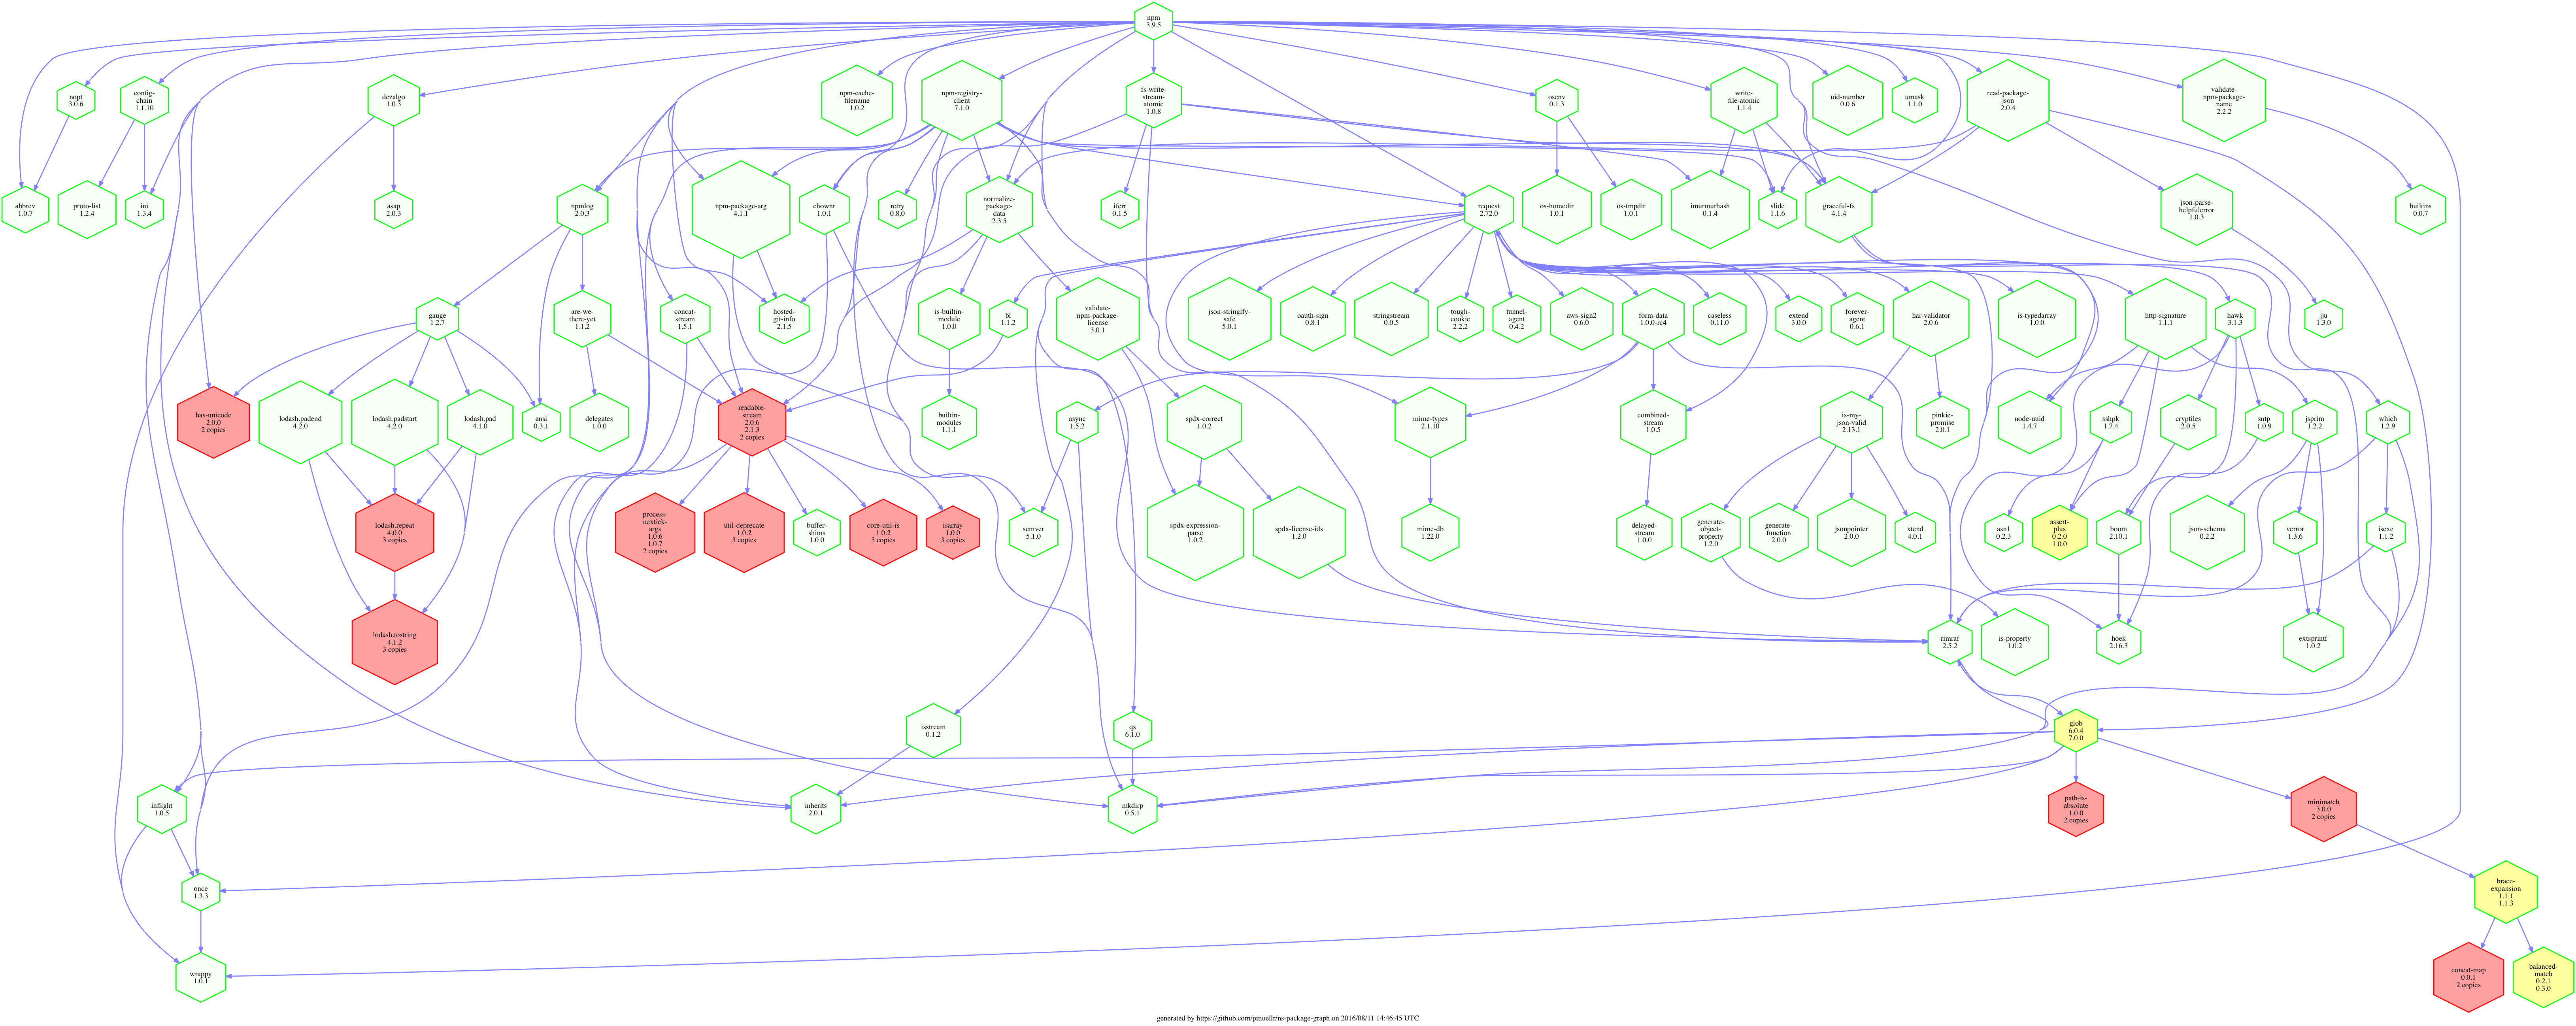
Besides showing the package dependency structure via the package "hexagons" and arrows, hexagons are drawn with one of three colored backgrounds: green, yellow, or red. Yellow and red colors indicate some amount of package duplication. Yellow means that multiple versions of a package are being used at the same time by the application. Red means that the exact same version of a specific package has been loaded at different paths.
Yellow shows an opportunity to change dependency versions of packages so that you can load a single version of a package, rather than multiple.
Red shows duplicated packages as described above - there should probably only be one copy of this version of the package loaded. Again, the npm dedupe command command, or using npm version 3 instead of 2, can help fix and prevent duplicated packages in your application.
Here's another set of visualizations, this time for Node.js's own npm program itself:
- Output file (HTML) of an analysis of the npm module at version 3.
- Output file (SVG) of an analysis of the npm module at version 3.
- Output file (dot) of an analysis of the npm module at version 3.
- Output file (PNG) of an analysis of the npm module at version 3. (created with the
dotcommand)
A shrunken-for-the-browser version of the PNG file is below:

The ns-package-graph package is a positive first step to visualizing what packages your applications are using to optimize the size of your node_modules directory - and, thankfully, to prevent even more satirical posts on Medium. It can do a few more things than I've outlined here - you should check out the GitHub repo for more information.
We’d love to see what you create. Tweet at @NodeSource with the hashtag #nspackagegraph to share your package graphs.