Diagnostics in Node.js Part 2/3
If you haven’t checked out the first part of Diagnostics in Node.js, click here.
This is a 3-part blog series on Node.js. It is based on Colin Ihrig's talk at JSConf Colombia. The topics are separated by the age of diagnostic techniques - from the oldest to the newest:
- Part One: Debug Environment Variables, Warnings, Deprecations, Identifying Synchronous I/O and Unhandled Promise Rejections.
- Part Two: Tick Processor Profiling, The V8 Inspector, CPU Profiling, Heap Snapshots, Asynchronous Stack Traces.
- Part Three: Tracing, TLS Connection Tracing, Code Coverage, Postmortem Debugging, Diagnostics Reports.
Let’s begin! 🚀

Tick Processor Profiling
When dealing with web applications, we want to provide the best possible performance to our users. Using a profiler can help you identify bottlenecks leading into your application. This can further reduce the amount of time spent in a request such as accessing a database or waiting for an API call to respond.
One of those profilers is V8’s built-in sample-based profiler. Profiling is turned off by default, but can be enabled via the --prof command-line option, which dumps V8-profiler-output into a file. The sampler records stacks of both JavaScript and C/C++ code.
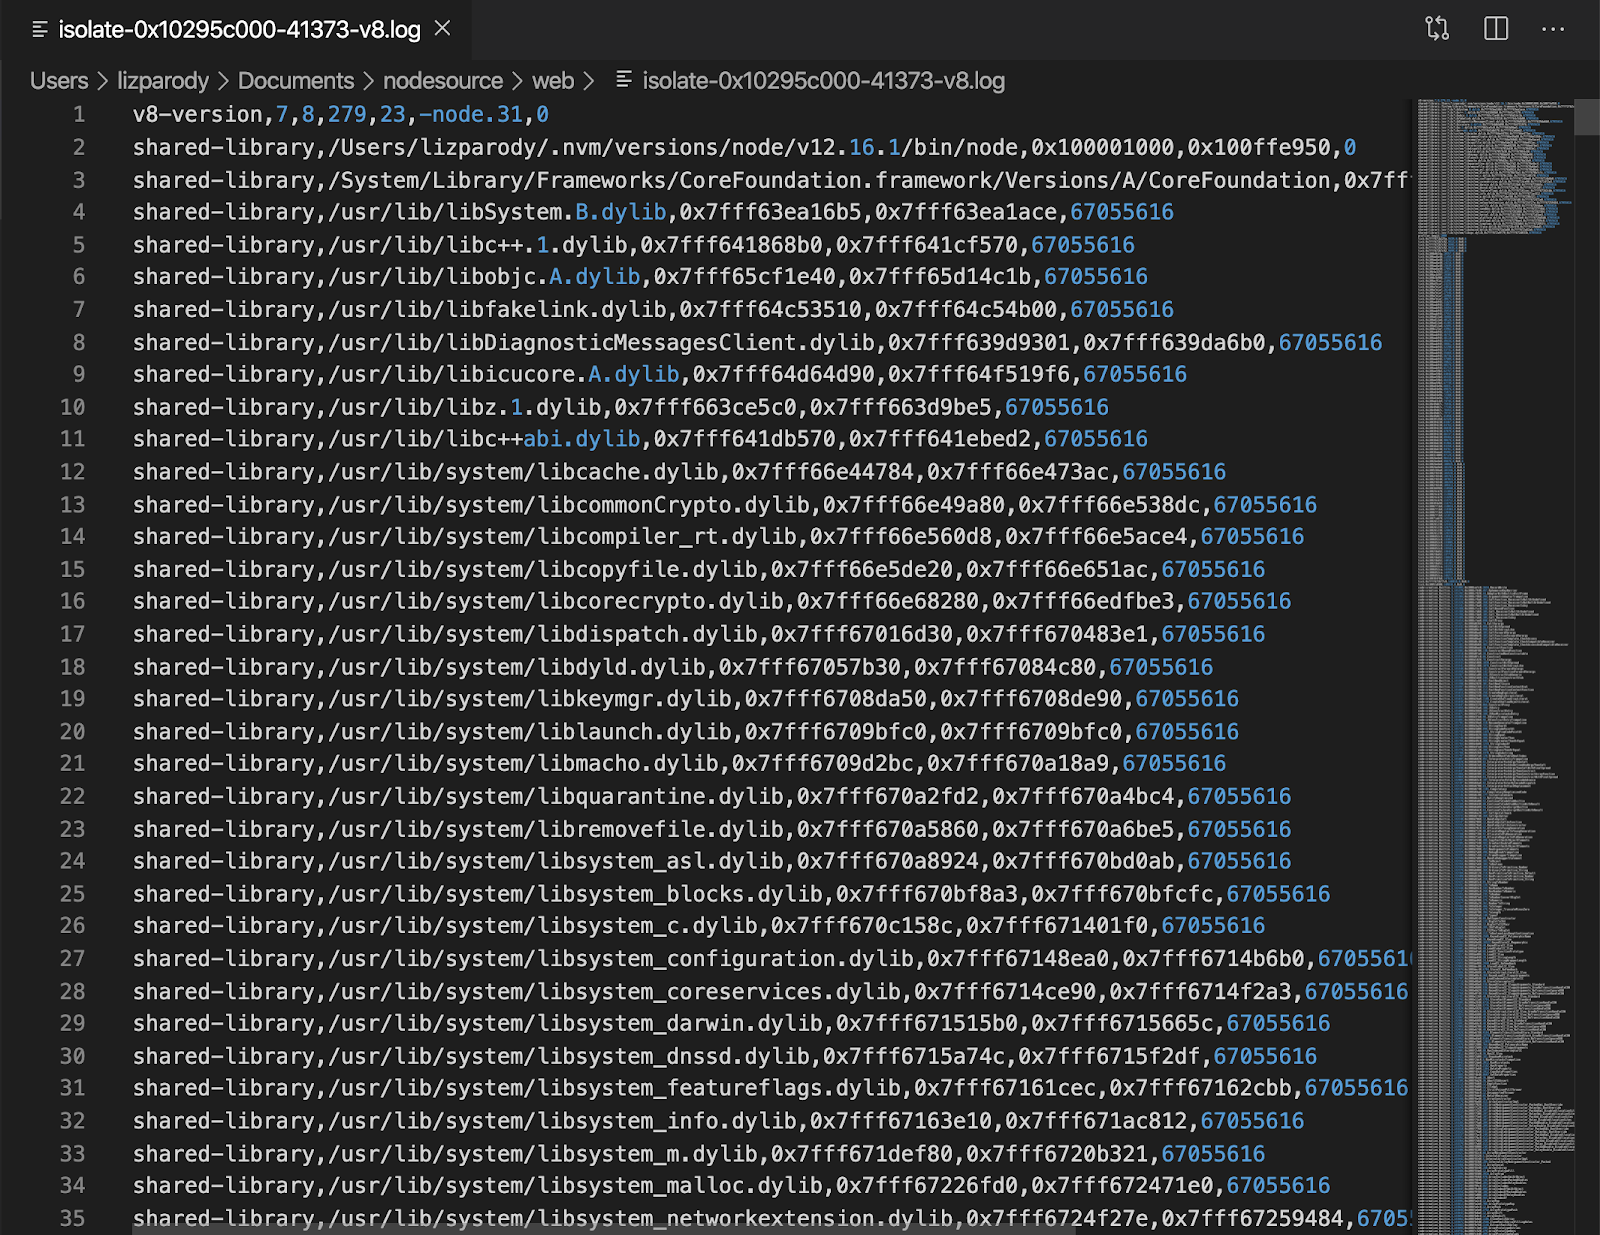
This is a 2-step process: first, you are able to profile your code as it is running. This will dump a file that is not meant to be consumed by humans: the file is called isolate-0x[numbers]-v8.log . The second step takes that output and formats it in a way that is human readable code. This can be done using the flag --prof-process.
The isolate-0x[numbers]-v8.log file looks like this:
Then you can run node --prof-process isolate-0x[numbers]-v8.log and the file will look like this:
i.e.
node --prof-process isolate-0xnnnnnnnnnnnn-v8.log > processed.txt
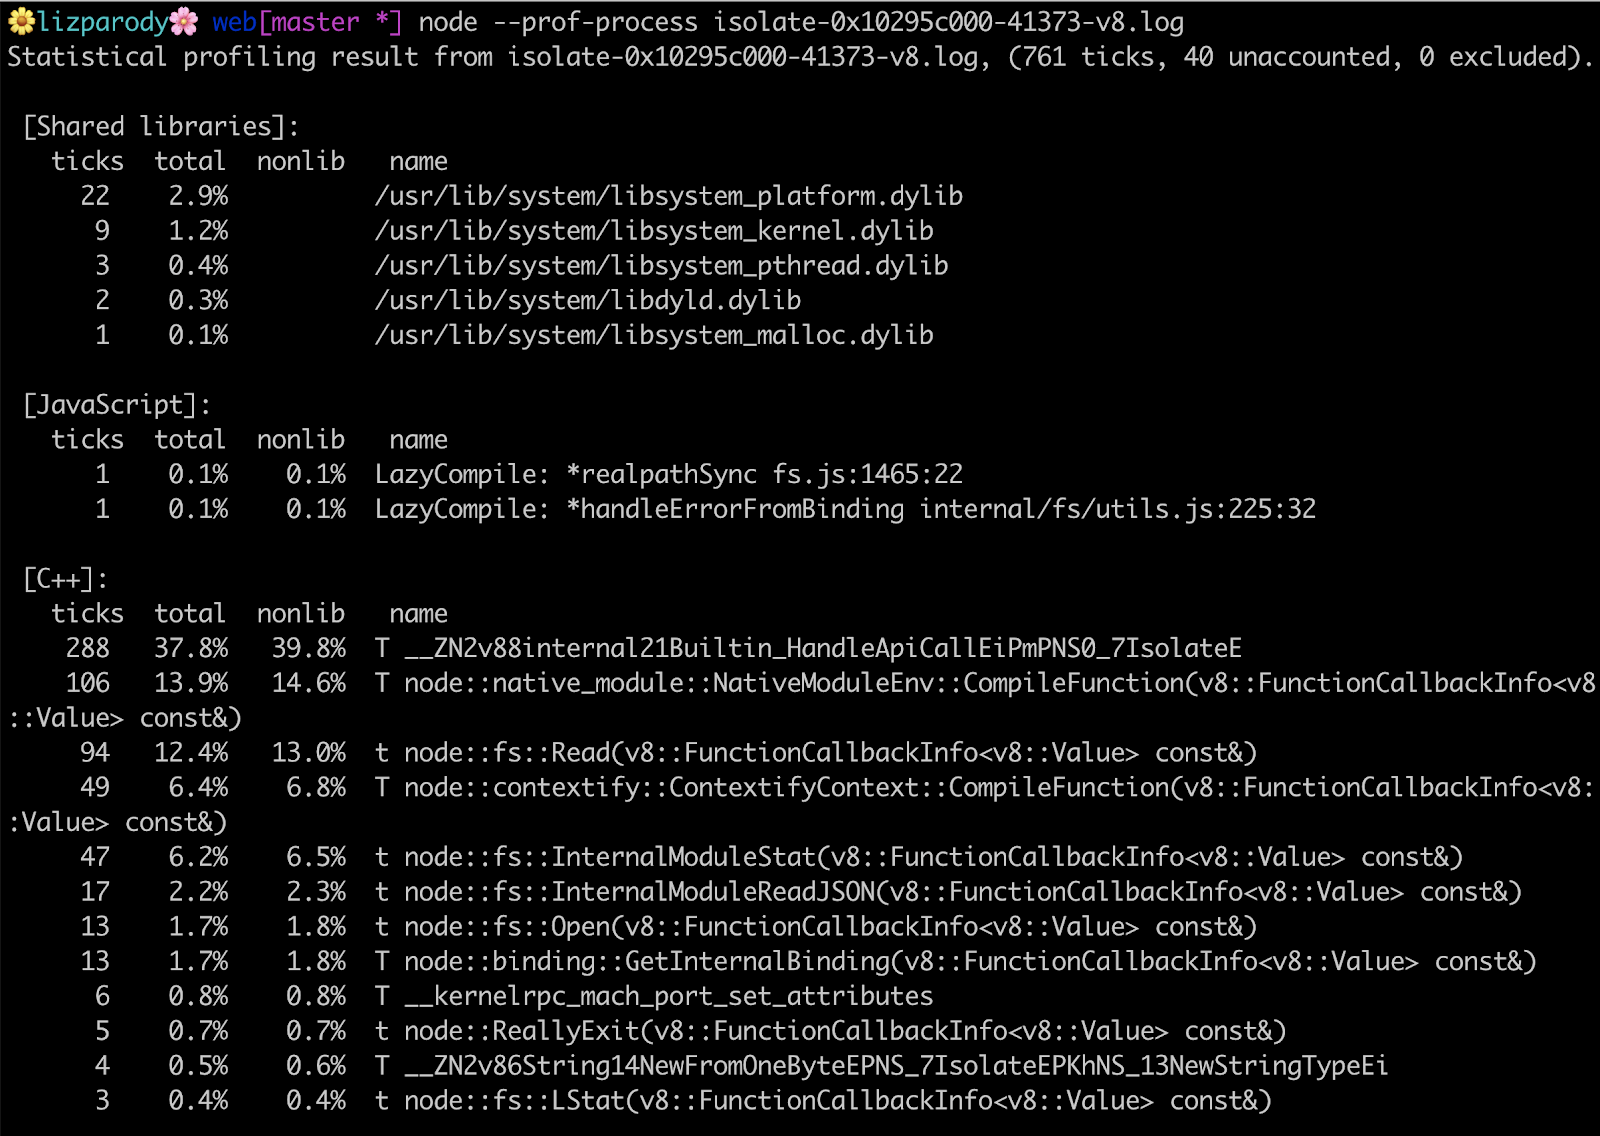
There are a lot of things going on here, but what this is basically showing is where you are spending time in shared libraries, JavaScript and C++ code.

The first line is saying that the application has used 761 ticks to execute the application. A tick is like a clock cycle used by a node process. So in theory the application took 761 clock cycles to execute. You can also find a summary section breaking down JavaScript vs C++ code.
It should be noted that in the [JavaScript] section you can see something called LazyCompile and ‘*realpathSync’. The asterisk means that V8 was able to optimize your code, so if you don’t see the asterisk there is a chance that your code is not optimized and is taking more time to execute than you realize.
The V8 Inspector
A few years ago, Chrome DevTools was integrated directly into V8, expanding its capabilities to include Node.js applications. With this integration it was possible to access step-debuggers without having to install the node-inspector module.
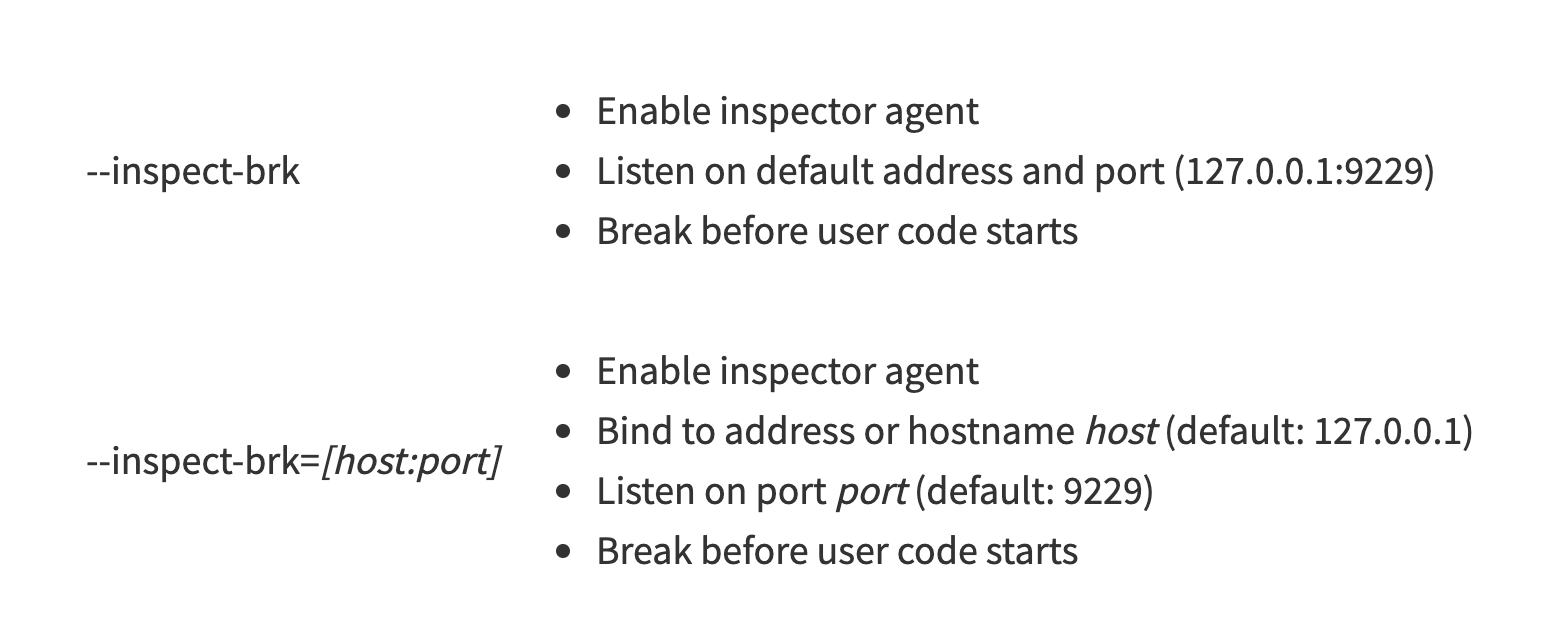
There are a few ways to get started: one is using the --inspect flag, which will start the inspector. Then, you can pass a host and a port that you want to listen to which you will connect later --inspect[=[host:]port]. If no parameters are passed, it will connect to 127.0.0.1:9229 by default.
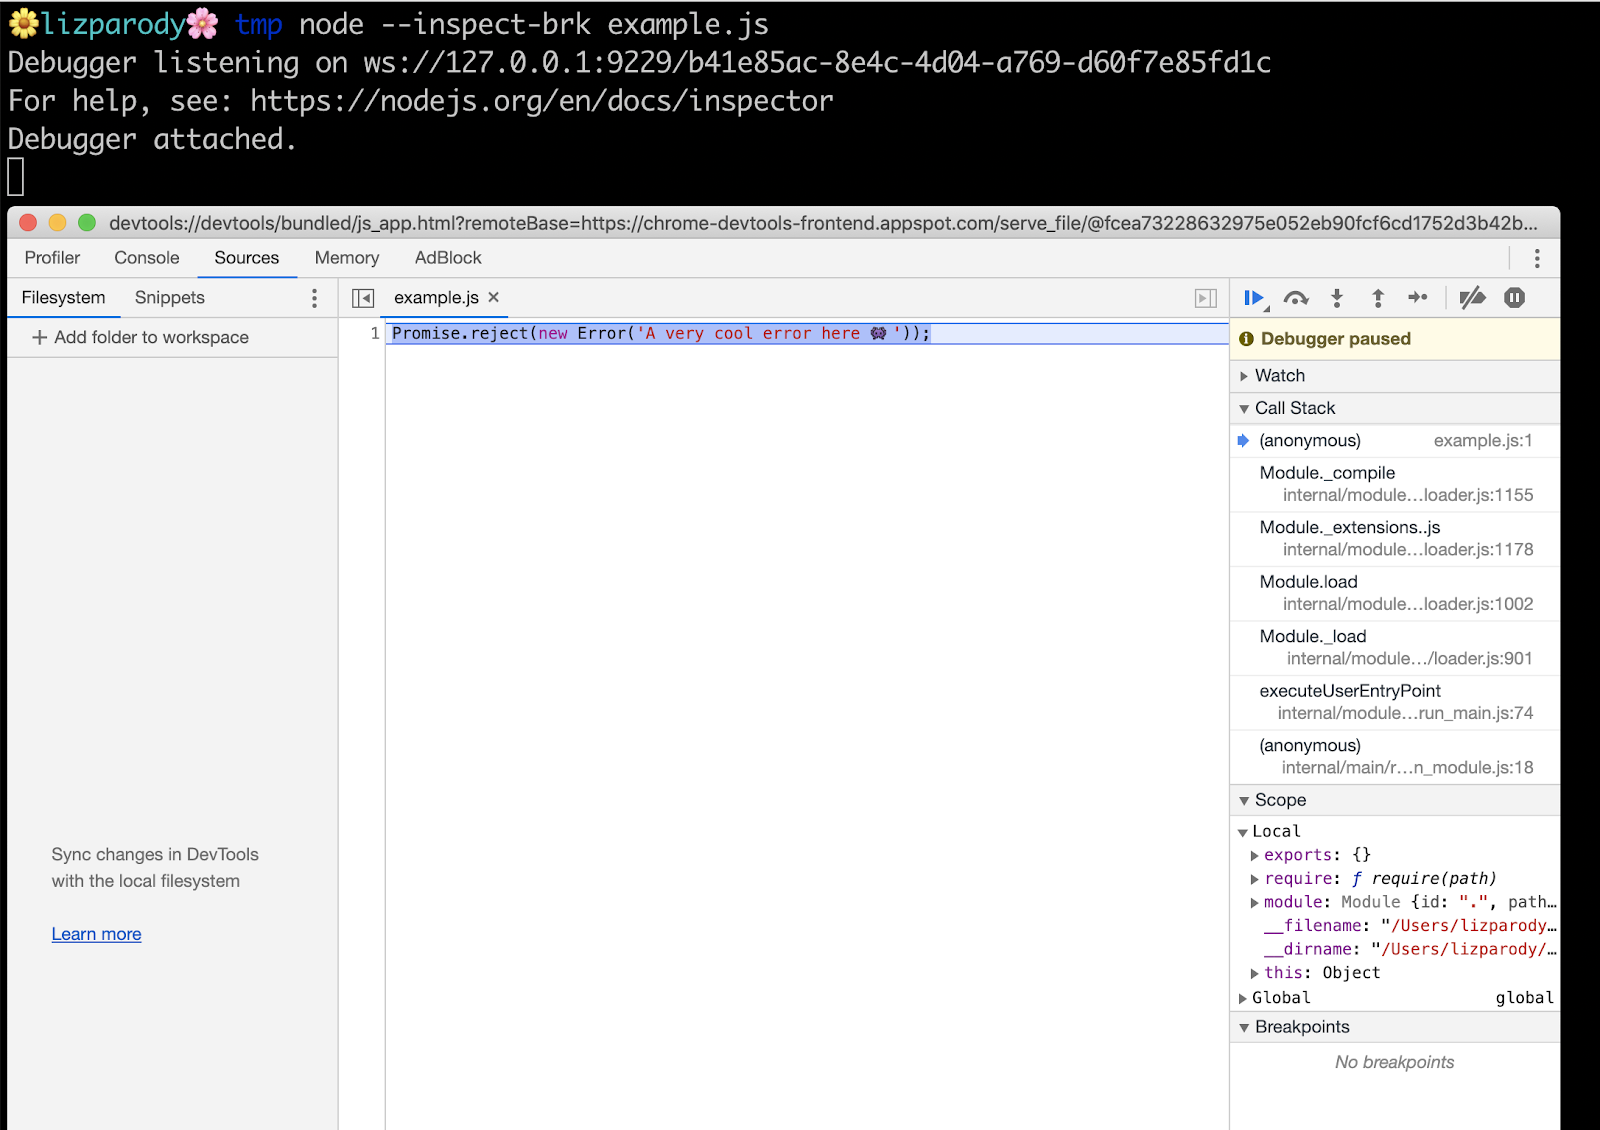
One other way is more useful when doing local development, using the --inspect-brk flag . This flag has the same options for host and port than the --inspect flag but also puts a breakpoint before the user-code starts, so you can do any type of setup you prefer without having to try/catch break points in your code at runtime.
In the example file, there is this line of code: Promise.reject(new Error('A very cool error here 👾'));
Now calling the file with the --inspect-brk flag
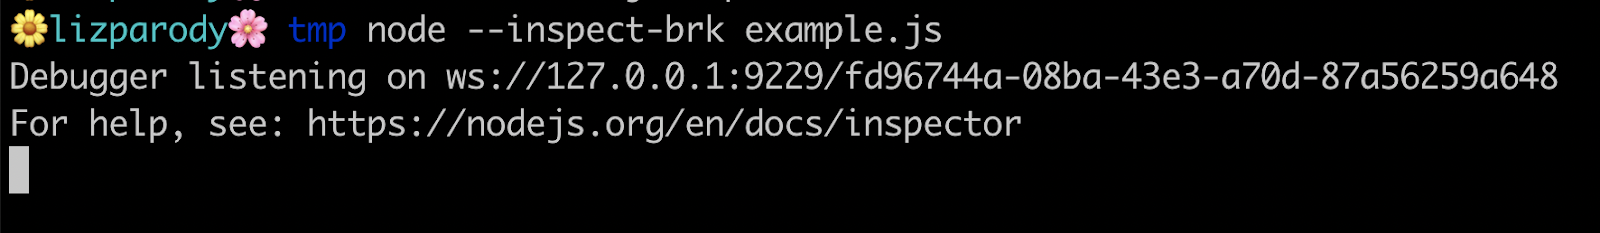
We can see the message printed in the console: Debugger is listening on ws: followed by a websocket url. Websocket makes it possible to open a two-way interactive communication session between the user's browser and a server. We can also see a message that directs users to the Node.js documentation so we understand what is happening there.
Then, if we go to the url chrome://inspect or even better about:inspect, you will see something like this:
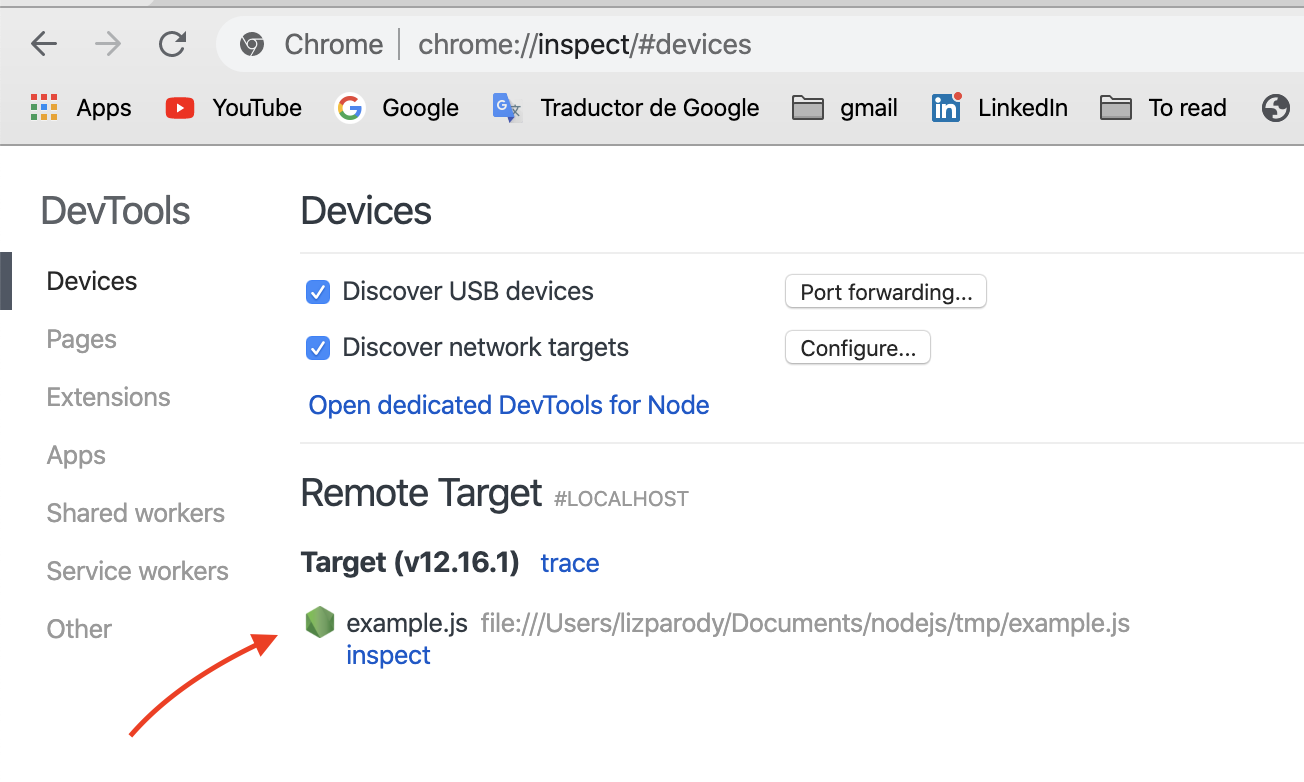
Once you click on the dedicated DevTools for Node.js link, you can see a popup window for debugging your Node.js session.
One cool feature is that when you kill and restart node, the window will automatically reconnect to it. 🔁
DevTools is now connected to Node.js, providing you with access to all the Chrome DevTools features you’re used to. This allows you to:
- Edit pages on-the-fly and diagnose problems quickly, which ultimately helps you build better websites, faster.
- Complete breakpoint debugging, stepping with blackboxing
- Access sourcemaps for transpiled code
- LiveEdit: JavaScript hot-swap evaluation with V8
- Console evaluation with ES6 feature/object support and custom object formatting
- Sampling JavaScript profiler with flamegraph
- Heap snapshot inspection, heap allocation timeline, allocation profiling
- Asynchronous stacks for native promises
However, the V8 Inspector should never be used in production because DevTools actions halt the event. This is acceptable in development, but unsuitable for production environments. If you are interested in production diagnostics: NodeSource's Node.JS for Enterprise (NSolid) is the only way to access native performance and security metrics and diagnostics that don’t incur latency in production.
The V8 inspector is super useful in development and NSolid in production environment and you should give it a try! 😉
CPU Profiling - in Dev and Prod
CPU Profiling - in Dev only
CPU Profiling allows you to understand where opportunities exist to improve the speed and load capacity of your Node processes.
One common problem inside DevTools is getting your server set up and running and then trying to start a CPU profiling session. This is problematic because when you try to kill your server and you are applying load the profiling may not work properly.
To solve that issue, the --cpu-prof flag was built directly into Node.js. This flag will start the CPU profiler and when the Node.js process exits it will write a CPU profile output to a file.
You can also use the --cpu-prof-dir flag to specify a directory where the file will be saved and --cpu-prof-name to change the name of the file. If you don’t specify those attributes, the file will be saved in your present working directory, and the name will be a combination of the date, PID, TID, sequence and will end with cpuprofile keyword.
CPU.${yyyymmdd}.${hhmmss}.${pid}.${tid}.${seq}.cpuprofile
You can also set the --cpu-prof-interval flag which is how often the sample profiler is going to sample your application. By default this is set to one millisecond. You can also use the DevTools UI to collect profiles by hand.
In other words, the --cpu-prof flag will start the V8 CPU profiler on start up, and write the CPU profile to disk before exit. If --cpu-prof-dir is not specified, the profile will be written to the current working directory with a generated file name.
This is how a cpu profile looks like:
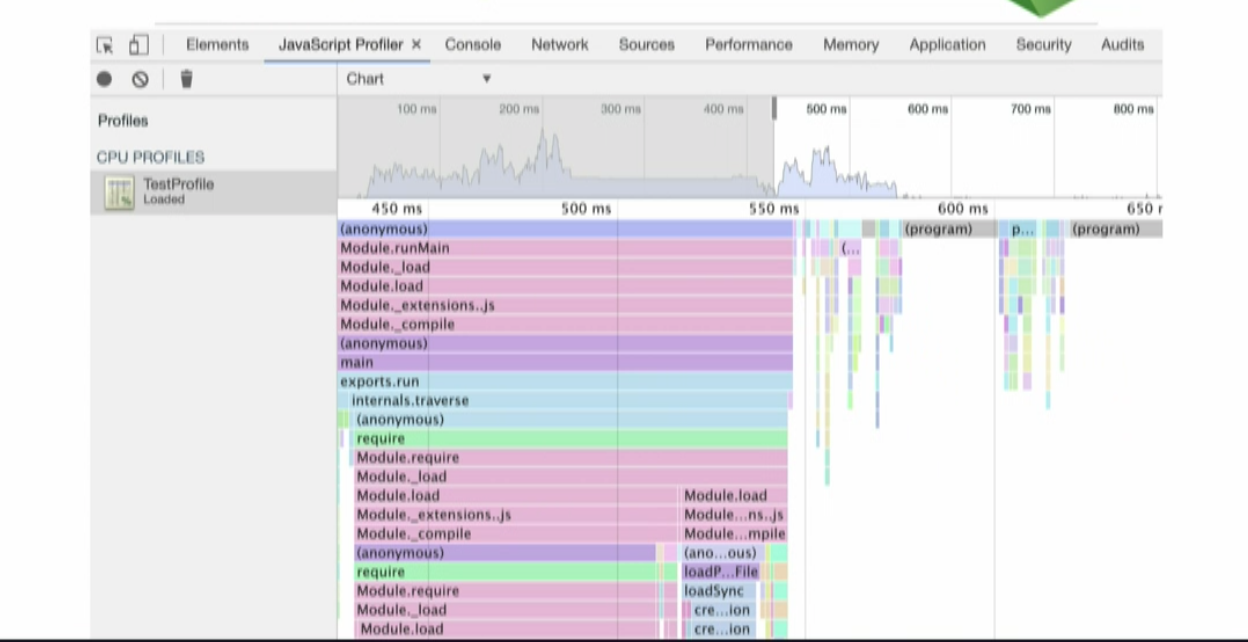
The top section is showing you a high-level view about the CPU activity over time. You can select an interva linside and that will show a more detailed breakdown of the activity.
CPU Profiling measures the space (memory) or time complexity of a program, the usage of particular instructions, or the frequency and duration of function calls. Most commonly, profiling information serves to aid program optimization.
CPU Profiling - in Prod only
In a production environment, we recommended using NSolid. It has some benefits over Chrome Dev Tools, including:
- It’s possible to use it in development and production.
- There is no computational overhead which means that results are consistent without incurring an observer effect that can skew results.
- It is a drop and replace version of the Node.js runtime, requiring zero code instrumentation.
- It doesn't stop the event-loop, and was specifically designed to be useful in production environments.
- It can be configured to automatically trigger CPU profiles if a process exceeds a certain performance threshold.
For analyzing profiles using the NSolid Console, first you launch the console and select the process that is of interest.
On the process details page, click the New CPU Profile button, then you select your profile window (5 to 60 seconds) and desired visualization style and run profile.
You can choose between three different visualizations: Sunburst Chart, Flame Graph, and Tree Map. The next images is an example of a Sunburst Chart:
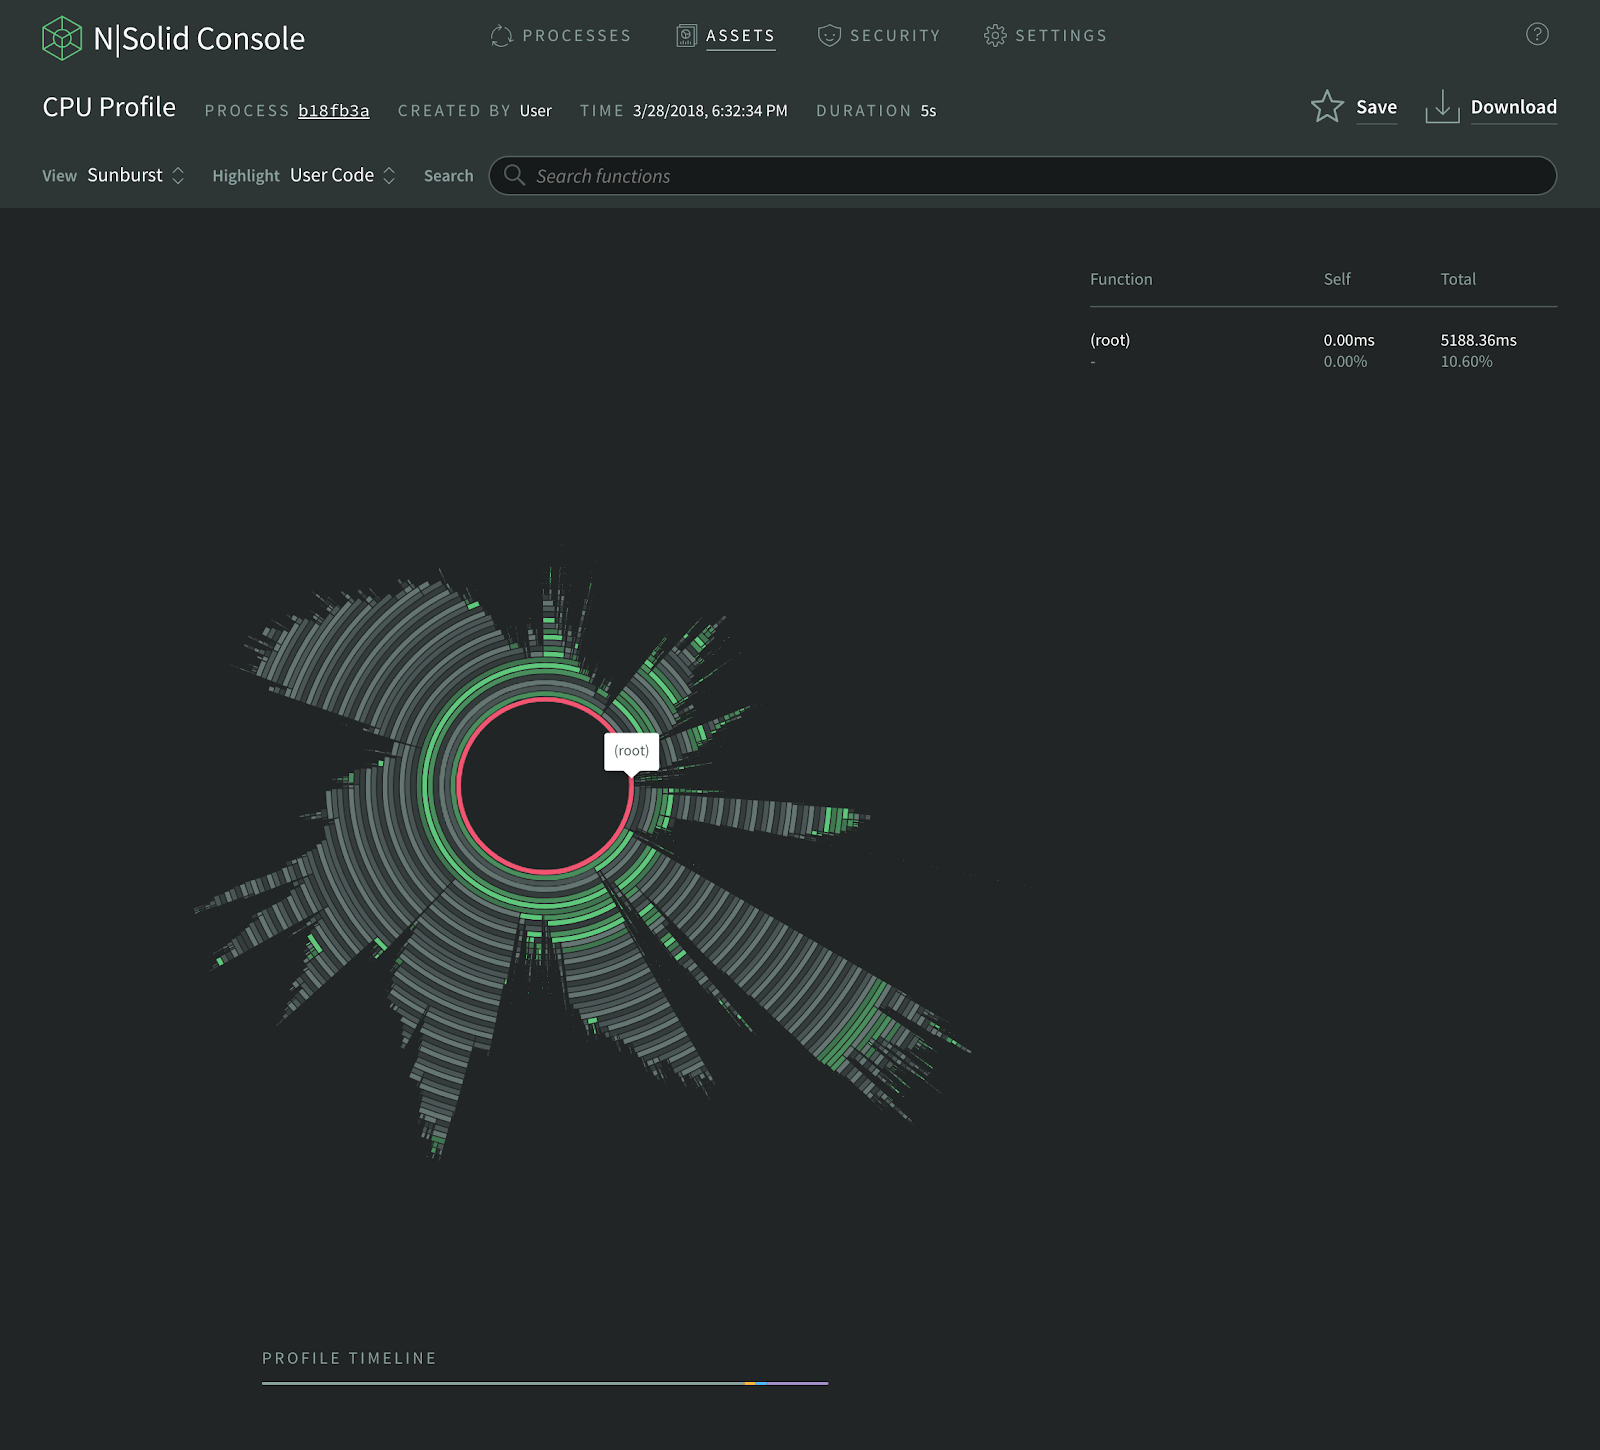
To find out more about cpu profiling in NSolid visit the docs here
Heap Snapshots - in Dev and Prod
Heap Snapshots - in Dev only
A heap snapshot is a static snapshot of memory-usage-details at a moment in time, and it provides a glimpse into the heap usage of V8, the JavaScript runtime that powers Node.js. By looking at these snapshots, you can begin to understand where and how memory is being used. Heap snapshots are very useful for finding and fixing memory and performance issues in Node.js applications, especially memory leaks.
A few years ago, developers had to use the heap dump module to obtain heap snapshots. Today, we have a built-in heap snapshots signal flag --heapsnapshot-signal so you can send as many signals as you want and Node.js will dump the heap snapshots.
Chrome DevTools allows you to compare snapshots, and you can identify objects in memory that will help you narrow down where a memory leak might be occurring.
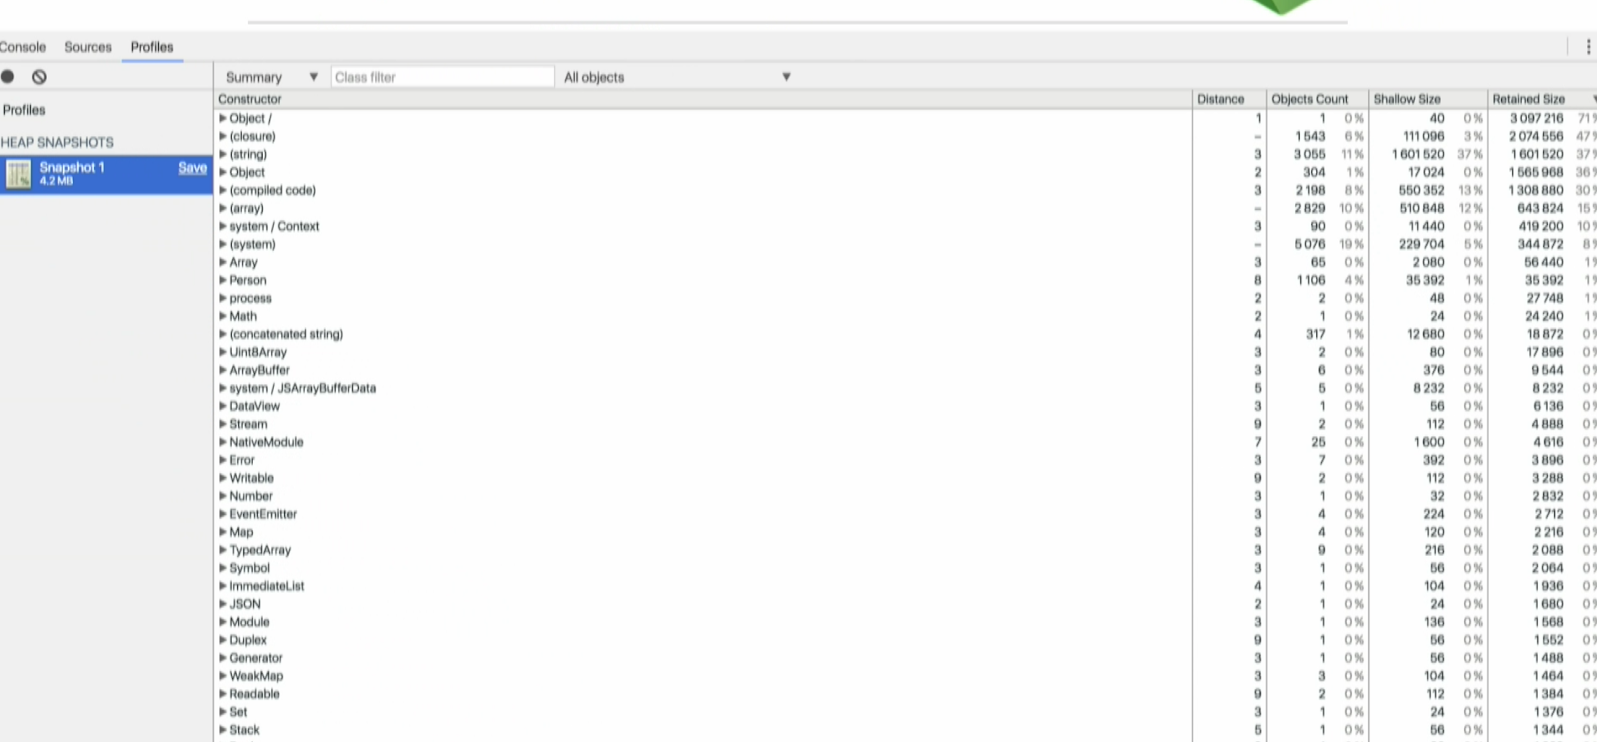
This is how a heap snapshot looks like in Chrome DevTools at a very high level. The column on the far left lists the objects on the JavaScript heap.
On the far right, you can see:
the Objects count column which represents how many objects are in memory,
the shallow size column, which is the amount of memory allocated to store the object itself, not taking into account the referenced objects, and
theretained size column which is its shallow size plus the shallow sizes of the objects that are accessible, directly or indirectly, only from this object.In other words, the retained size represents the amount of memory that will be freed by the garbage collector when this object is collected.
In this example, we can see that the selected object is holding on to over 3 GB of ram and 3 MB of memory. This object should be reviewed.
Heap Snapshots - in Prod only
The best solution to get heap snapshots in production is the NSolid console. The benefits of NSolid over Chrome DevTools include the possibility to use it in development and production, as well as providing a live instrumentation of your production system's health, and stability with no changes to your application code and no computational overhead.
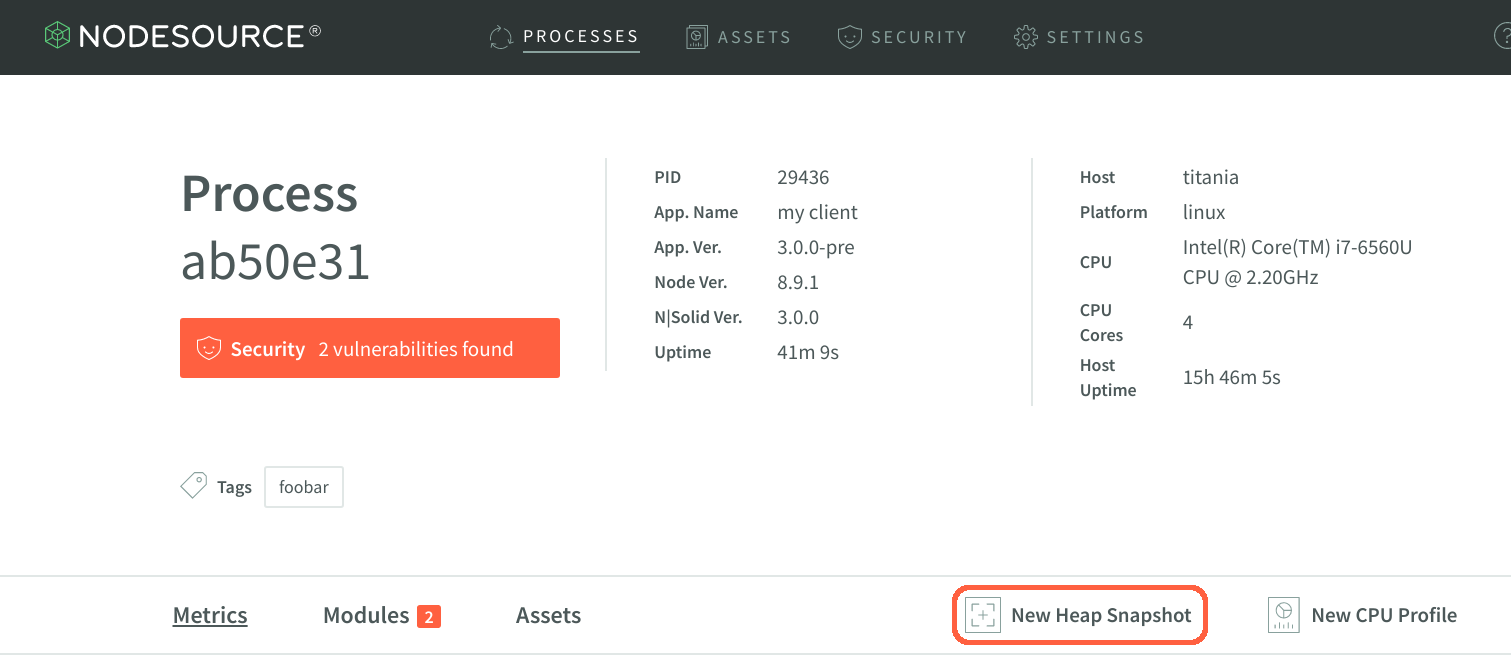
To use NSolid’s Heap Snapshots, first launch the console and locate the Processes list on the right, choose the process ID of interest and click New Heap Snapshot from the Process Detail view as is shown in the image below.
Now that you can see the results of the heap snapshot, navigate through the various objects indexed during the snapshot process.
You can also configure the NSolid Console to automatically take Heap Snapshots when any process exceeds a certain performance threshold (i.e. Memory > 700MB).
Once taken snapshots can be easily compared as is shown in the image below. This is especially useful to compare an application’s heap-snapshot that was taken when a performance problem occurred against itself when it was still running smoothly.
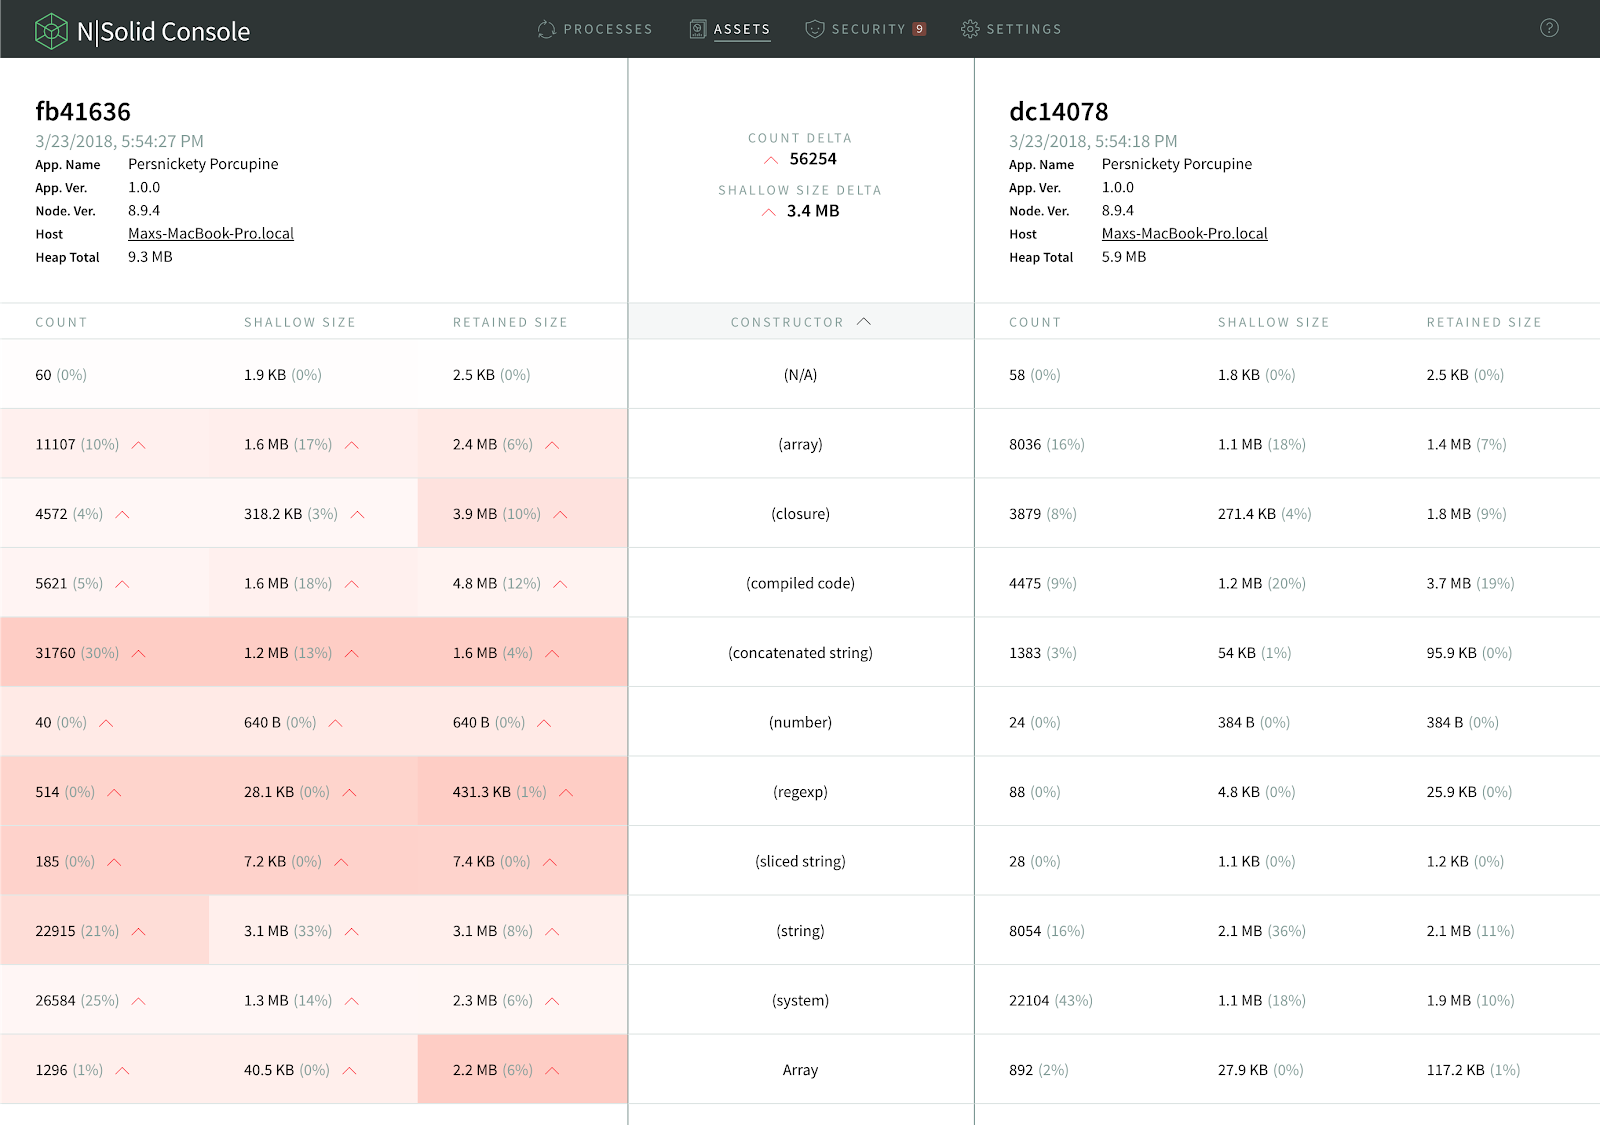
Cells on the left-hand snapshot will be colored, reflecting the percentage difference within the row. The redder the cell, the greater the value has increased over the corresponding value in the other snapshot. Greener cells indicate the reverse. This will help you find memory leaks or performance issues more easily, which can help you to identify the underlying problem faster.
You can find more information here.
Asynchronous Stack Traces
Async Stack Traces make debugging async functions easier. These are rich stack traces that not only include the current synchronous part of the stack, but also the asynchronous part.
Normally, when you execute asynchronous operations, the stack trace is not completed because it doesn’t show the asynchronous part. This makes debugging way more difficult, because you can see that there is an error but you don’t know where it originated from.
There is a very popular module called longjohn that is used for this. However, this module comes with a lot of performance overhead, so it is not recommended to use it in production.
Because of that the V8 team added Async Stack Traces as a way to work with async/await code with very low cost. This will show you where the asynchronous operations happen.
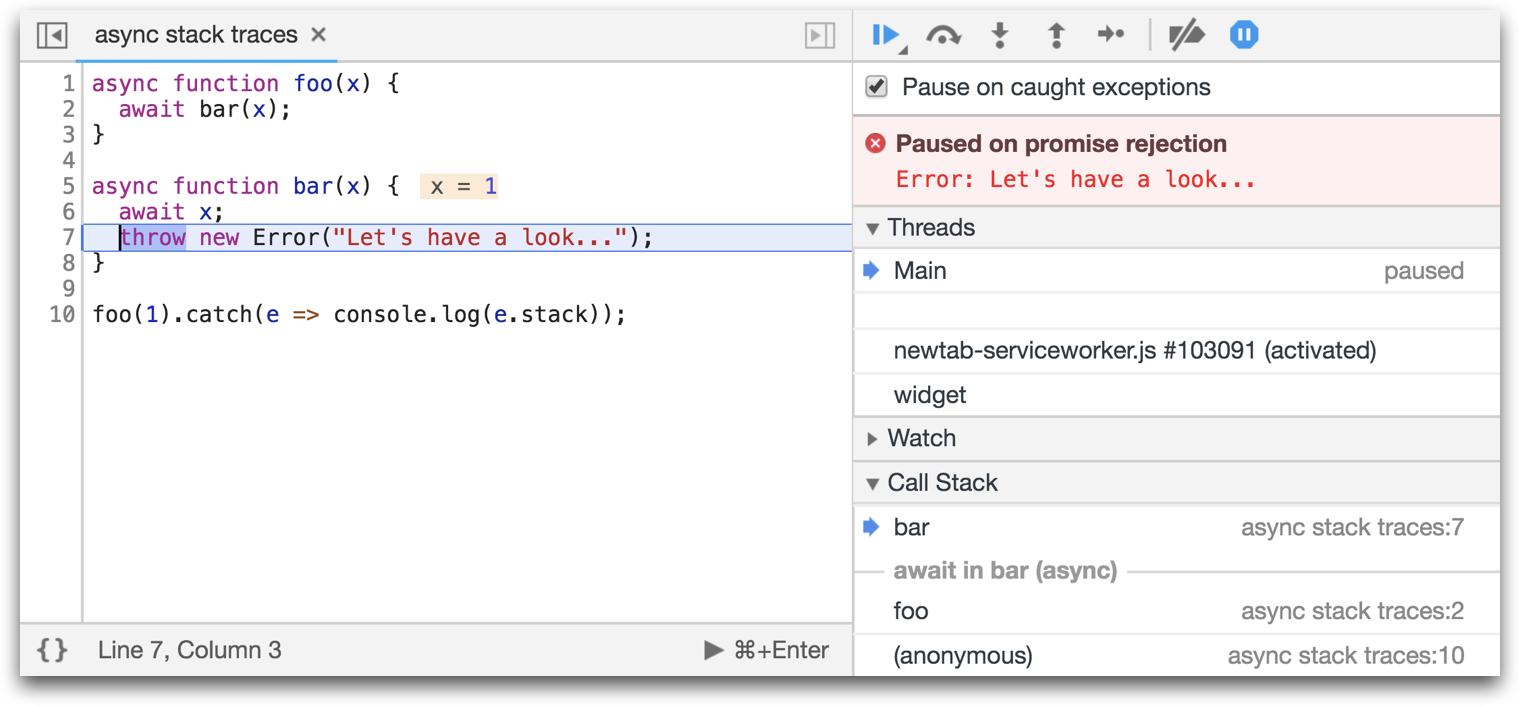
As an example, here we have a function called foo, which is executing an asynchronous operation calling the function bar.
Normally, you will only be able to see bar in the stack trace, but with the Async Stack Trace you can now see foo in the DevTools as well.
References:
Profiling Node.js Code ( Part 1: Basics )
Debugging Guide - Node.js Docs
The WebSocket API (WebSockets)