Creating and Saving Views in N|Solid 3.0
In N|Solid 3.0, the NodeSource team shipped a complete rework of the N|Solid Console, the dashboard to enable you to precisely visualize your Node.js data.
This release includes a massive update to the main application display and the way you can interact with the applications being displayed. Gone is the need to click on an individual process in the graph to view richer information. N|Solid 3.0 added in extremely powerful advanced filtering based on custom, user-defined queries.
This new filtering mechanism also allows you to save your queries as "views" and open them up again at your convenience, as well as attach actions to be performed when your processes match.
If you’re part of a DevOps team–or just care about how the apps you build are doing–this new bit of functionality is extremely powerful. It effectively allows you to quickly spin up filters that you care about most (the ones that can literally be life-or-death for your applications) and figure out what needs attention.
In this guide, we’re going to assume that I’m setting up a new view in the N|Solid 3.0 console for the very first time, and want to monitor my production applications for vulnerabilities as they’re disclosed.
Setting up a view to Monitor Vulnerabilities in Production
In my production environment, I’ve connected each of my Node.js processes to the N|Solid console, having deployed them each with the N|Solid runtime. I’ve got a set of three APIs that we use for three of our most critical systems: payments, services, and content.
Today, I’m going to set up a new view to actively monitor vulnerabilities in the connected production Node.js processes, and set up an email alert when processes match the filters I configure.
Filtering Your Processes
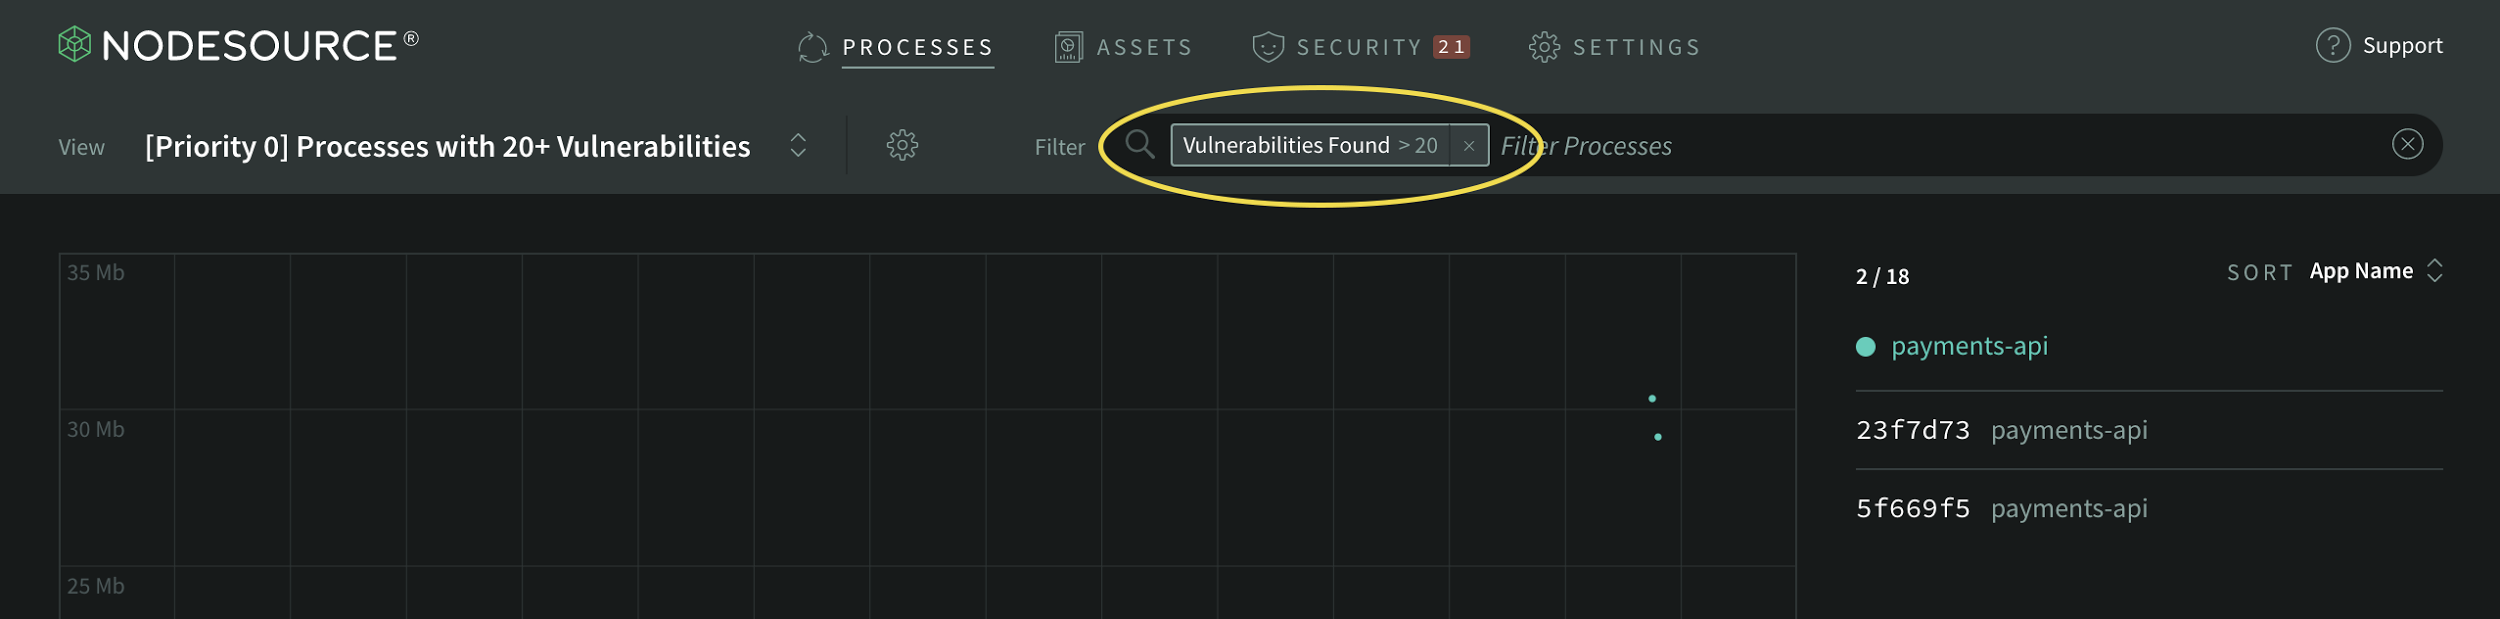
To start creating a custom view, you’ll want to search for the terms you’d like to filter by in the search bar just above the scatterplot. In my case, I want to filter based on the vulnerabilities found in my Node.js processes:
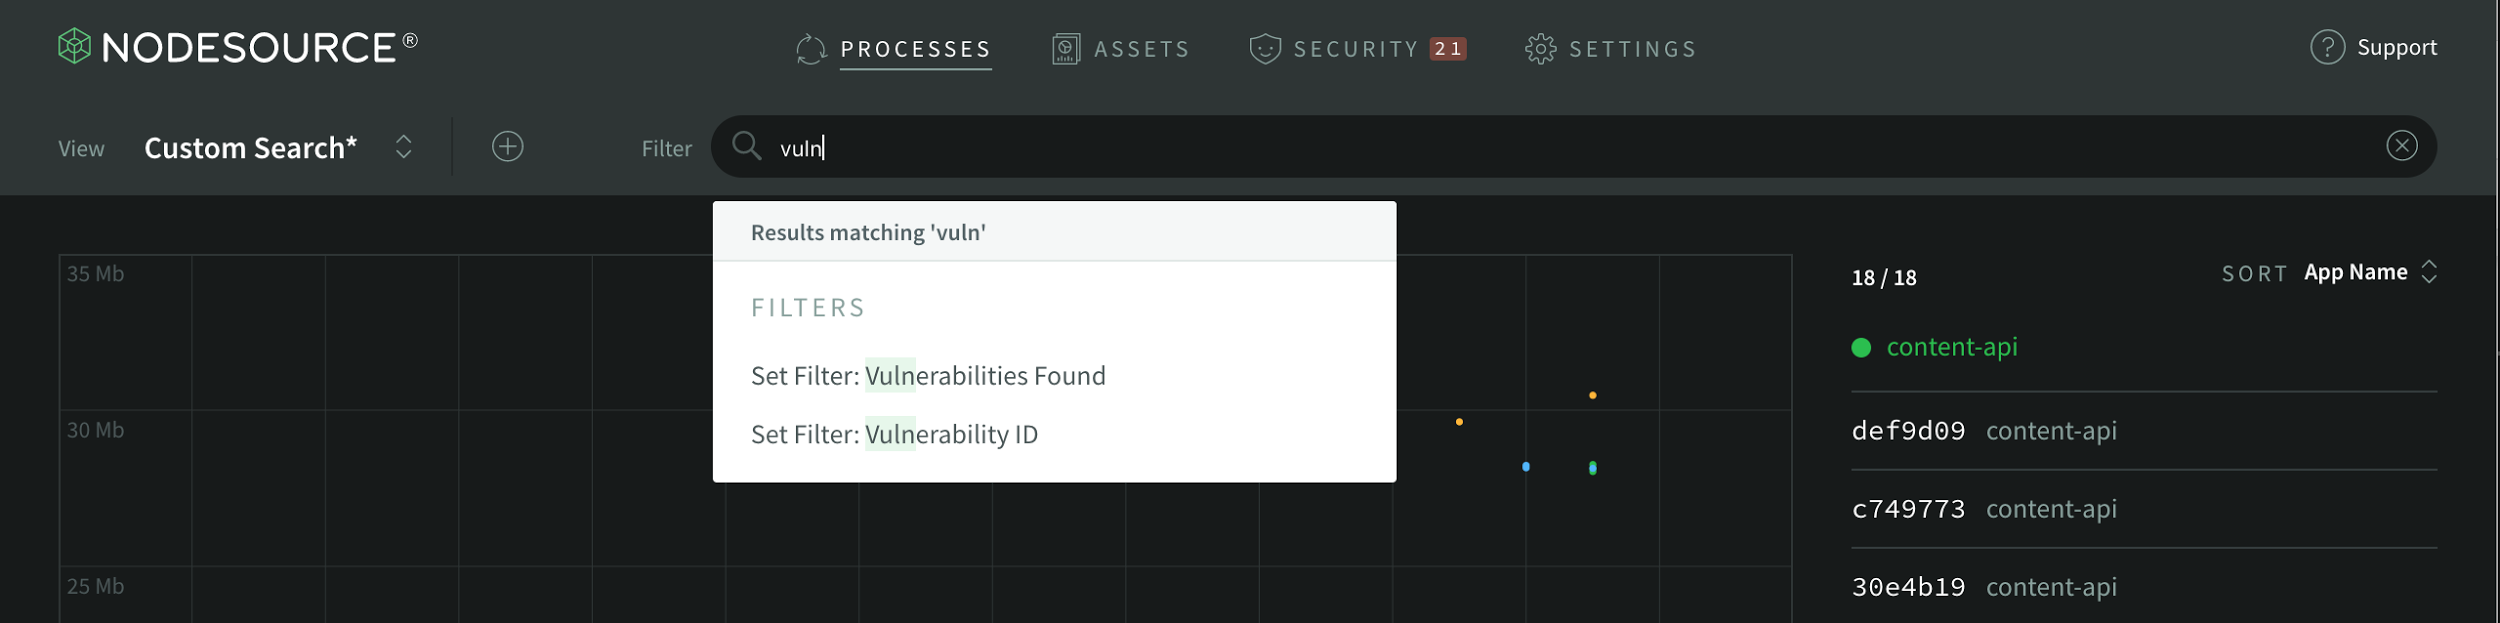
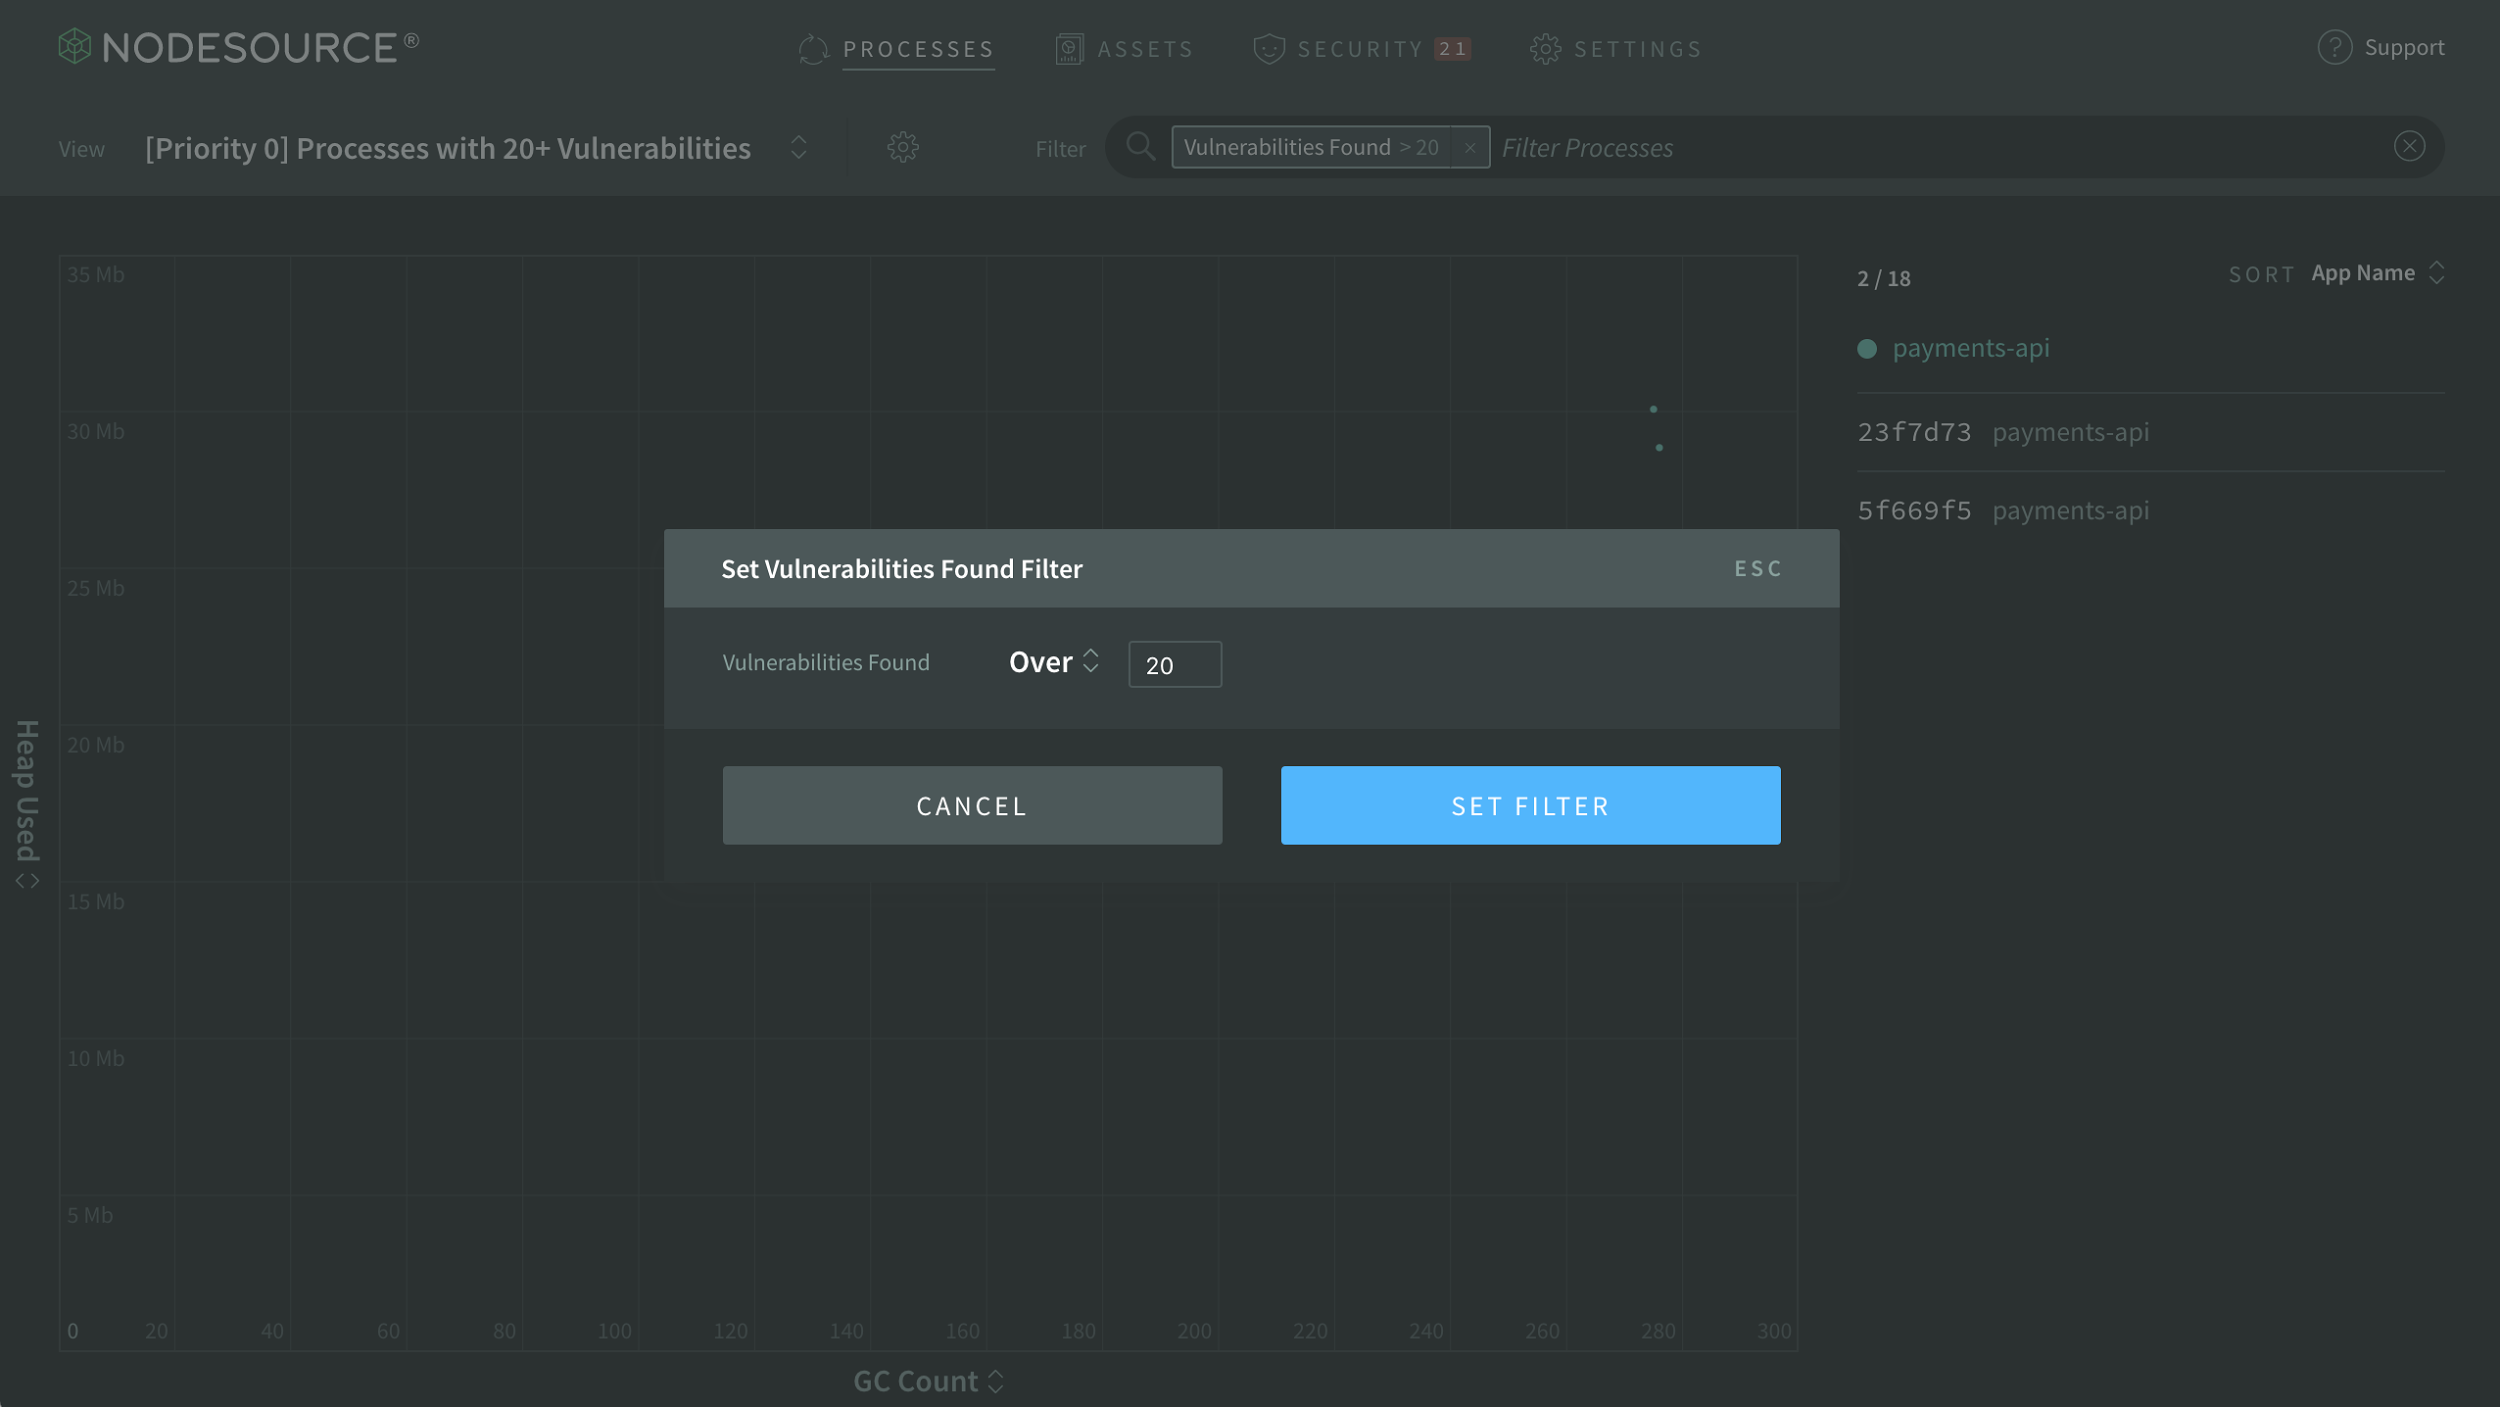
From there, you’re going to select "Set Filter: Vulnerabilities Found" and a modal will come up that will allow you to define a filter to run against the active Node.js processes in the console. In the case of the “Vulnerabilities Found” filter, you can set the filter to display processes that have more than or less than a specific number of vulnerabilities:
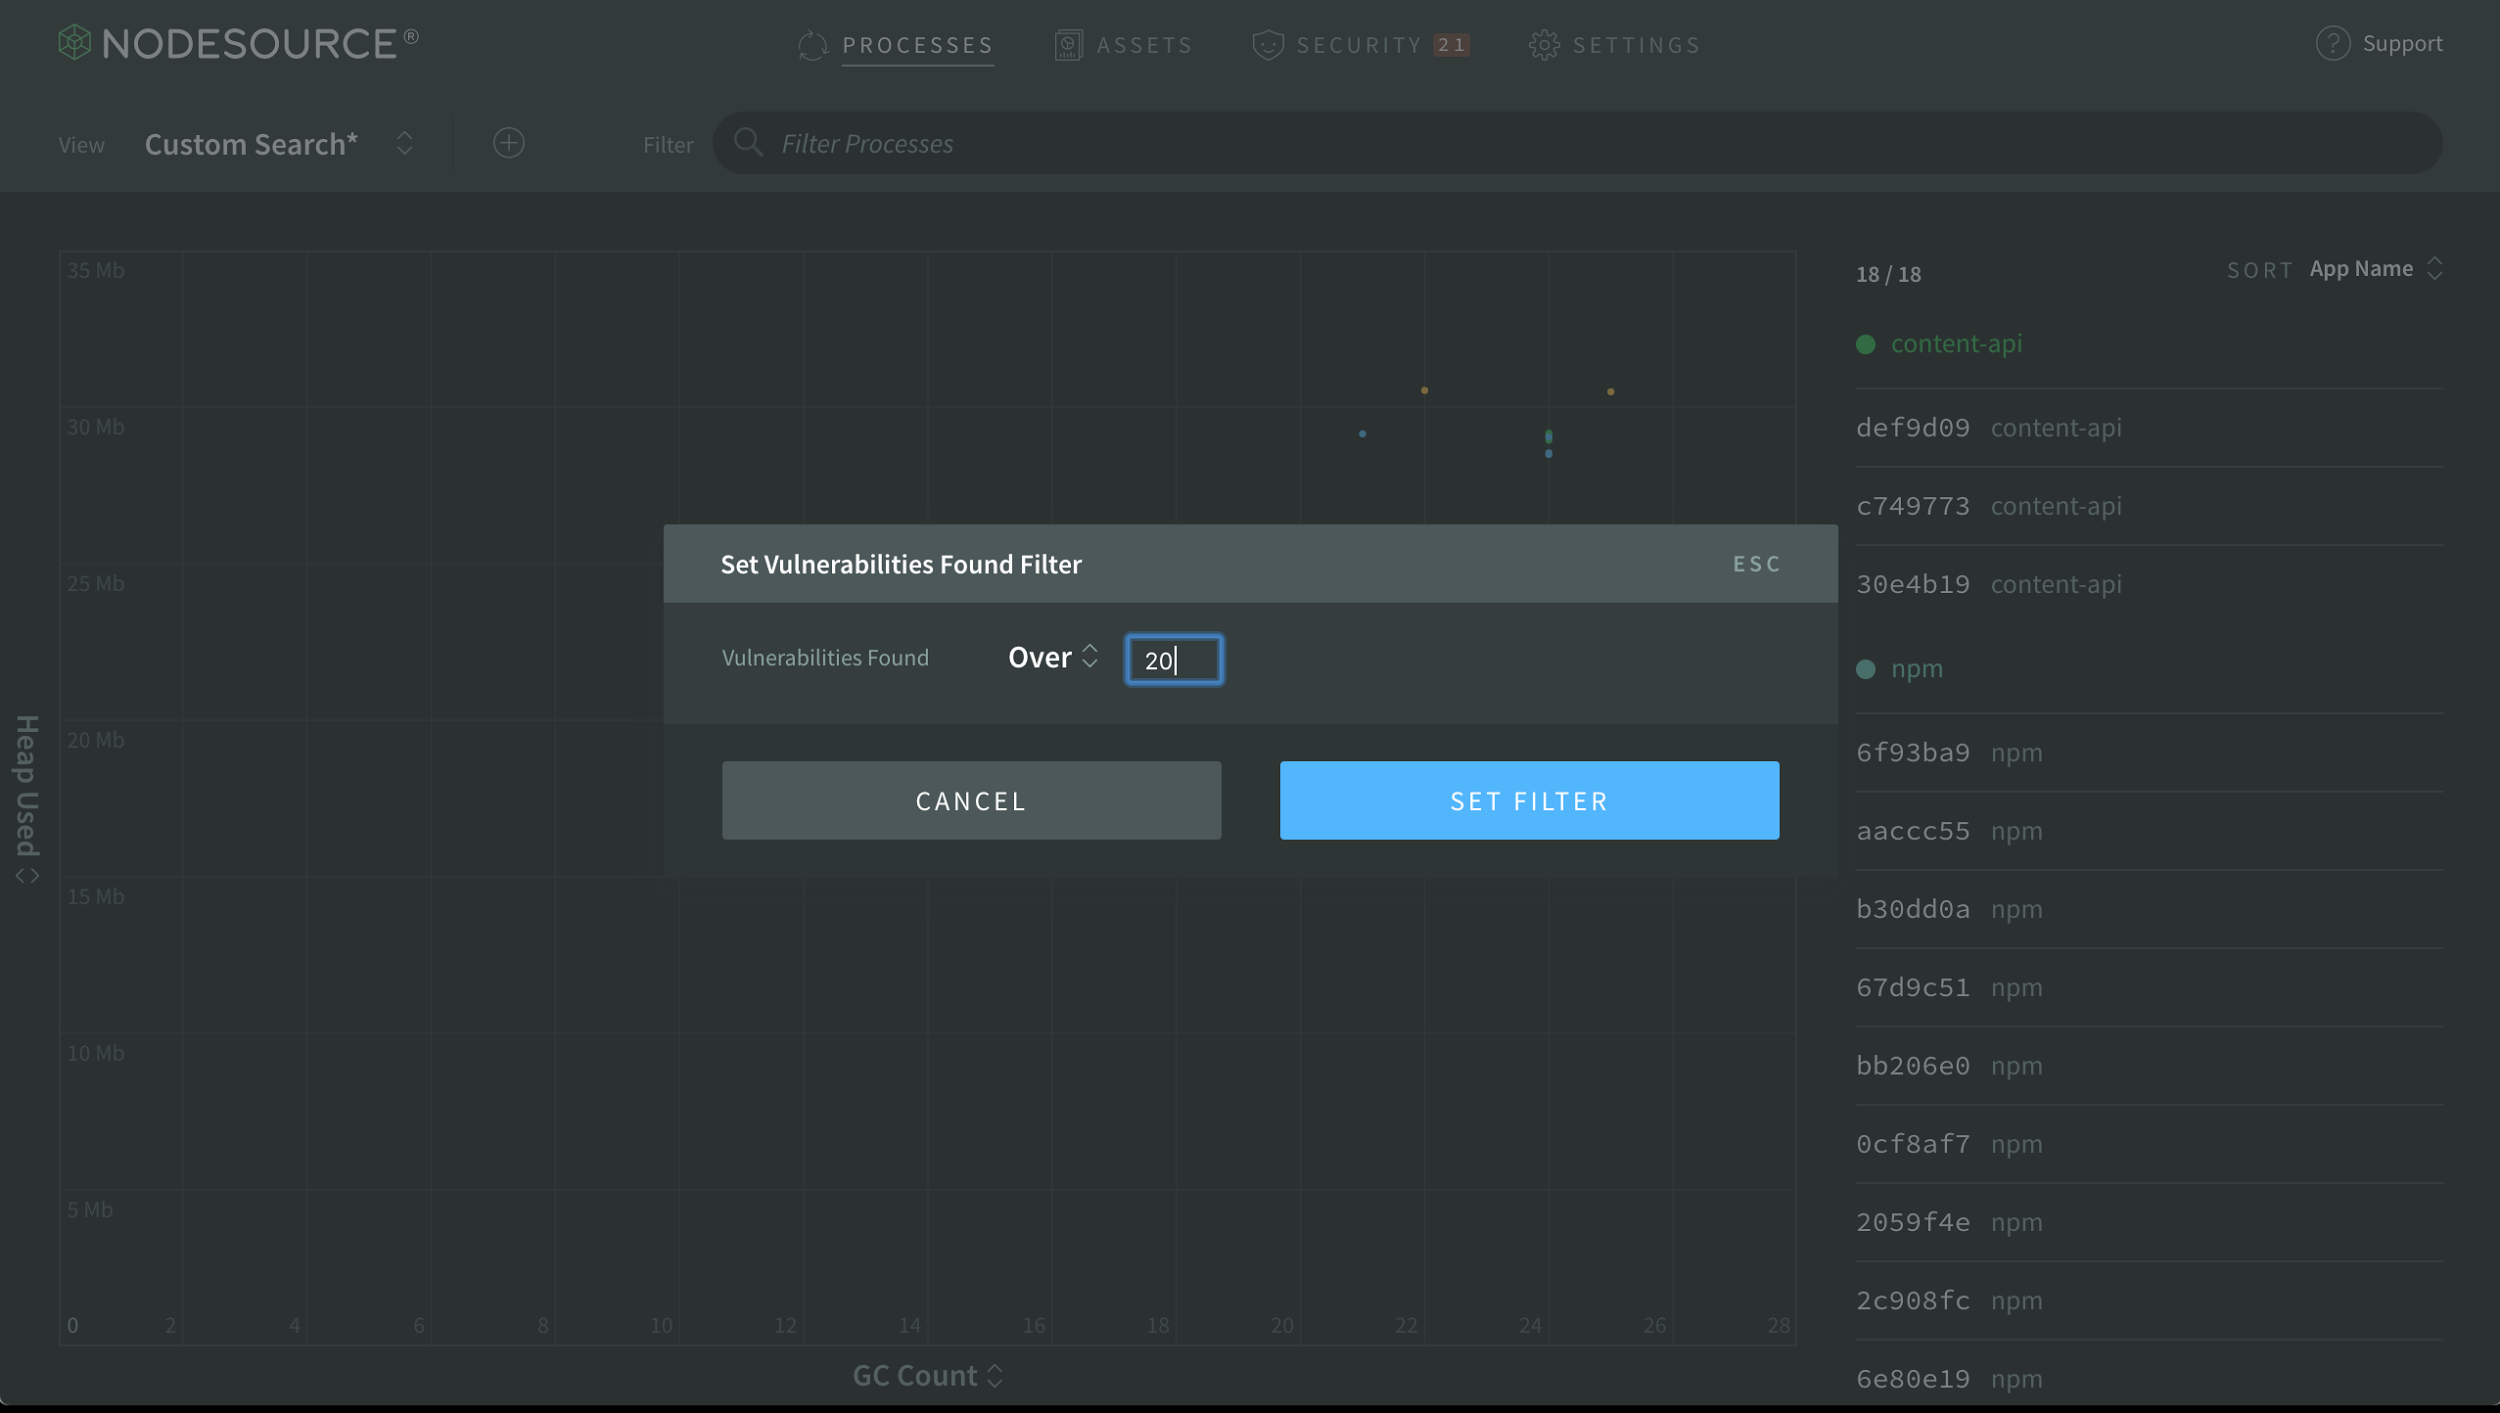
In this case, I’ve set it to show me processes in the console that have more than 20 vulnerabilities. Once I hit "Set Filter" the filter will be applied:
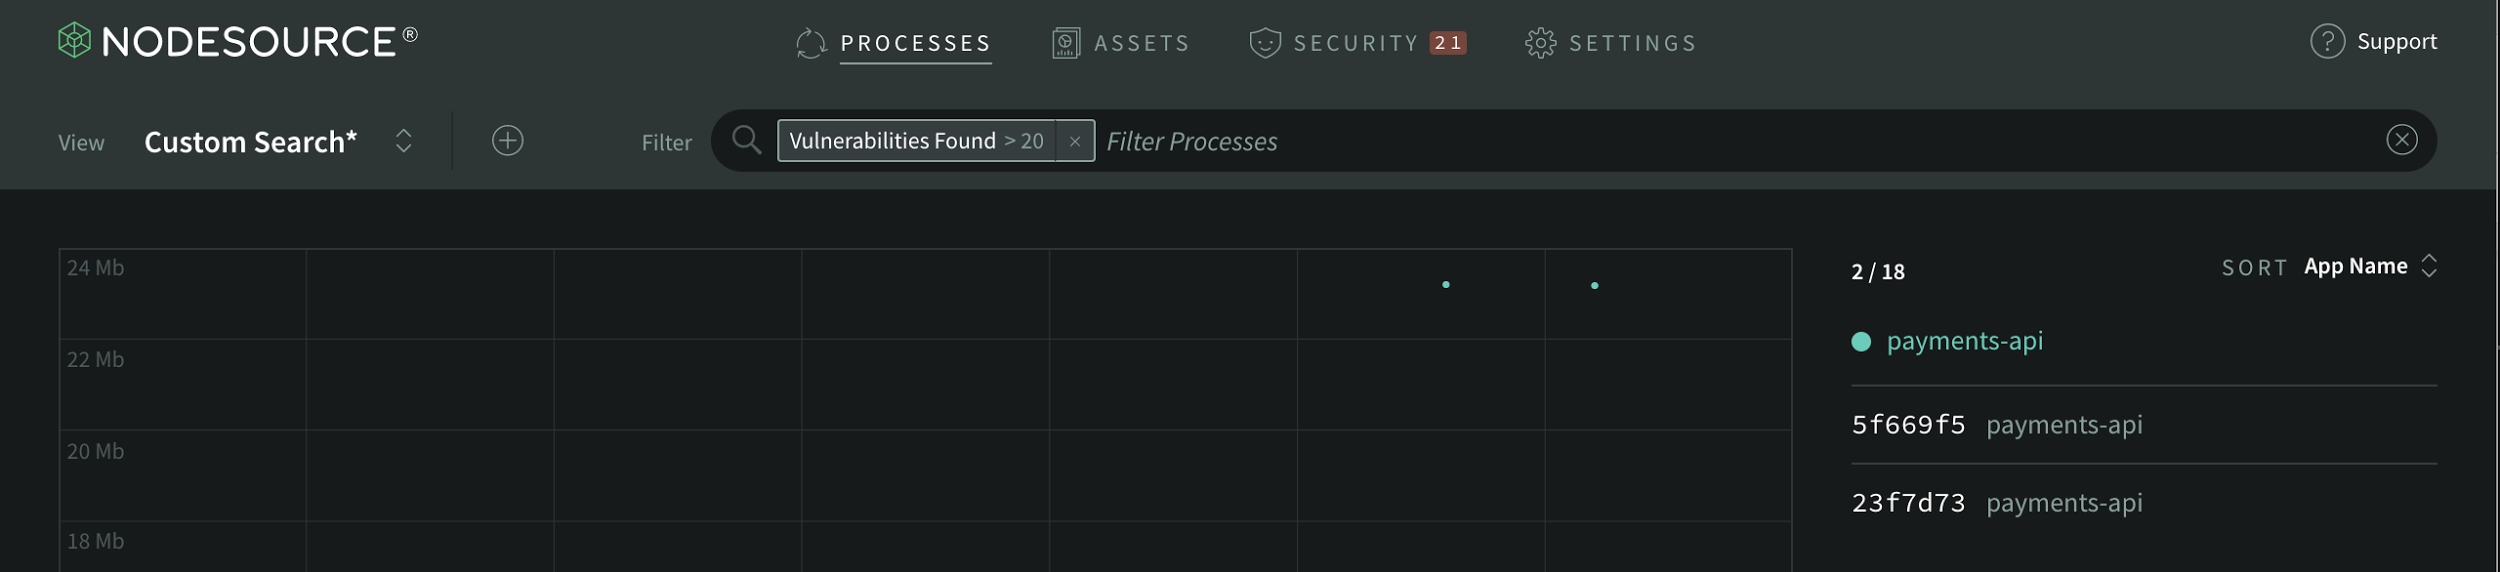
Oh no! I have two Node.js processes that have more than 20 vulnerabilities. What’s worse, they’re my Payments API processes.
I’m going to send these over to my team to let them know that we need to fix this ASAP–but before I do, I’m going to save this view so I can pull it up again at a later time.
Saving a View
To save the view, I’ll click the + icon next to "Custom Search" above the scatterplot–circled in yellow:
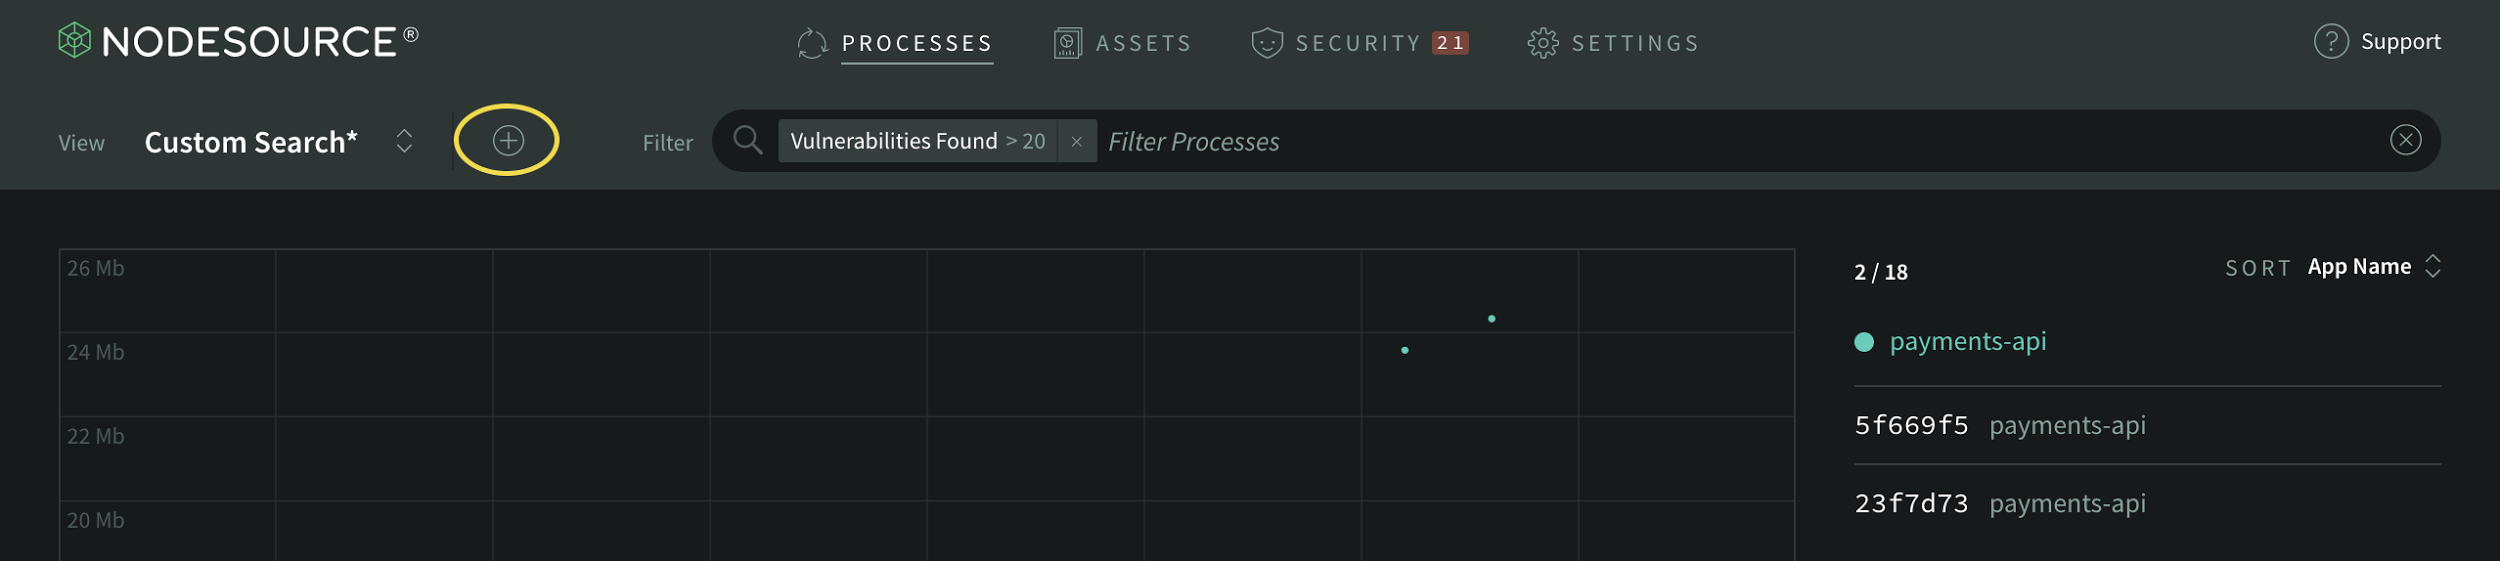
From there, you’ll see a Save New View interface:
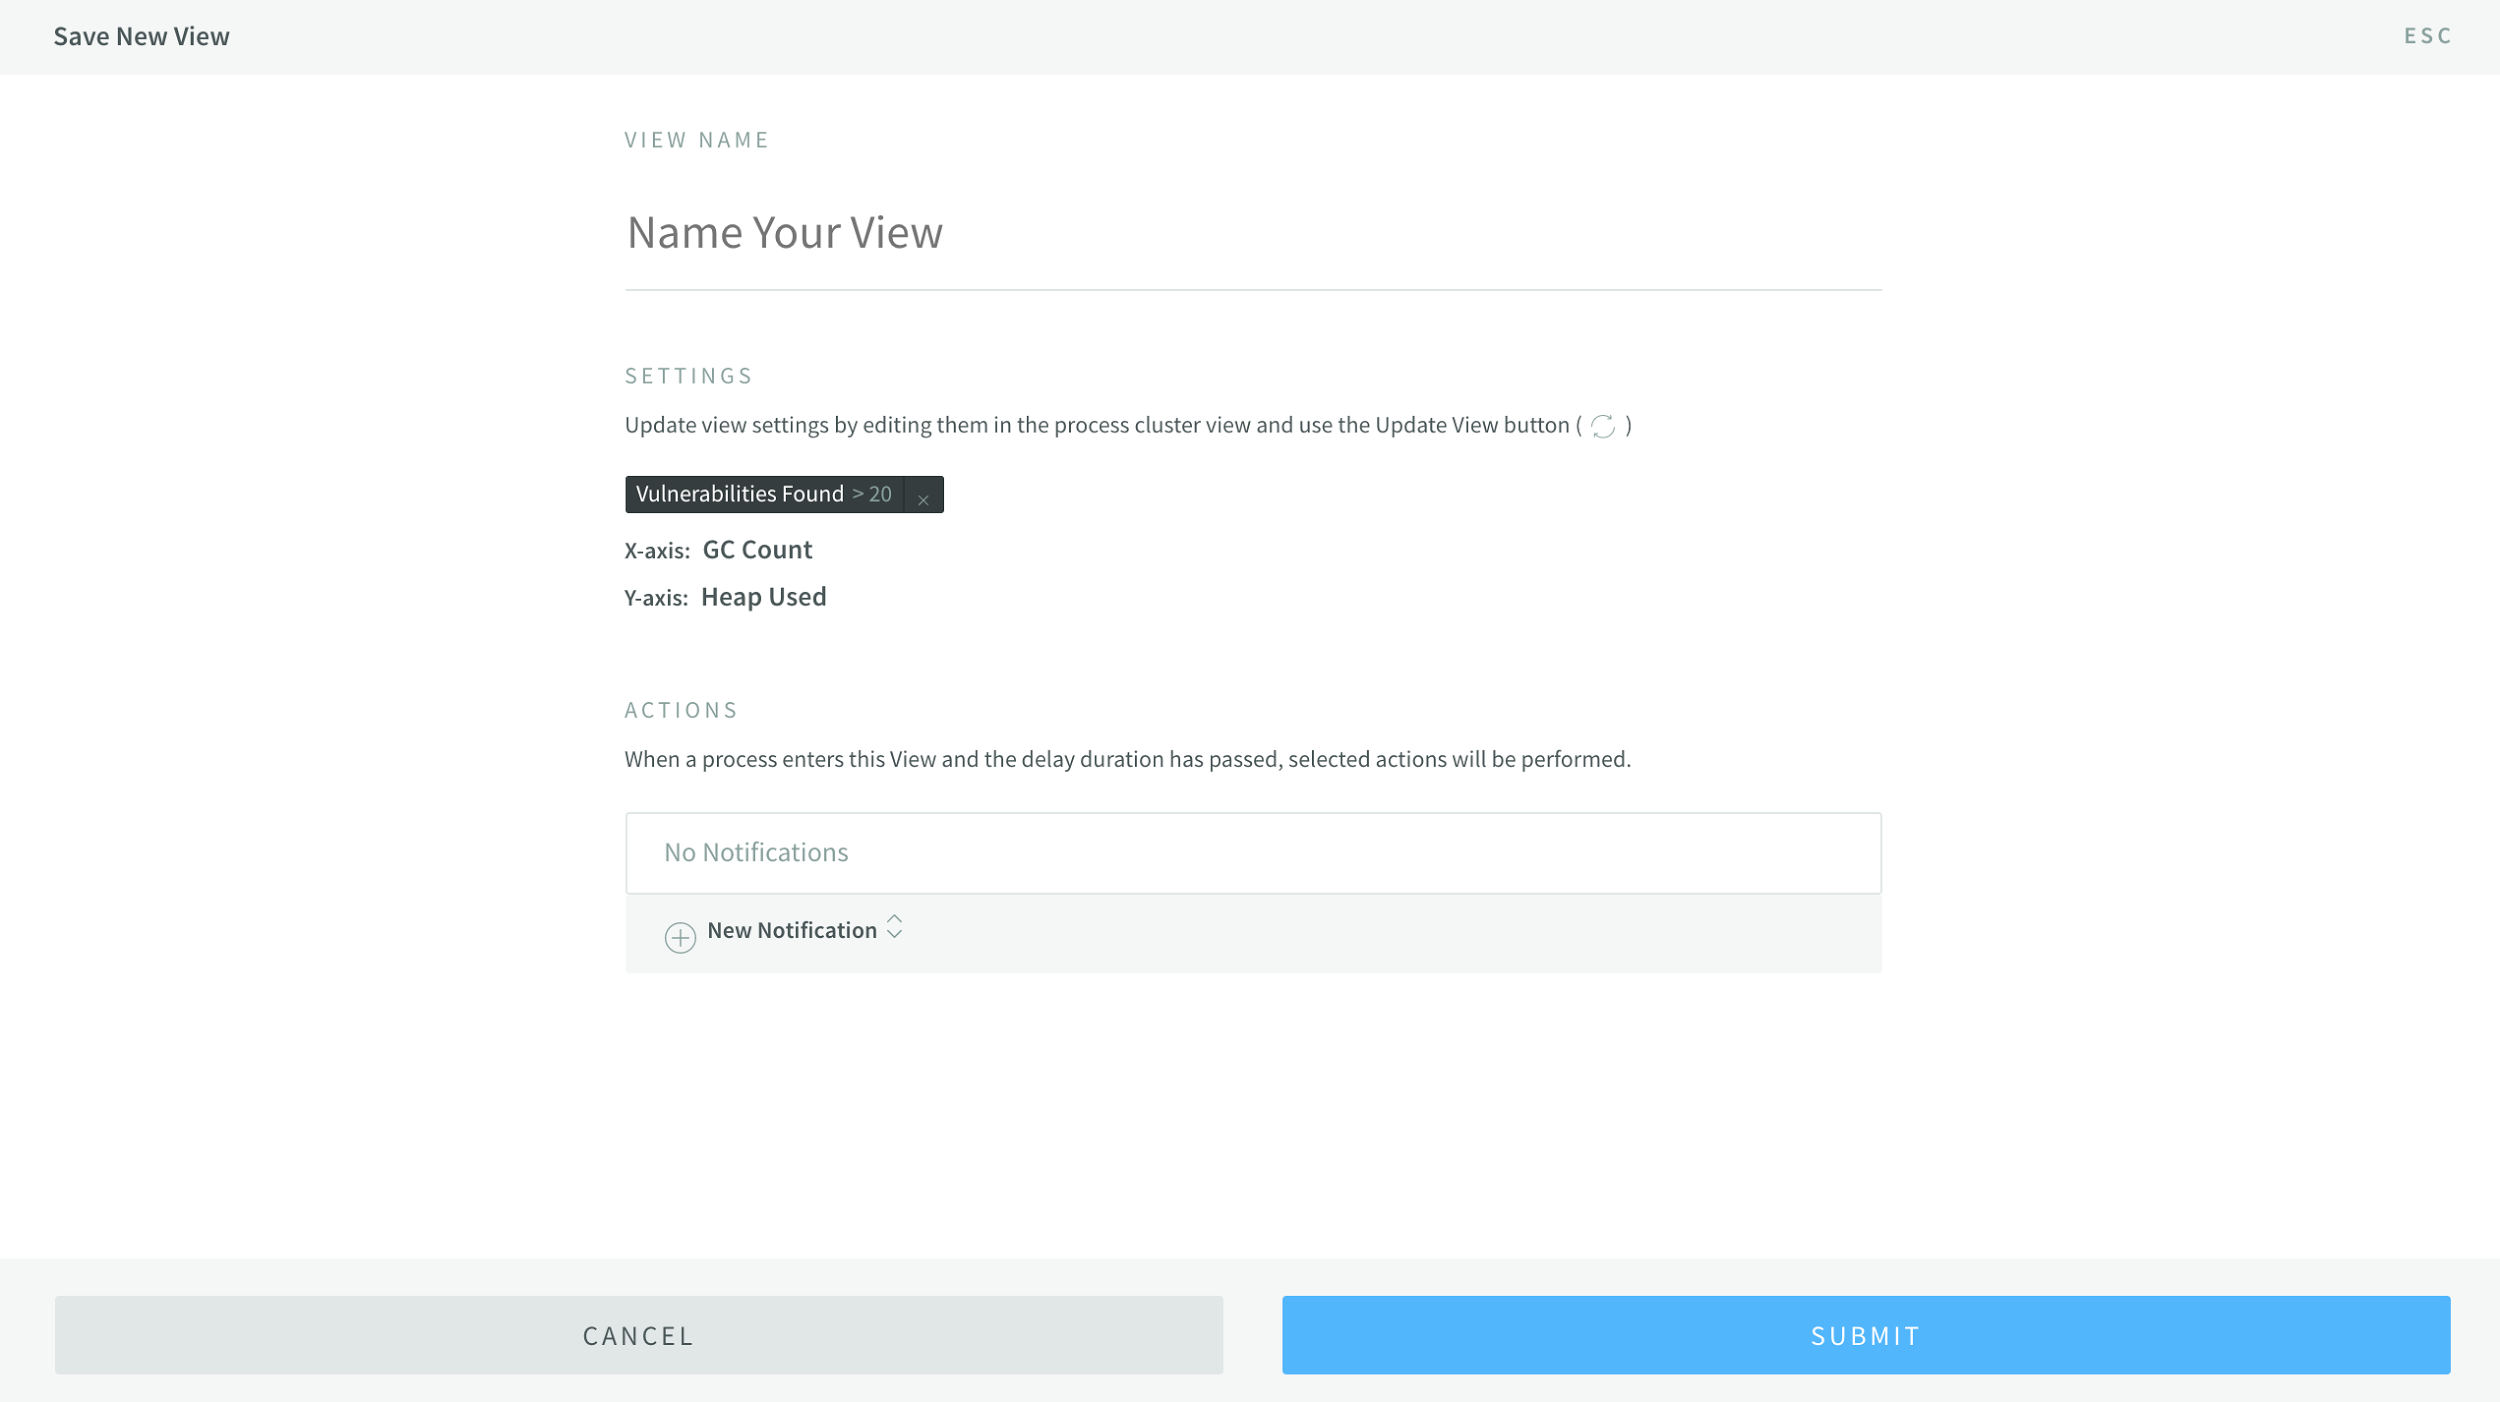
This interface will save all custom configuration you’ve made to the scatterplot view, including all applied filters, the X and Y axes, and enables you to configure a notification. I’m going to name my view [Priority 0] Processes with 20+ Vulnerabilities.
Adding a Notification:
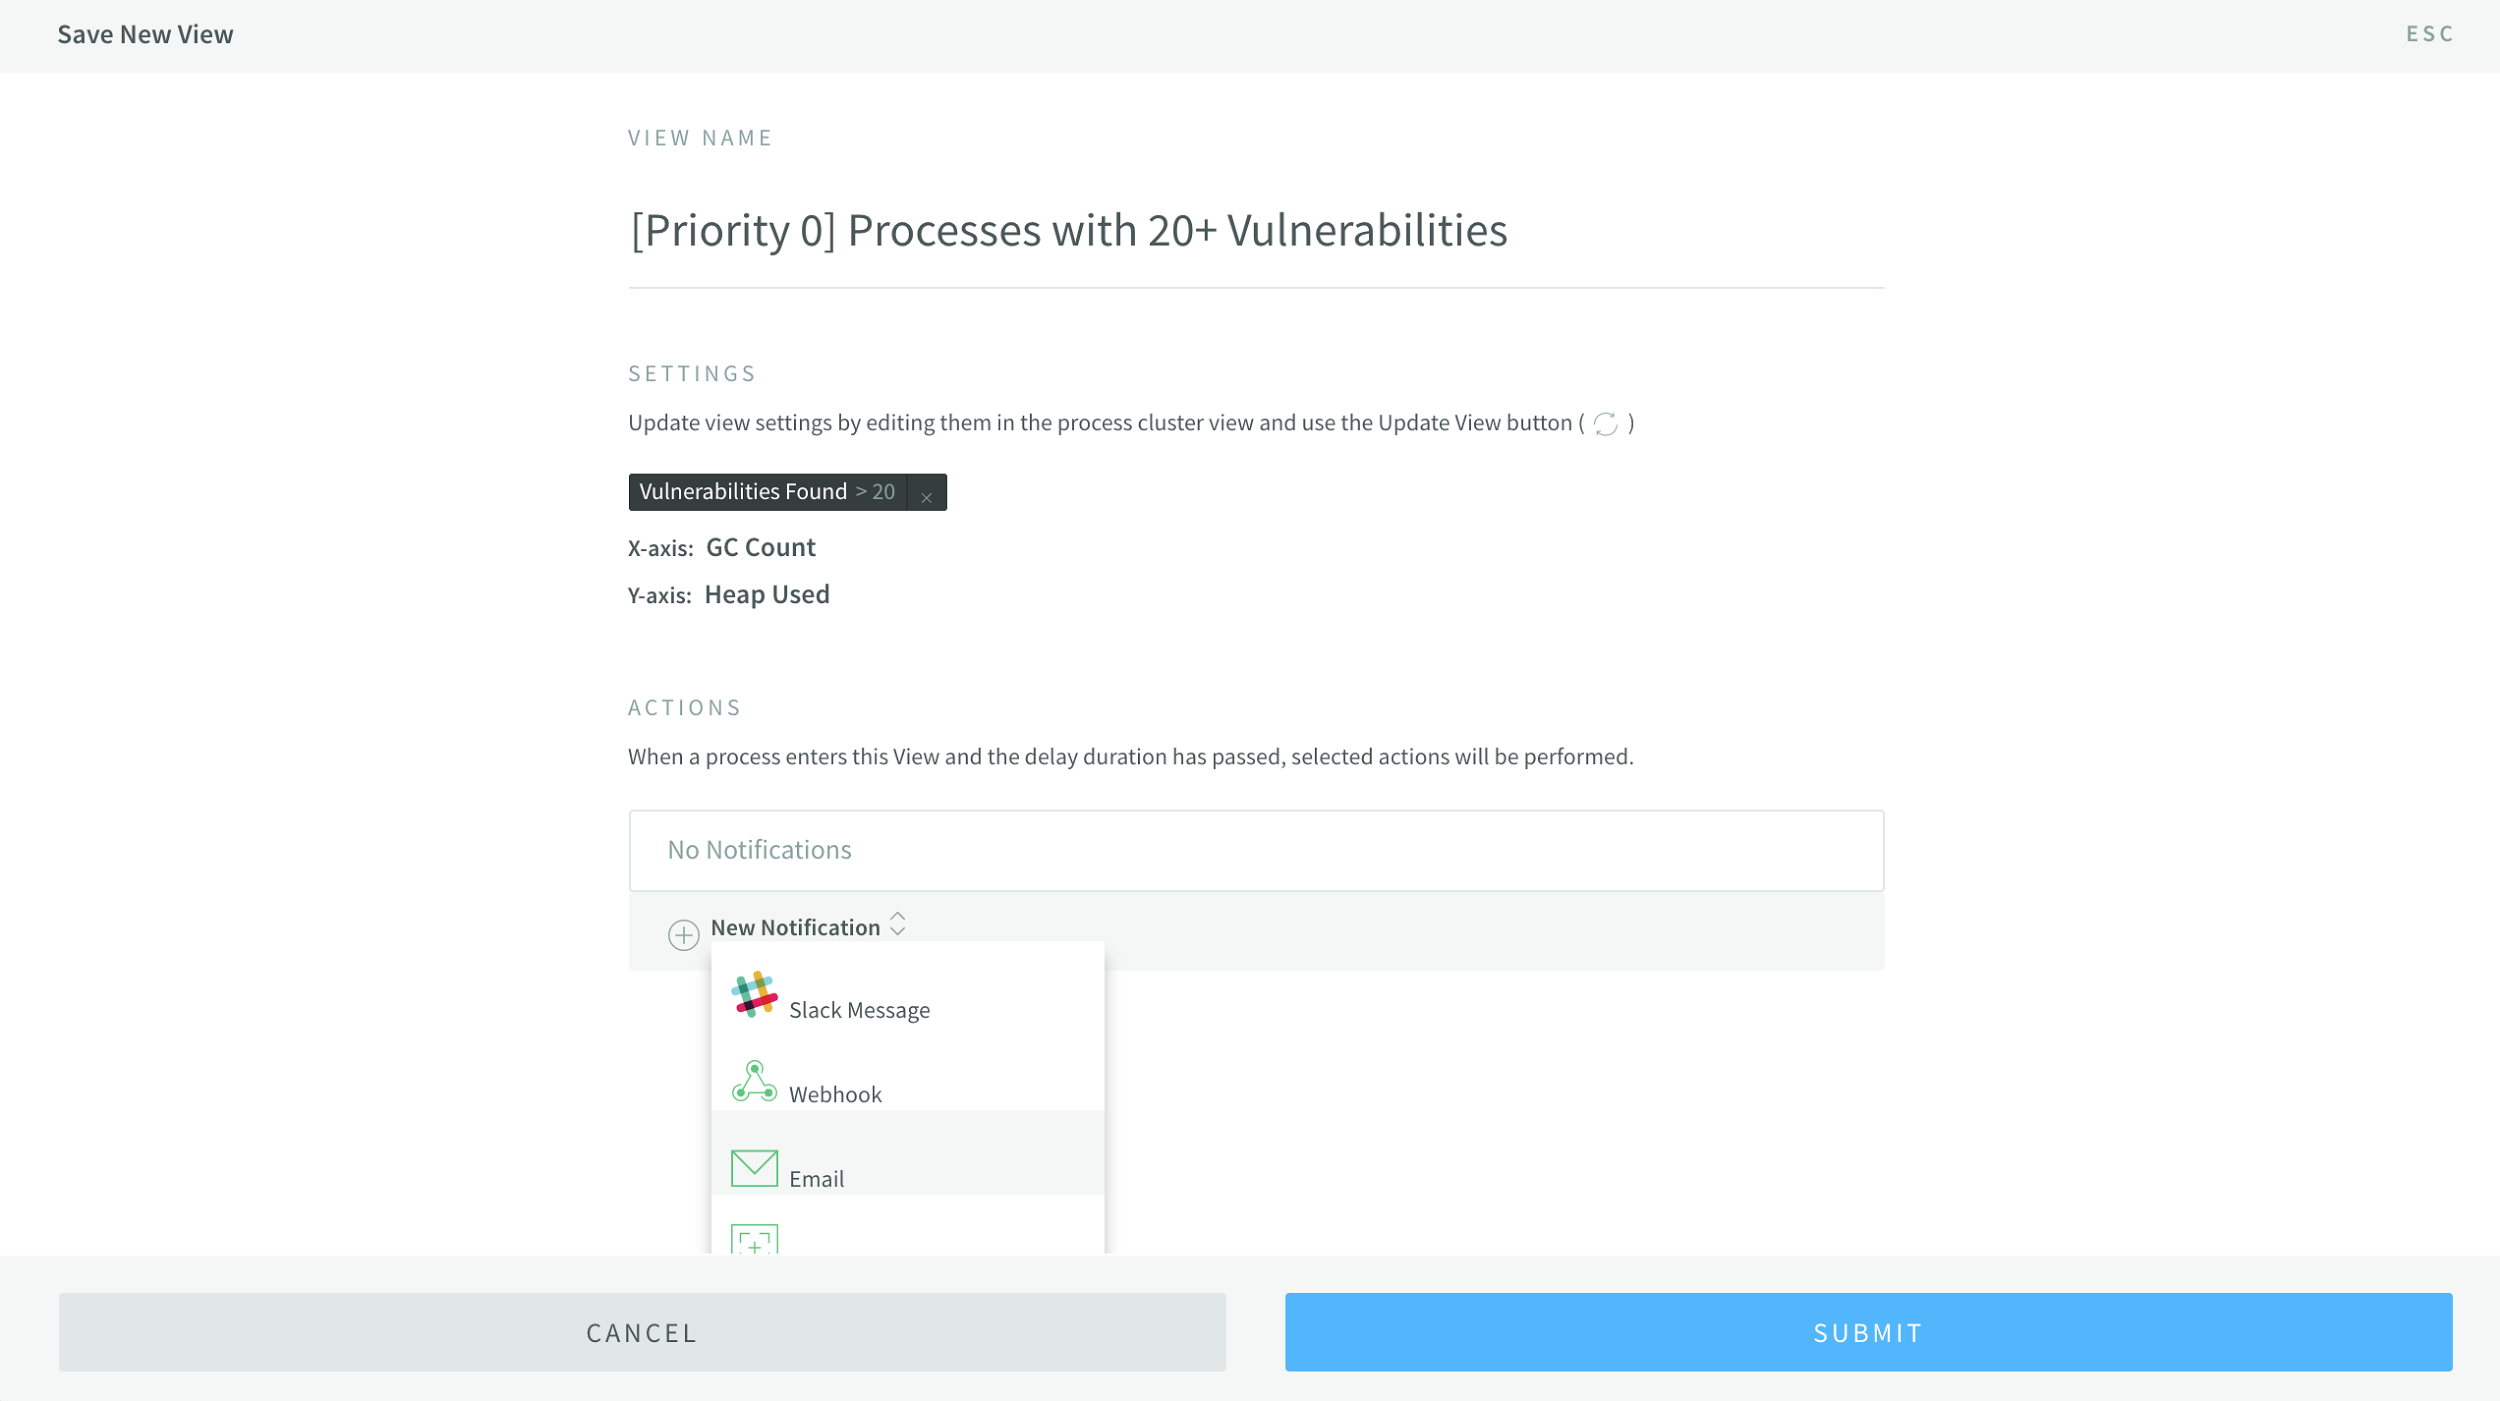
I’d also like to be notified of when more processes meet the criteria of the filter and show up, so I’m going to add an email notification. I’ll do this by clicking the "New Notification" button and selecting “Email”:
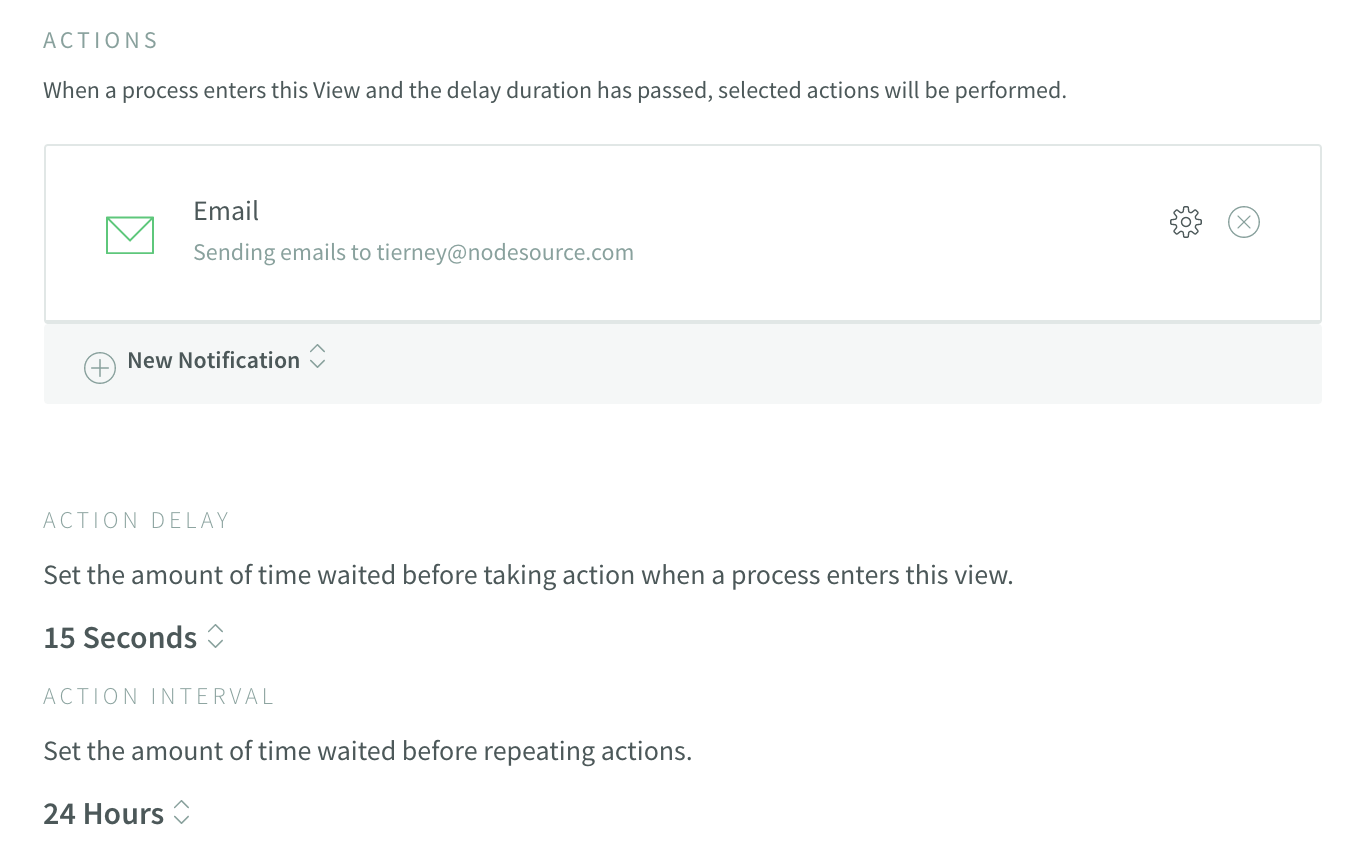
From there, a modal will come up that you can enter an email address to notify when new processes meet the criteria set by the filters to enter this view:

Once you set up any kind of action, you can configure the action delay and action interval. In my case, I’d like to know about processes that reach 20 vulnerabilities as soon as humanly possible, so I configured Action Delay to be 15 seconds after a process enters the view, and I set the Action Interval to 24 hours, so I'll have a consistent reminder:
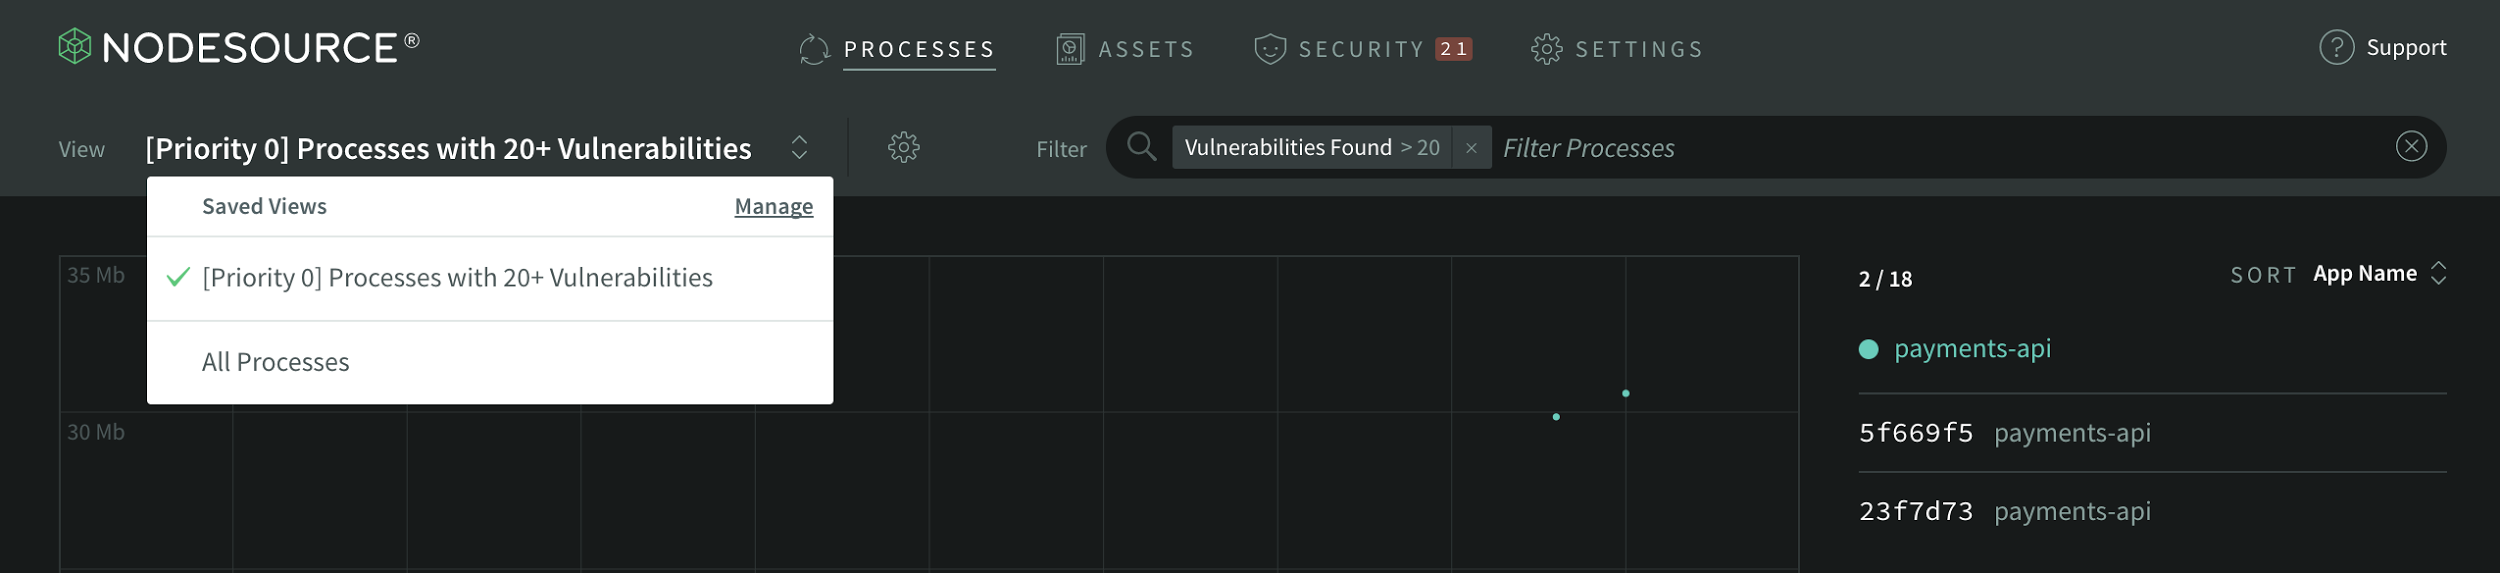
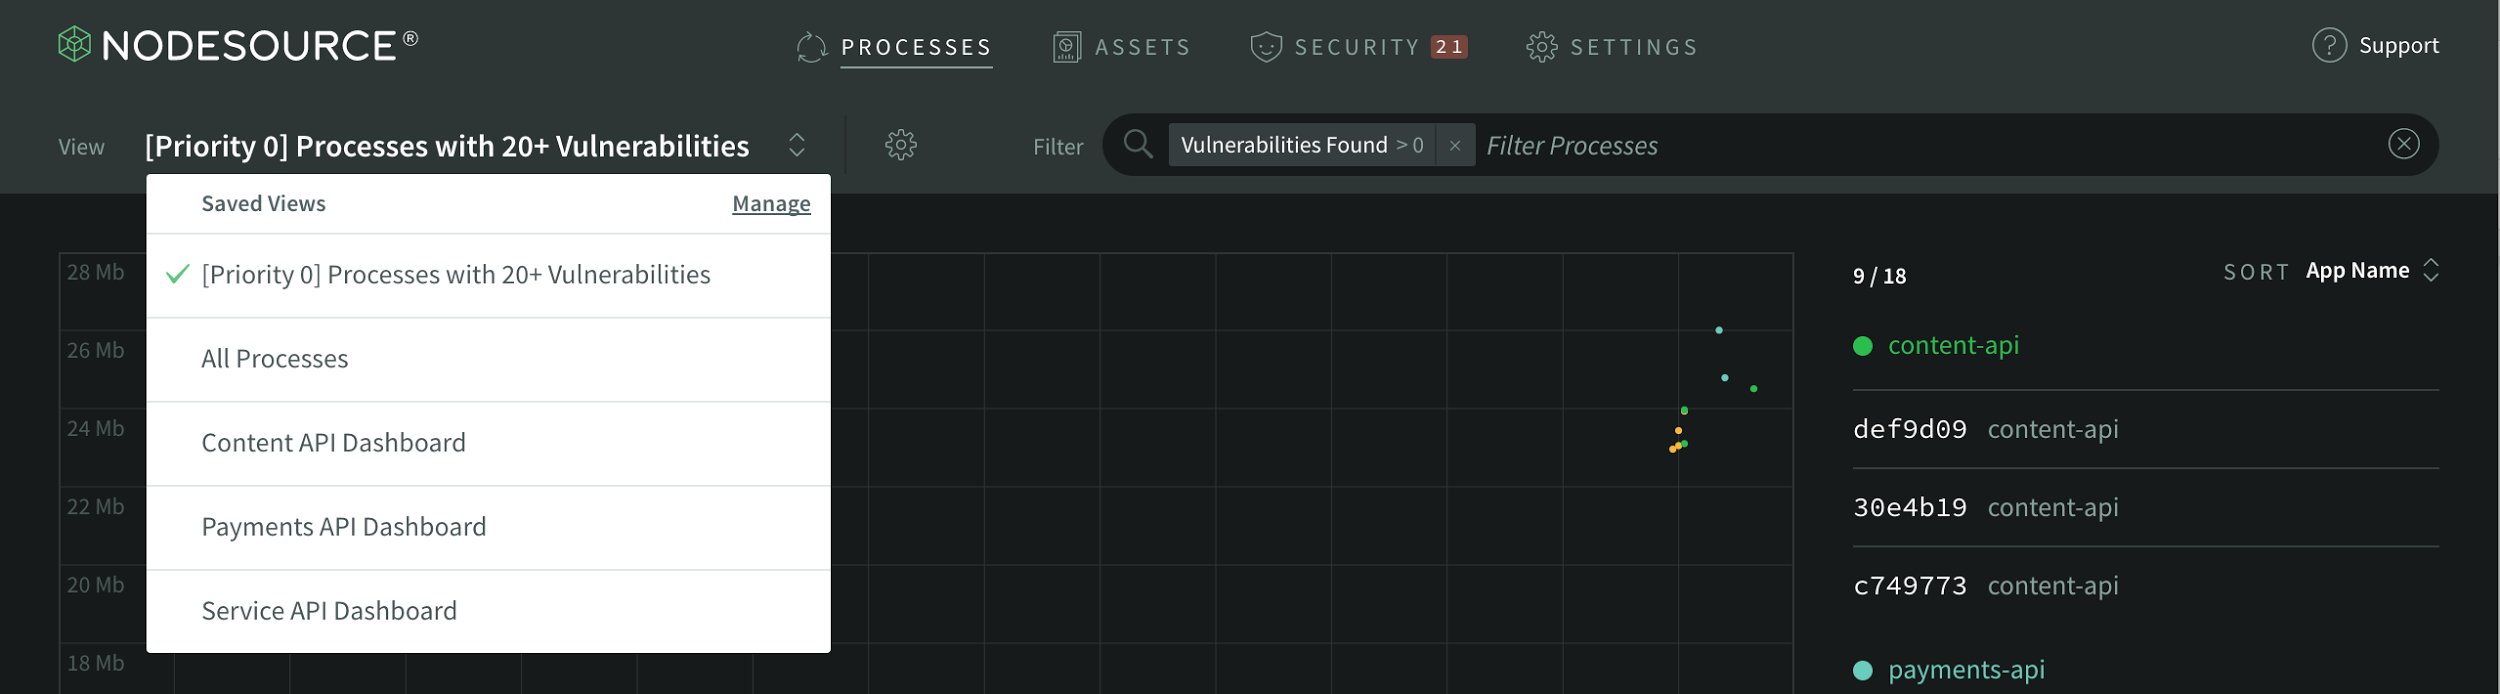
Once you’ve configured the actions and name to your liking, you can click "Submit" and your view will be saved. Once saved, you can load the console view at any point by selecting it from the Saved Views dropdown:
Updating a View
So after talking with my team, I realized that 20 vulnerabilities may be a bit much. In most cases, you’ll want to know about any process with vulnerabilities–you really don’t want to be shipping code with flaws that could be exploited.
Based on their feedback, I’m going to update the view to capture running processes with any non-zero number of vulnerabilities.
To do so, I’ll make sure I’m still looking at the [Priority 0] Processes with 20+ Vulnerabilities view, then click on the Vulnerabilities Found > 20 filter in the filter search bar:
Clicking on this filter will pop up the Vulnerabilities Found Filter configuration:
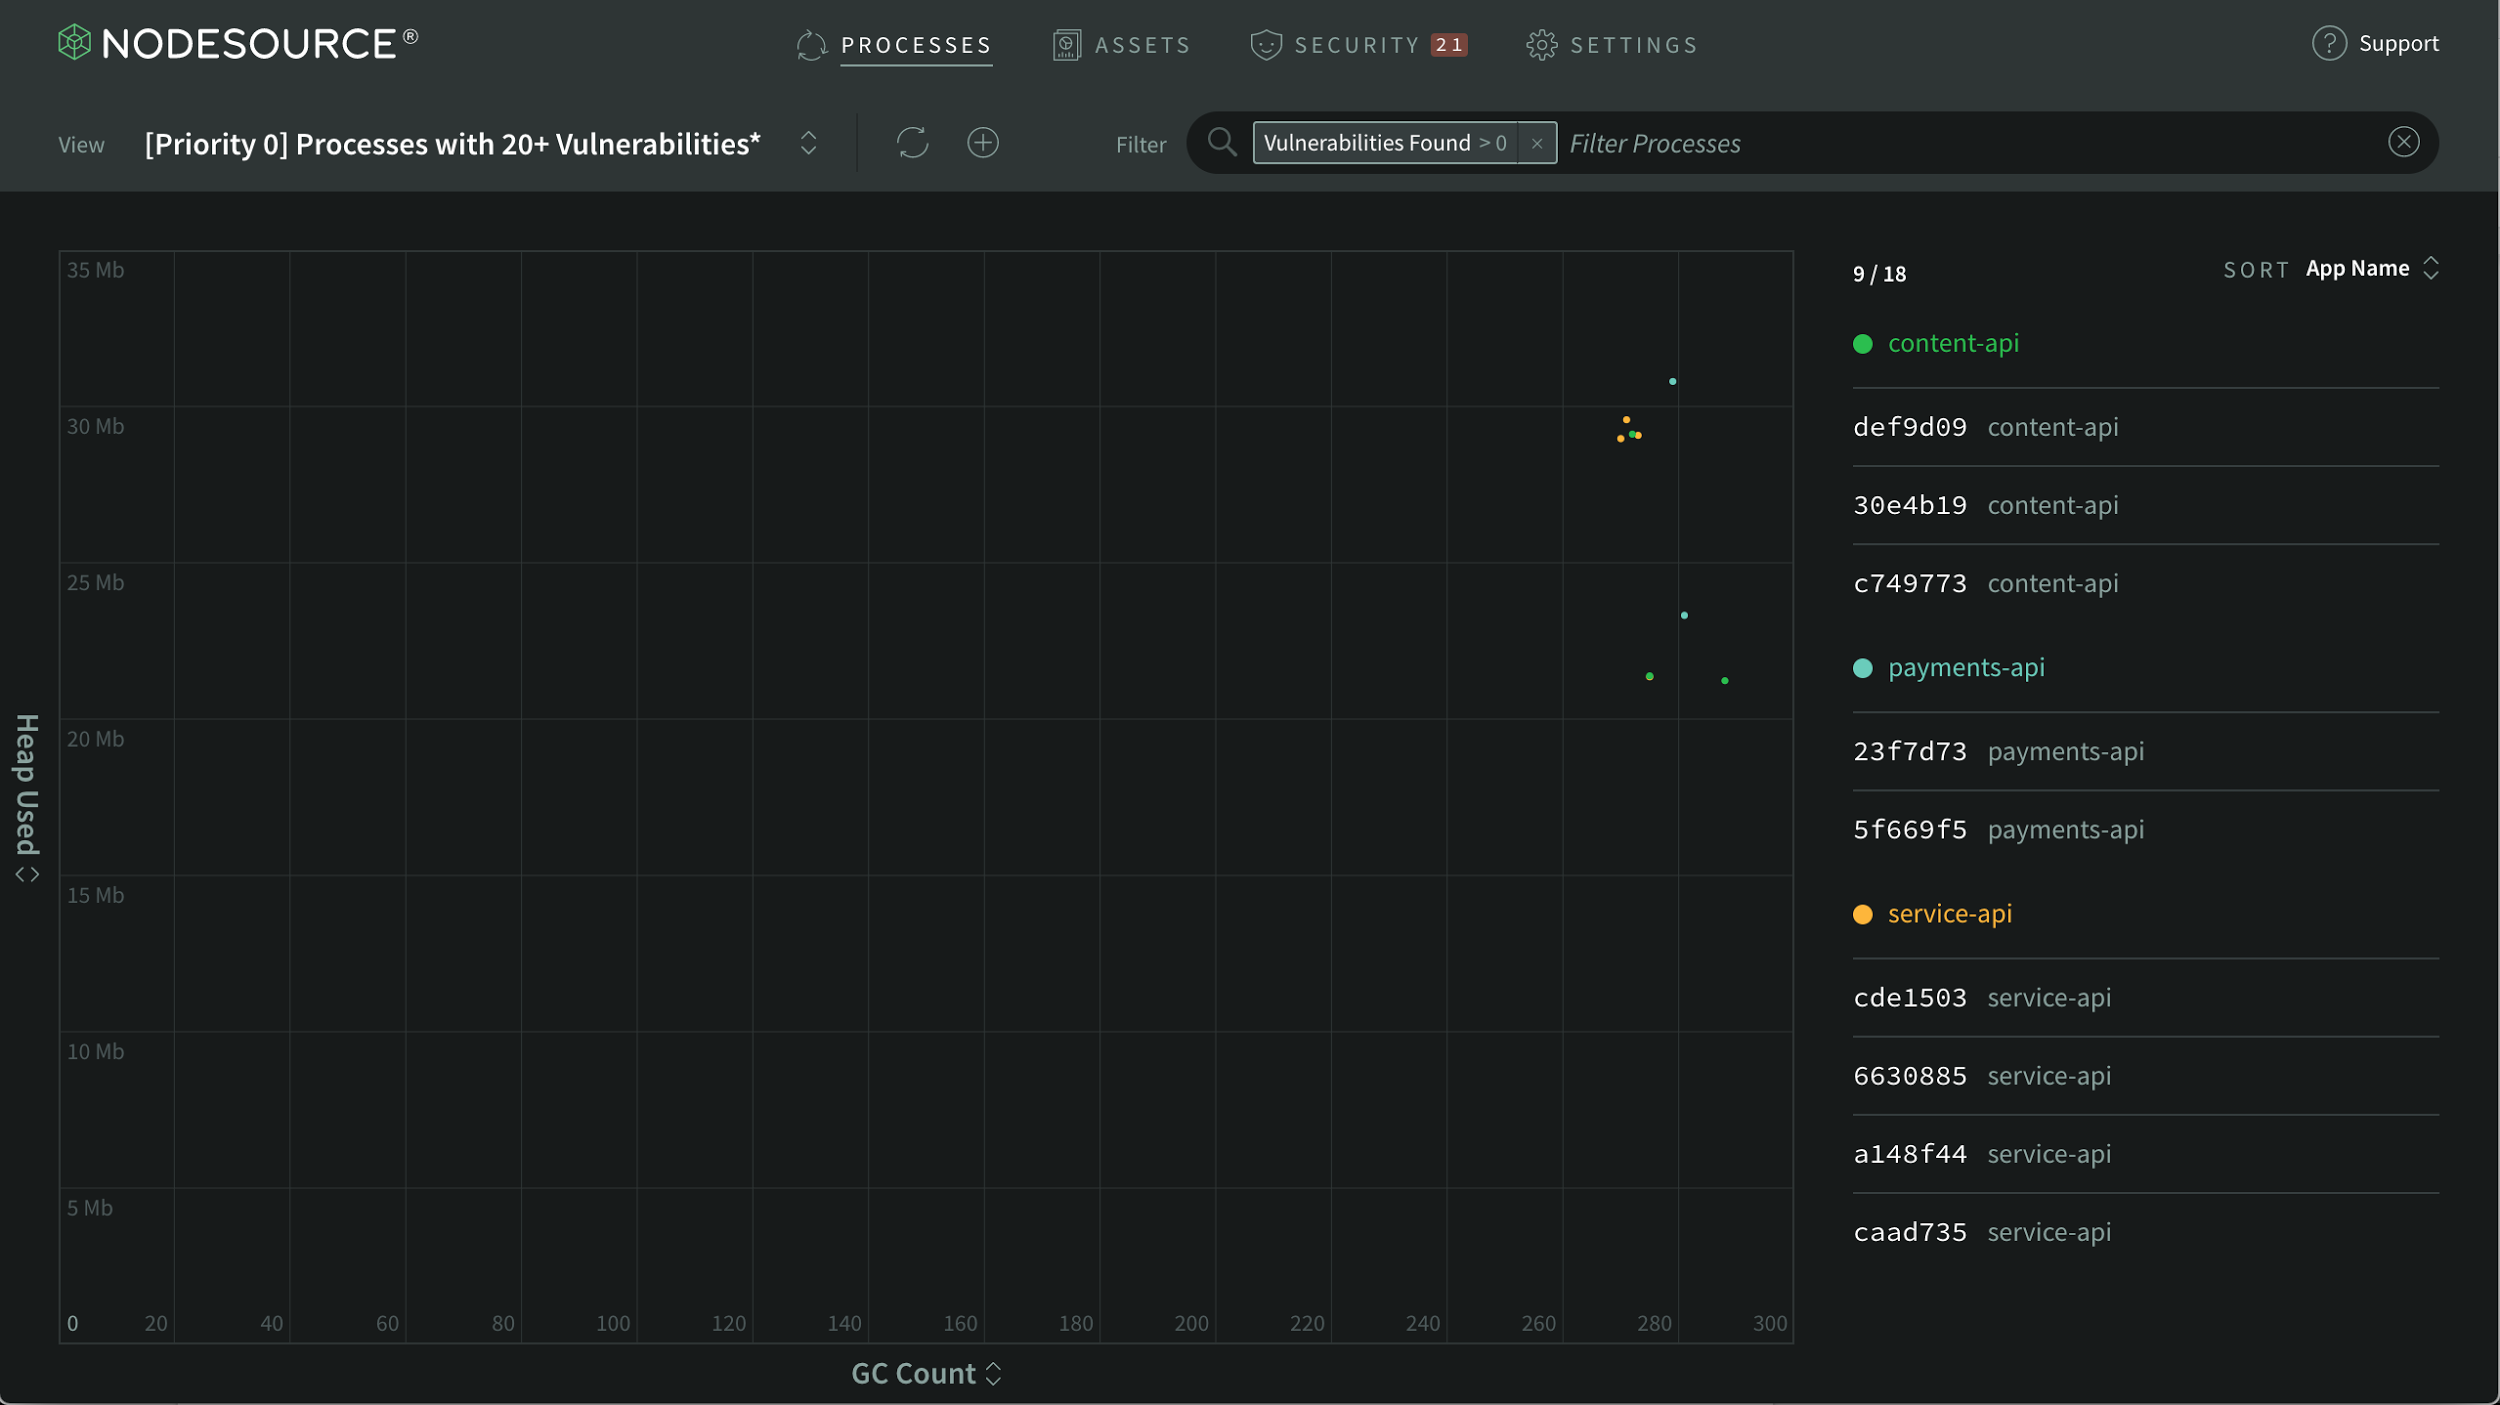
From there, I’ll change the value for Vulnerabilities Found from 20 to 0, and click Set Filter.
Now, I’ll see an updated console with my connected processes that match the new filter:
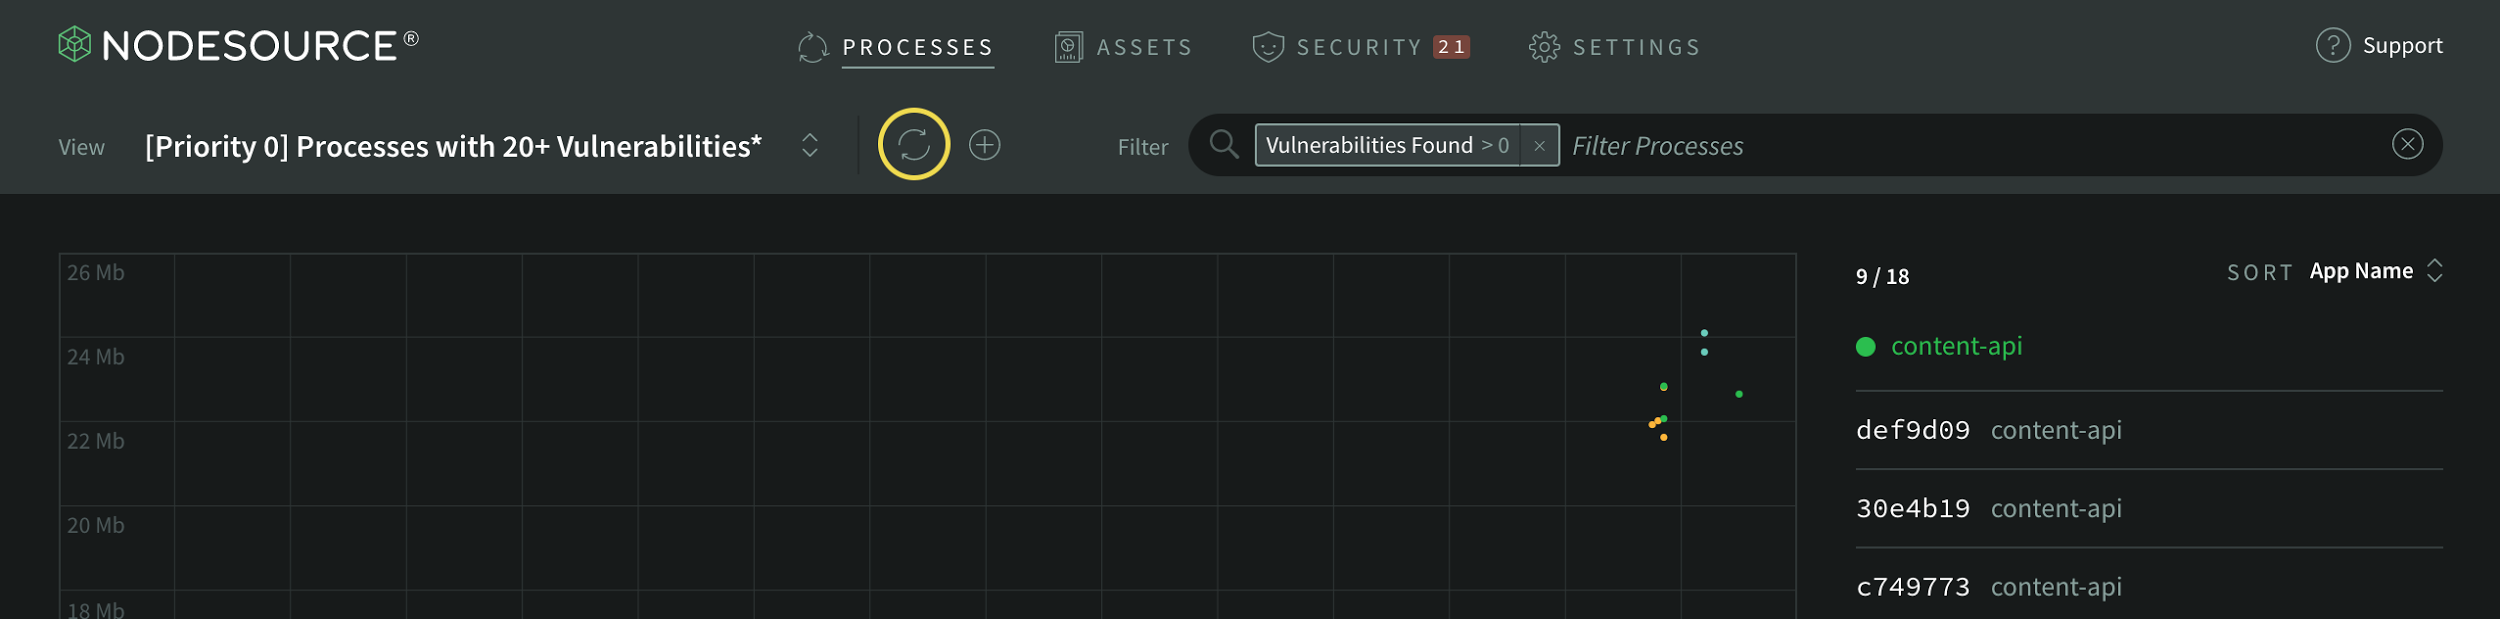
To save the changes to our updated view, click the override button (below, circled in yellow) and submit the changes on the Save View overlay.
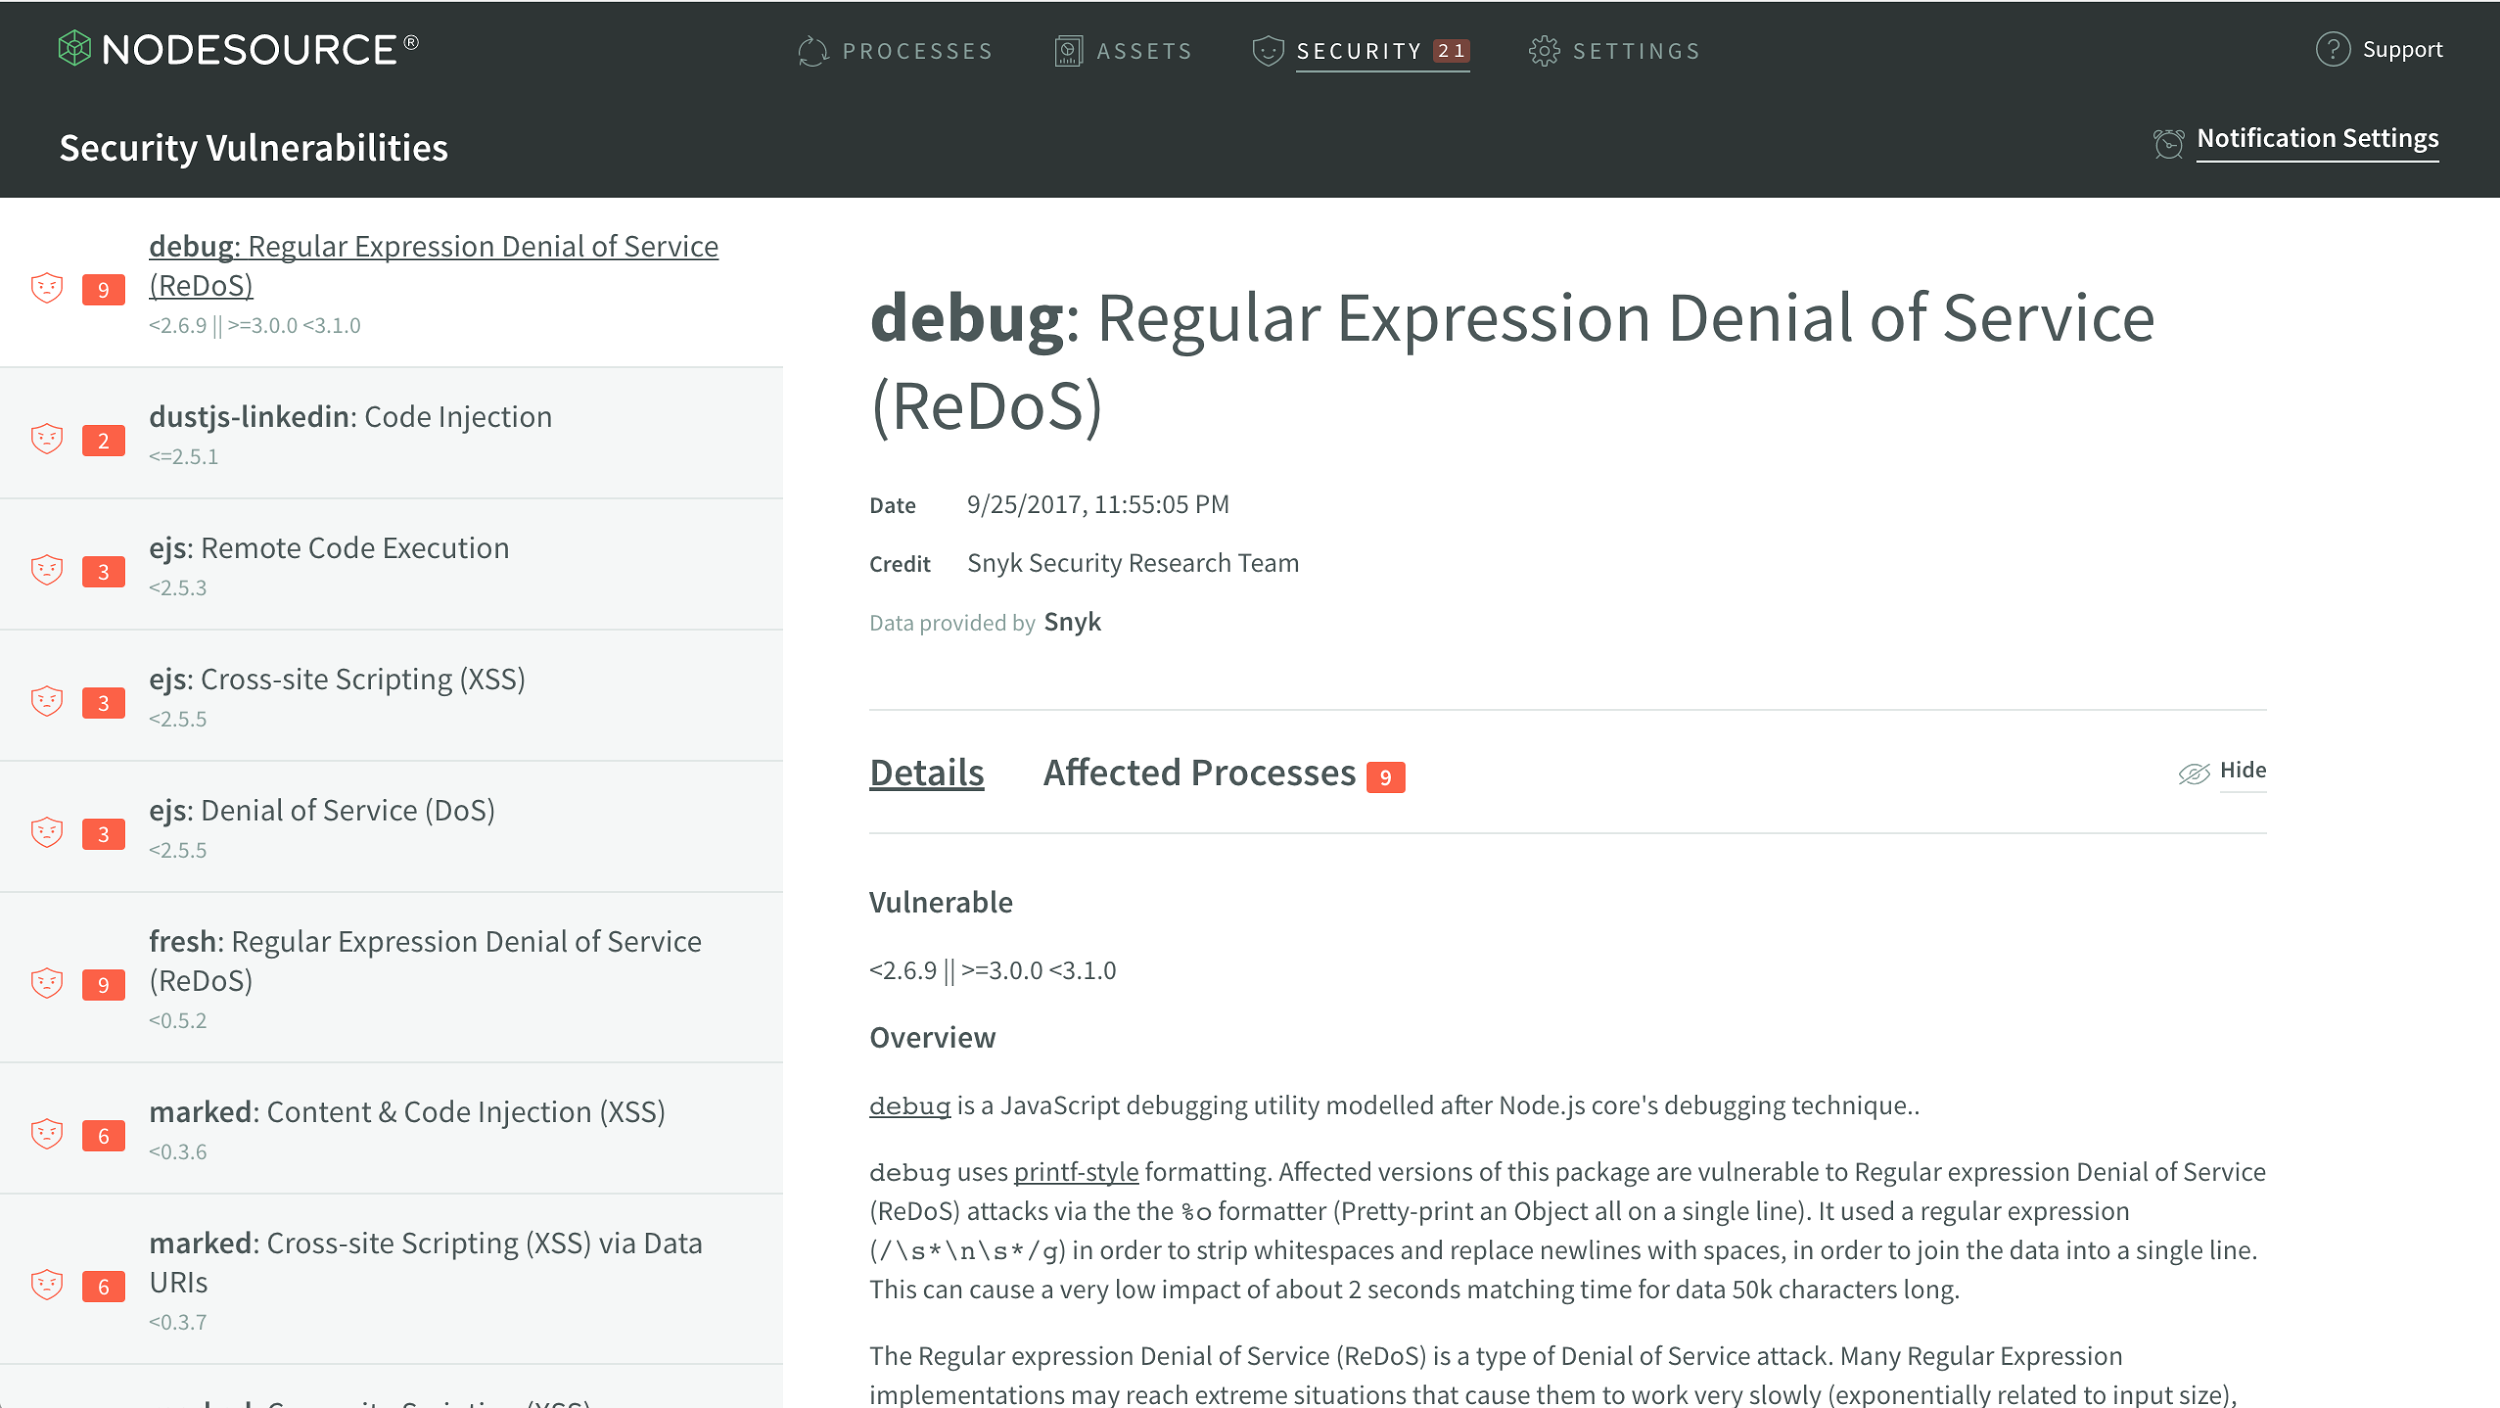
I’m not at all happy about the fact that 3/3 of my team’s mission-critical APIs have vulnerabilities, but at least we know. I can send this information over to them and point them to the Security tab in the N|Solid console to figure how which modules contain vulnerabilities, which processes are affected, and how they can quickly resolve the vulnerabilities:
Switching Views
Finally, I’d like to go back and see all the processes in my console. To do so, I can simply click on the name of the current view–this will open up a dropdown that lists all saved views, a link to the Saved Views manager (located in Settings > Saved Views), and the All Processes view to return to the default view, All Processes, or any of your other saved views:
One Last Thing…
If you’re not already using N|Solid, but are interested in trying it out, you can give it a spin with a free trial. If you’re interested, but want to learn more about what it can actually do, I suggest heading over to the technical details page to get a bit deeper into the nitty gritty of the product.
Hopefully you learned something new about N|Solid that’ll be useful to you! If you’ve got any comments or questions, feel free to reach out to the team at @NodeSource on Twitter, and keep an eye on the NodeSource blog for more technical deep-dives of N|Solid coming soon!