Announcing N|Solid 3.2
We're excited to announce that N|Solid 3.2 has shipped with exciting enhancements to our existing suite of runtime diagnostics and security monitoring tools!
Today's release introduces Saved View presets, a host of refinements to the CPU profiling UI, as well as improved metadata capture/displays for CPU profiles and heap snapshots.
Saved View Presets
The N|Solid Console’s Saved Views offer a highly customizable way to compare application performance metrics and set thresholds for triggering actions, such as heap snapshots and team notifications.
Let’s take a process that has been benchmarked to operate with 20-40 Mb of memory, and should definitely never be using over 50 Mb of memory at a given time. With N|Solid, this resource threshold can be stored as a Saved View. Should the process cross the threshold, a heap snapshot can be automatically generated and your team notified via email or webhook, capturing and communicating real-time application diagnostics when it matters most.
In previous versions of N|Solid, all Saved Views were created by Console users. With 3.2, the Processes View now comes with five Saved View Presets:
Memory Clustering. This preset compares Heap Used and Resident Set Size, and helps capture processes' total memory space.
Garbage Collection Clustering. In the GC Clustering preset view, GC Count and GC Duration 99th Percentile are directly compared, providing insight into how garbage collection duration affects processes' memory usage.
Garbage Collection Anomalies. By comparing Garbage Collections Count and Process Uptime, this saved view provides insights into GC Count outliers.
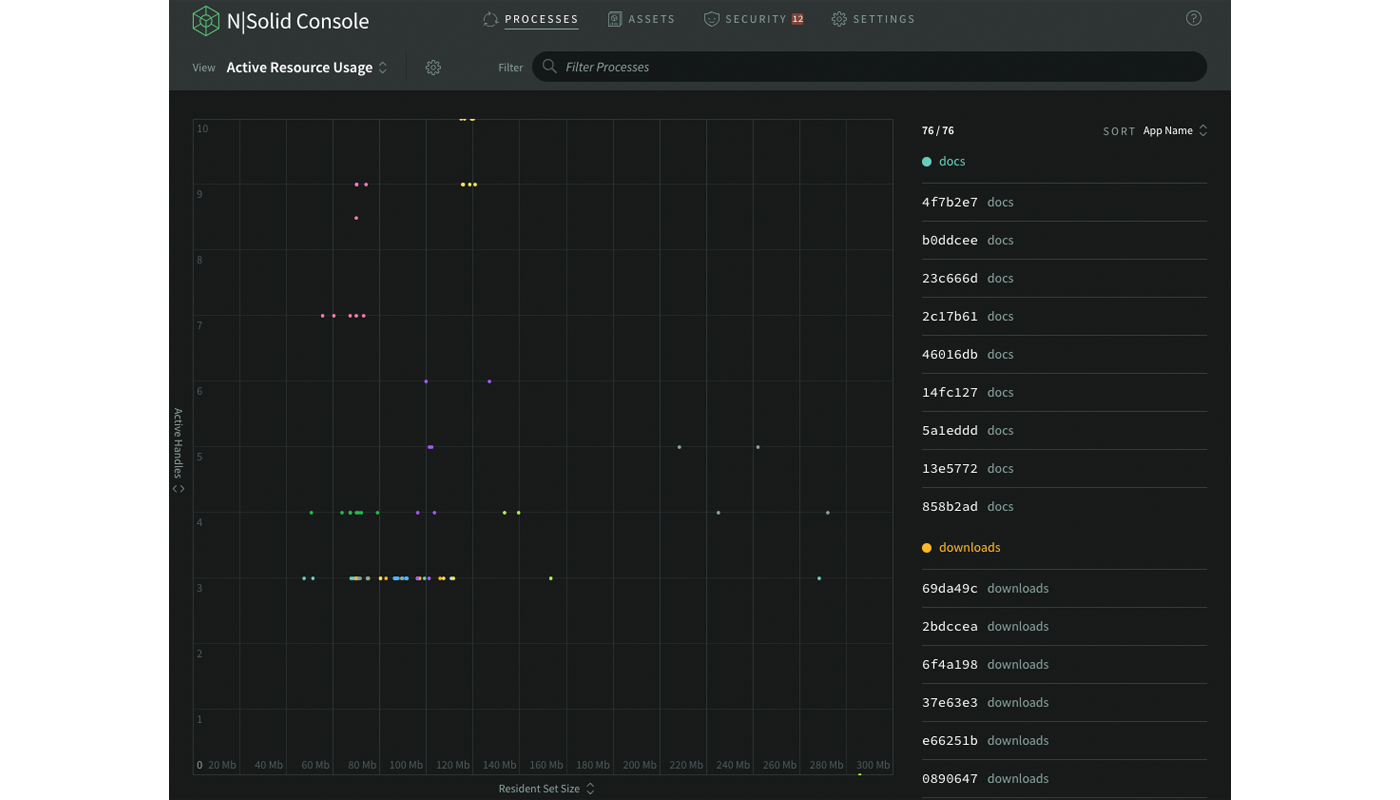
Active Resource Usage. With this preset, the number of Active Handles and the Resident Set Size are compared, providing insight into longer term resource usage.
Garbage Collection Efficiency. This preset compares Major Garbage Collections Count and GC Median Duration to provide insights into garbage collection efficiency.
These preset views were selected to provide teams with powerful out-of-the-box insights into the running state of their Node.js applications.
CPU Profile Visualization Improvements
With 3.2, N|Solid's CPU profile visualizations come equipped with two new search features to help teams drill down through the call stack quickly and effectively.
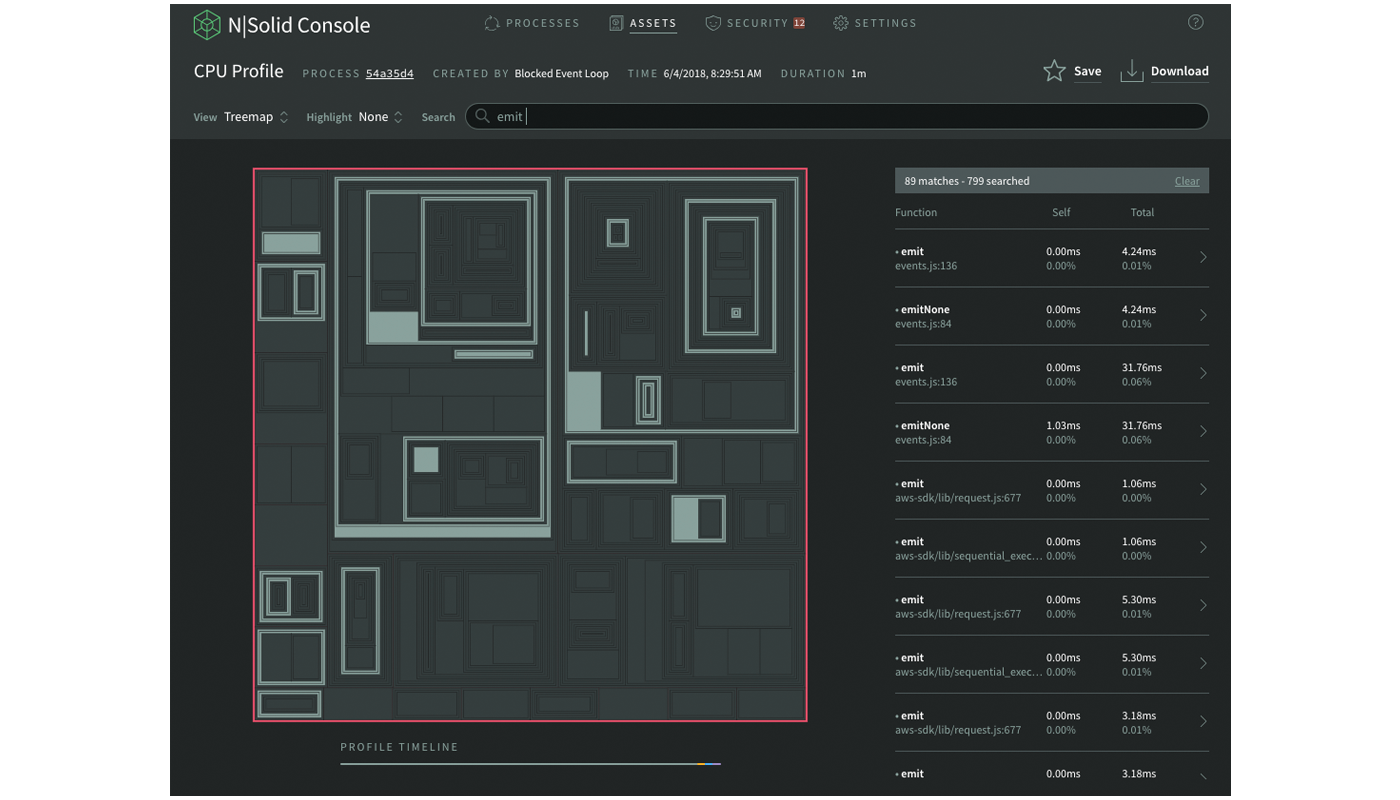
The first improvement is that CPU profiling visualizations are now color-responsive to search queries for function and file names. Think you have a problem with an emit function? Need to quickly find instances across your call stack? Now you can simply query it as part of a string search and see all instances highlighted immediately.
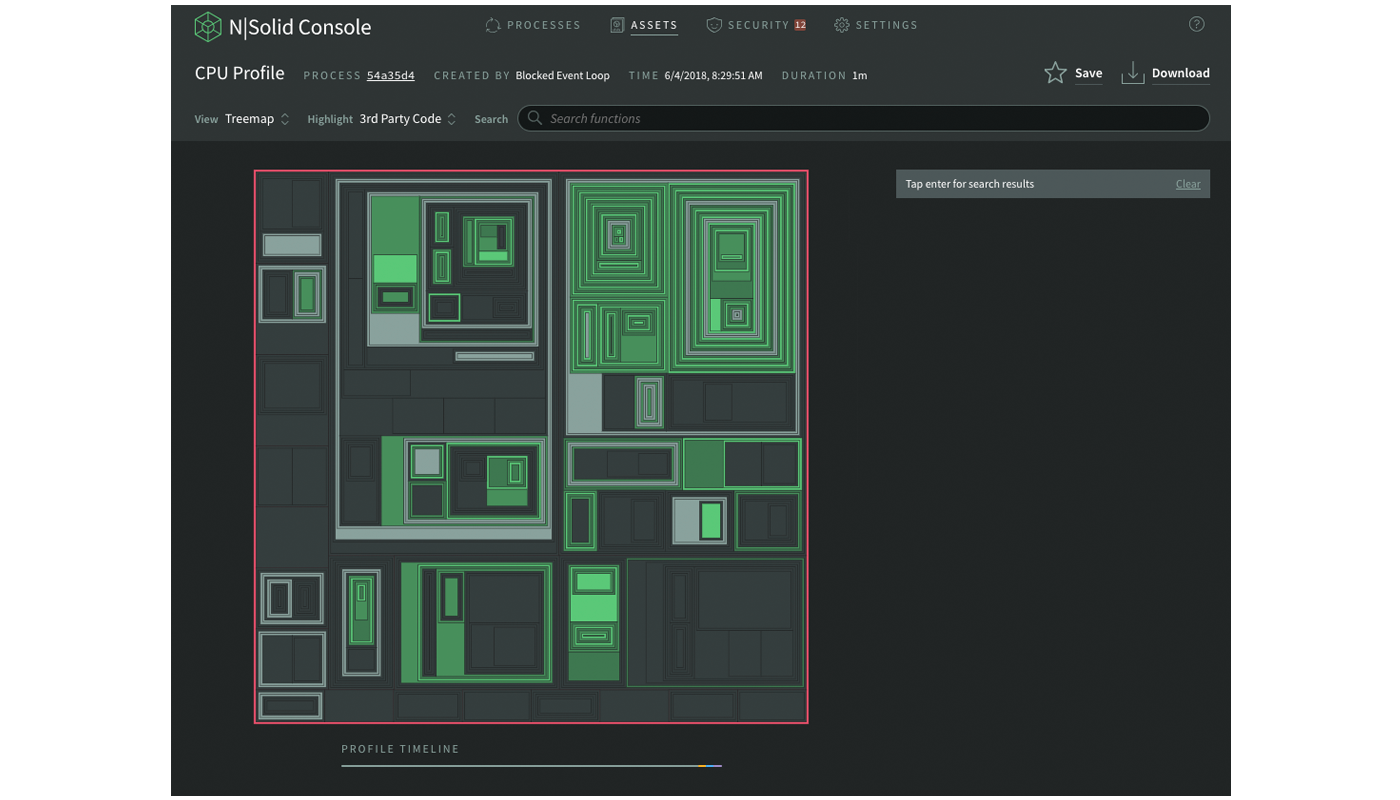
The second upgrade to CPU profiling visualizations is that they are now color-responsive to code source, i.e. core, user, and 3rd party code can be highlighted individually. Assuming your application’s code base comprises of a mix of all three, this feature helps teams quickly identify problematic code.
Capture and Display Asset Creation Source
When creating CPU profiles and heap snapshots with N|Solid 3.2, the source of that asset creation is now preserved and displayed throughout the UI with a ‘Created By’ field.
This allows you to determine whether a given view was created through user interaction or automatically as part of a threshold alert; if the asset was triggered by a threshold alert, the asset will now also link back to the corresponding Saved View (as long as the View still exists), providing developers with a fuller picture of the data they are using.
New to N|Solid?
If you’ve never tried N|Solid, now is a great time to get started. N|Solid is a hardened drop-in replacement for the Node.js runtime that has been enhanced to address the unique needs of the Enterprise, providing teams with better security and meaningful insights that include application performance diagnostics and real-time vulnerability monitoring.
As always, we’re happy to hear your thoughts. Feel free to get in touch with our team or reach out to us on Twitter at @NodeSource.