The 10 Key Features in Node.js v6 LTS Boron After You Upgrade
As we've previously covered in the Node.js v6.9.0 Release Brief, the Node.js v6 release line went into LTS this week. This is a major step for both Node.js and its users. The release brings a slew of feature additions to a Long Term Service release line.
With that, you may be wondering what some of the best features added to the newly minted v6 LTS are when compared to the Node.js v4 LTS release line. Luckily, we've compiled a list of 10 of the most useful and interesting new features below - including some highlights like the DevTools Inspector, unhandled Promise rejection warnings, and the Process Warnings API!
1. DevTools Inspector Integration
Last year, the Chromium team approached the Node core team and enquired whether there was any interest in re-using the DevTools debugger that was bundled with Blink as a way of interacting with Node.js. The Node.js debugger has not been well cared for over the years and even though it’s functional, JavaScript debuggers in modern browsers have advanced well beyond what Node can offer natively.
In Node.js v6.3.0, Google’s v8_inspector protocol was extracted from Blink and shipped with Node. This functionality is still considered “experimental” by the Node core team, meaning it is not yet extensively documented and may still be removed in a future version of Node without going through a deprecation cycle. However, given the popularity and power of this tool, and the this is unlikely to happen. A more likely outcome would be for the old debugger to eventually be removed and completely replaced by this new feature.
When Node.js is run with the --inspect command-line argument (with optional port number argument), a chrome-devtools:// URL is printed to the console. Entering this URL in a Chrome web browser will launch a remote debugging connection directly into the process. Add the additional --debug-brk command line argument to break on the first line of your application so you have time to work with the debugger. You can use Chrome’s DevTools to debug a Node application with similar power with which you can debug frontend JavaScript, including features such as live code editing and full asynchronous call stacks. Read Paul Irish’s post for more details on the kinds of features available right now in Node.js v6 LTS.
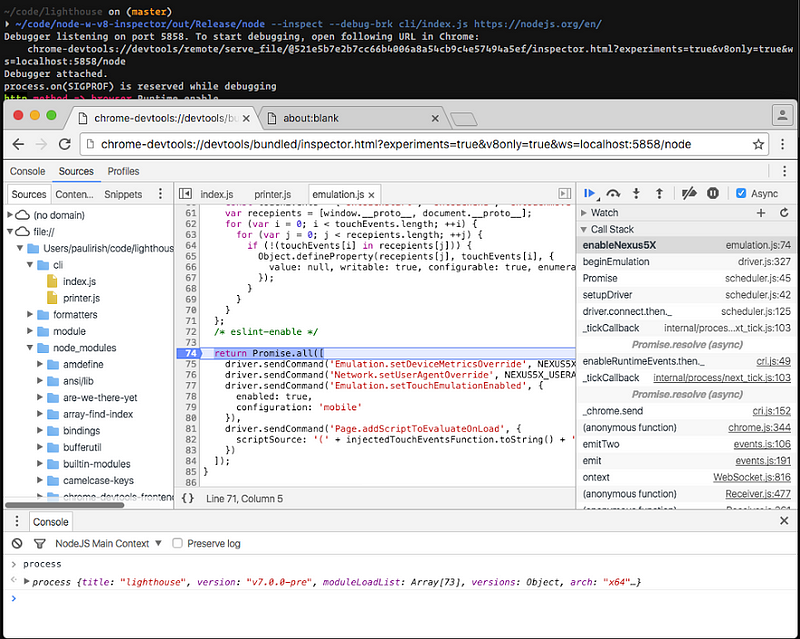
Source: Paul Irish's article, Debugging Node.js with Chrome DevTools
Far from being exclusive to Chrome, this new protocol is a WebSockets JSON protocol that is well documented and is already implemented in a number of clients and servers. Already the Visual Studio Code editor announced support for this experimental feature and you can even use it from command line interfaces.
2. Capture Names of Listeners on an EventEmitter
The eventNames() method - added in Node.js 6.0.0 - will return an array with the names of all the events that are being listened to by user callbacks on a given EventEmitter object. This kind of functionality wasn’t previously available unless you were using the internal _events property.
Finding the names of events being listened to can be useful for detecting when an event isn’t being listened to—which allows for attaching listeners to handle events that aren’t being handled, or to ignore work that’s specific to some events that may not be needed otherwise.
3. Overhauled Buffers Constructor APIs
The Buffer Constructor API was overhauled, deprecating the old new Buffer(...) and adding Buffer.from() and Buffer.alloc() as the preferred replacements. The APIs were added to Node core in v5.10.0, and allow two different uses: Buffer.from() creates a Buffer from an Array-like (such as an Array, String, or another Buffer), and Buffer.alloc() creates a zero-filled Buffer of a specified size.
Additionally, a the --zero-fill-buffers CLI flag was added in v5.10.0 to automatically force zero-filling of all newly created Buffers in a Node application.
The new Buffer constructor feature set provides a clearer interface in order to make it less likely that an application does not accidentally leak old memory space by improper Buffer creation.
Use of the plain Buffer() constructor is deprecated in the Node.js documentation which explains why the new API should be used. In a future version of Node.js, a warning will be printed to standard error when a Buffer is created using the old constructor as well.
4. Unhandled Promise rejection warnings
One of the criticisms often made against Promises is the ease with which errors can be swallowed and ignored. Since io.js and Node.js v5, the ’unhandledRejection’ and ’rejectionHandled’ events, emitted on the process object, have been available to provide some insight into Promise rejections that are not handled. Due to the semantics of Promise error handling, it’s not as clear as an uncaughtException since a rejection could potentially be stored and handled at a later time. In fact, one of the early candidates for the ’unhandledRejection’ event name was ’possiblyUnhandledRejection’. Modern idiomatic Promise usage, however, suggests that this is an anti-pattern and that rejection handlers should be placed on a promise near to its creation, either directly on construction or straight afterward.
Since Node.js v6.6.0, the ’unhandledRejection’ event now also causes a warning to be printed to standard error.
$ node
> new Promise((resolve, reject) => { setTimeout(() => { reject(new Error('Whoa!')) }, 100) })
Promise { <pending> }
> (node:35449) UnhandledPromiseRejectionWarning: Unhandled promise rejection (rejection id: 1): Error: Whoa!
This behavior can be turned off (at your peril!) with the --no-warnings command line argument or made more verbose to include stack traces with the --trace-warnings command line argument so you can track down the location of the errant code.
$ node
$ node --trace-warnings
> new Promise((resolve, reject) => { setTimeout(() => { reject(new Error('Whoa!')) }, 100) })
Promise { <pending> }
> (node:35484) UnhandledPromiseRejectionWarning: Unhandled promise rejection (rejection id: 1): Error: Whoa!
	at emitPendingUnhandledRejections (internal/process/promises.js:57:27)
	at runMicrotasksCallback (internal/process/next_tick.js:61:9)
	at _combinedTickCallback (internal/process/next_tick.js:67:7)
	at process._tickDomainCallback (internal/process/next_tick.js:122:9)
Since a rejection handler could still be handled after Promise creation, via the catch() method, the warning is not emitted or printed until after the next tick of the event loop after the rejection.
$ node
> function resolver (resolve, reject) { setTimeout(() => { reject(new Error('Whoa!')) }, 100) }
undefined
> // rejection handler attached on same tick:
> p = new Promise(resolver); p.catch((err) => { console.error(err) });
Promise { <pending> }
> Error: Whoa!
	at Timeout.setTimeout (repl:1:81)
	at ontimeout (timers.js:365:14)
	at tryOnTimeout (timers.js:237:5)
	at Timer.listOnTimeout (timers.js:207:5)
> // rejection handler added on a later tick, causing an additional ‘rejectionHandled’ event
> p = new Promise(resolver)
Promise { <pending> }
> (node:35560) UnhandledPromiseRejectionWarning: Unhandled promise rejection (rejection id: 1): Error: Whoa!
> p.catch((err) => { console.error(err) });
Promise { <pending> }
> (node:35560) PromiseRejectionHandledWarning: Promise rejection was handled asynchronously (rejection id: 1)
Error: Whoa!
	at Timeout.setTimeout (repl:1:81)
	at ontimeout (timers.js:365:14)
	at tryOnTimeout (timers.js:237:5)
	at Timer.listOnTimeout (timers.js:207:5)
5. Quick and Safe Temporary Directory Creation
The fs.mkdtemp() API was added to Node core in v5.10.0 to provide a guaranteed way to create a unique temporary directory. The API generates six random characters to be appended behind a required directory prefix argument. This functionality was previously possible with user-created modules like unique-temp-dir although JavaScript implementations of this functionality all suffer from performance problems compared to using native system calls and not all are guaranteed safe.
This API allows you to integrate with system default temporary directories, to absolutely ensure that there won’t be directory conflicts. Having this as a standardized feature in Node.js is a guarantee that the API will be consistent for any module or application that needs to use temporary directories.
6. Timing Attack Prevention
The crypto.timingSafeEqual() API was added to Node core in v6.6.0 to help avoid timing attacks.
The API allows comparison without leaking timing information about the comparison, which could lead to a malicious party being able to infer values being compared. With the addition of this API to the crypto module allows it to be used outside of assert. As a rule of thumb, use this API if you need to compare values, where one is derived from user-input and another is a secret (or derived from a secret).
7. Process Warnings API
The new (Process Warning)(https://nodejs.org/dist/latest-v6.x/docs/api/process.html#process_event_warning) API was added in v6.0.0 and adds the ability to listen to process warnings emitted by Node.js, and provides an API to override the default handler, to be used in custom logging system for instance. For example, if you are using a custom JSON logger you can now catch Node core warnings and also have them logged as JSON.
The API can also be used by non-core code to emit non-fatal warnings as appropriate. e.g. process.emitWarning('Something Happened!', 'CustomWarning'); or process.emitWarning('This API is deprecated', 'DeprecationWarning');.
Currently, Node core emits:
’DeprecationWarning’s when “runtime deprecated” core APIs are used.’PromiseRejectionHandledWarning’when aPromiseis rejected but there is not rejection handler attached to receive it.’MaxListenersExceededWarning’when anEventListenerhas more listeners added than themaxListenerscount (10 by default). This is normally an indication of a possible memory leak, where listeners are added but not properly removed when no longer needed.
Warnings are still printed to standard error, but so are custom userland errors:
$ node -e 'process.emitWarning("Something Happened!", "CustomWarning");'
(node:33526) CustomWarning: Something Happened!
Note that the warning output also now contains the process ID.
In addition, this API also brings some new command line arguments to adjust warning output:
--no-warningsto disable printing to standard error (the internal’warning’event will still fire)--no-deprecationto disable printing deprecation warnings (only) to standard error (the internal’warning’event will still fire)--trace-warningsto have the stack trace printed to standard error, mirroring error output, useful for finding where a deprecated API is being used from in your own code or a dependency--trace-deprecationfor stack traces just for deprecation warnings--throw-deprecationto treat a deprecation warning as a thrown error
$ node -e 'require("sys")'
(node:33668) DeprecationWarning: sys is deprecated. Use util instead.
$ node --no-deprecation -e 'require("sys")'
$ node --trace-deprecation -e 'require("sys")'
(node:33681) DeprecationWarning: sys is deprecated. Use util instead.
	at sys.js:10:6
	at NativeModule.compile (bootstrap_node.js:497:7)
	at Function.NativeModule.require (bootstrap_node.js:438:18)
	at Function.Module._load (module.js:426:25)
	at Module.require (module.js:497:17)
	at require (internal/module.js:20:19)
	at [eval]:1:1
	at ContextifyScript.Script.runInThisContext (vm.js:25:33)
	at Object.exports.runInThisContext (vm.js:77:17)
	at Object.<anonymous> ([eval]-wrapper:6:22)
$ node --throw-deprecation -e 'require("sys")'
internal/process/warning.js:45
  	throw warning;
  	^

DeprecationWarning: sys is deprecated. Use util instead.
	at sys.js:10:6
	at NativeModule.compile (bootstrap_node.js:497:7)
	at Function.NativeModule.require (bootstrap_node.js:438:18)
	at Function.Module._load (module.js:426:25)
	at Module.require (module.js:497:17)
	at require (internal/module.js:20:19)
	at [eval]:1:1
	at ContextifyScript.Script.runInThisContext (vm.js:25:33)
	at Object.exports.runInThisContext (vm.js:77:17)
	at Object.<anonymous> ([eval]-wrapper:6:22)
8. Symlink Preservation
Instructs the module loader to preserve symbolic links when resolving and caching modules. When turned on, module paths are preserved when setting __dirname and __filename and also when using the location to resolve paths to other modules using require() instead of using the “realpath” of the linked file.
The original discussion for this feature used the following example of behavior that doesn’t work when symbolic links aren’t preserved:
Resolves properly:
app
    index.js //require("dep1")
    node_modules
        dep1
            index.js //require("dep2")
        dep2
            index.js //console.log('fun!'):
Does not resolve, where the user expectation may be that it should since the link is in an appropriate location.
app
    index.js //require("dep1")
    node_modules
        dep1 -> ../../dep1
        dep2
            index.js
dep1
    index.js //require("dep2")
This kind of behavior is sought when developing using peer dependencies that could be linked together rather than manually copied.
Preserving symbolic links was enabled as the default behavior in Node.js v6.0.0, under a mistaken belief that the impact to the ecosystem would be mostly positive. Unfortunately a number of use-cases were discovered via bug reports where the new functionality was breaking applications or causing poor performance because of assumptions made based on how Node previously worked. You can read more about the problem in the original thread which became very active after v6.0.0 was launched and was the focal point of discussion regarding how to approach the problems being reported.
The --preserve-symlinks command line argument was finally added and the default behavior restored in v6.2.0. While the core team have suggested that --preserve-symlinks is only a temporary solution until a better one can be found, so far there have not been proposals for a way forward.
9. V8 Performance Profiling Directly Through Node.js
The new --prof-process command line argument, added in Node.js v5.2.0, runs the built-in formatter for V8 performance profiles. These profiles have been possible with Node.js for some time by using the --prof command line argument that is passed straight to V8.
When an application is run with --prof, a file with a name such as isolate-0x102004c00-v8.log (where the octal number changes with each run) is created for each “isolate” (an isolated V8 VM instance with its own heap) within the application (child processes or use of the vm module may cause an application to use more than a single isolate).
Unfortunately, these profiling log output files are mostly not human-readable and are very verbose:
$ node --prof ./map-bench.js
$ wc isolate-0x*.log
	3375	4571  419868 isolate-0x102004c00-v8.log
	3801	4968  514577 isolate-0x102801000-v8.log
	4319	5493  628883 isolate-0x103800a00-v8.log
   11495   15032 1563328 total
V8 also ships with what it calls a “tick processor” that is able to parse these files and produce human-readable and useful output. Formerly you would have to install this from npm, such as tick, but the problem for authors and users is that the tick processor needs to be kept up to date with each version of V8 in order to produce helpful output from the log files it produces. Shipping a tick processor within Node.js removes this need and also make a helpful code profiling tool easily accessible for users.
$ node --prof-process isolate-0x103800a00-v8.log
Statistical profiling result from isolate-0x103800a00-v8.log, (2819 ticks, 201 unaccounted, 0 excluded).

 [Shared libraries]:
   ticks  total  nonlib   name
 	17	0.6%      	/usr/lib/system/libsystem_platform.dylib
  	6	0.2%      	/usr/lib/system/libsystem_c.dylib

 [JavaScript]:
   ticks  total  nonlib   name
	112	4.0%	4.0%  Stub: StringAddStub_CheckNone_NotTenured
 	47	1.7%	1.7%  Stub: CEntryStub
 	43	1.5%	1.5%  LazyCompile: *runFakeMap /home/rvagg/node/benchmark/es/map-bench.js:49:20

…

 [C++]:
   ticks  total  nonlib   name
	276	9.8%	9.9%  v8::internal::NameDictionaryBase<v8::internal::NameDictionary, v8::internal::NameDictionaryShape>::FindEntry(v8::internal::Handle<v8::internal::Name>)
	239	8.5%	8.5%  v8::internal::StringTable::LookupKey(v8::internal::Isolate*, v8::internal::HashTableKey*)
	127	4.5%	4.5%  v8::internal::HashTable<v8::internal::NameDictionary, v8::internal::NameDictionaryShape, v8::internal::Handle<v8::internal::Name> >::Rehash(v8::internal::Handle<v8::int

…

 [Summary]:
   ticks  total  nonlib   name
	372   13.2%   13.3%  JavaScript
   2223   78.9%   79.5%  C++
 	43	1.5%	1.5%  GC
 	23	0.8%      	Shared libraries
	201	7.1%      	Unaccounted

…
(Output heavily trimmed to show only some highlights)
Not only can you use the output to see which parts of your code are taking up most of the VMs time and where they are being called from but you also get some insight into how the VM is treating your code. For instance, the * next to JavaScript function names indicates that the code was optimized by V8. More information on how to read this data can be found on the V8 wiki.
Of course, if you would like live profiling of applications while they run in production, you should try NodeSource’s N|Solid to view similar data in graphical format.
10. Process CPU usage
The process.cpuUsage() API was added to Node core in v6.1.0, and returns an object that contains both user and system CPU time of the current process in microseconds.
The API allows inference of how much time that the CPU was active by checking the total time difference in between two calls of the API, with some additional legwork.