12 Tips for Improving JavaScript Performance
One of the most important aspects when creating a webpage or an app, is performance. Nobody wants an app that crashes or a webpage that doesn’t load, and the waiting time of the users is not very long. According to Kissmetrics, 47% of visitors expect a website to load in less than 2 seconds, and 40 percent of visitors will leave the website if the loading process takes more than 3 seconds.
With these numbers in mind, performance should always be taken into account when creating your web apps. To help get you started, here are 12 ways to effectively improve application performance:
1. Cache in the browser
There are two options for doing this. The first is to use the JavaScript Cache API, which we can use by installing a service worker. The second is to use the HTTP protocol cache.
Scripts are often used to access a certain object. By storing a repeated access object inside a user-defined variable, as well as using a variable in subsequent references to that object, performance improvement can be achieved immediately.
2. Define the execution context
In order to effectively measure any improvements that you’re incorporating into your program, you must establish a set of well-defined environments where is possible to test the performance of the code.
Trying to do performance tests and optimizations for all versions of all Javascript engines is not feasible in practice. But, it is not a good practice to do testing in a single environment, as this can give you partial results. So, it’s important to establish multiple well-defined environments and test that the code works on them.
3. Remove unused JavaScript
This step will not only reduce transmission time, but also the time it takes for the browser to analyze and compile the code. To do this, you must take into account the following points:
- If you detect a functionality that is not being used by users, it’s a good practice to remove it with all its associated JavaScript code, so the website will load faster and users will have a better experience.
- It is also possible that a library was included by mistake and is not necessary, or that you have dependencies that offer some functionality that is already natively available in all browsers, without the need to use additional code
4. Avoid using too much memory
You should always try to limit memory use to what is absolutely necessary, because is not possible to know how much memory is required by the device being used to run your app. Any time your code requests that the browser reserve new memory, the browser’s garbage collector is executed, and JavaScript is stopped. If this happens frequently, the page will work slowly.
5. Defer the load of JavaScript that is not necessary
Users want to see a page load quickly, but it’s not likely that all functions need to be available for the initial load of the page. If a user must perform a certain action in order for a function to be executed (e.g. by clicking on an element, or changing tabs), it’s possible to defer loading that function until after the initial page load.
In this way you can avoid loading and compiling JavaScript code that would delay the initial display of the page. Once the page is fully loaded, we can start loading those functionalities so that they are available immediately when the user starts to interact. In the RAIL model, Google recommends that this deferred load to be done in blocks of 50ms, so that it does not influence the user's interaction with the page.
6. Avoid memory leaks
If a memory leak is ongoing, the loaded page will reserve more and more memory, eventually occupying all the available memory of the device and severely impacting performance. You’ve probably seen (and likely been frustrated by) this type of failure, likely on a page with a carousel or image slider.
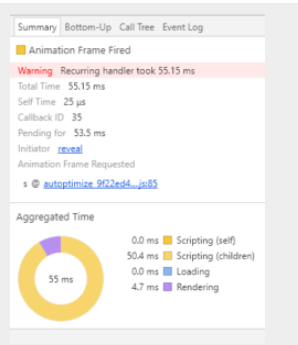
In Chrome Dev Tools, you can analyze if your website has memory leaks by recording a timeline in the Performance tab. Usually, memory leaks come from pieces of the DOM that are removed from the page but have some variable that makes reference to them and, therefore, the garbage collector can not eliminate them.
7. Use web workers when you need to execute code that needs a lot of execution time
According to the Mozilla Developers Network (MDN) documentation: “Web Workers makes it possible to run a script operation in a background thread separate from the main execution thread of a web application. The advantage of this is that laborious processing can be performed in a separate thread, allowing the main (usually the UI) thread to run without being blocked/slowed down.”
Web workers allow your code to perform processor-intensive calculations without blocking the user interface thread. Web Workers allow you spawn new threads and delegate work to these threads for efficient performance. This way, long running tasks which would normally block other tasks are passed off to a worker and the main thread can run without being blocked.
8. If you access a DOM item several times, save it in a local variable
Accessing the DOM is slow. If you are going to read the content of an element several times, it's better to save it in a local variable. But it’s important to keep in mind, if you will later remove the value of the DOM, the variable should be set to "null", so it doesn’t cause any memory leaks.
9. Prioritize access to local variables
JavaScript first searches to see if a variable exists locally, then searches progressively in higher levels of scope until global variables. Saving variables in a local scope allows JavaScript to access them much faster.
Local variables are found based on the most specific scope and can pass through multiple levels of scope, the look-ups can result in generic queries. When defining the function scope, within a local variable without a preceding variable declaration, it is important to precede each variable with let or const in order to define the current scope in order to prevent the look-up and to speed up the code.
10. Avoid using global variables
Because the scripting engine needs to look through the scope when referencing global variables from within function or another scope, the variable will be destroyed when the local scope is lost. If variables in the global scope can not persist through the lifetime of the script, the performance will be improved.
11. Implement the optimizations that you would apply in any other programming language
- Always use the algorithms with the least computational complexity to solve the task with the optimal data structures
- Rewrite the algorithm to get the same result with fewer calculations
- Avoid recursive calls
- Put in variables, the calculations and calls to functions that are repeated
- Factor and simplify mathematical formulas
- Use search arrays: they are used to obtain a value based on another instead of using a switch/case statement
- Make conditions always more likely to be true to take better advantage of the speculative execution of the processor
- Use bit-level operators when you can to replace certain operations, because these operators use fewer processor cycles
12. Use tools to detect problems
Lighthouse is a good performance tool for web pages, it helps you to audit performance, accessibility, best practices, and SEO. Google PageSpeed is designed to help developers understand a website’s performance optimizations and areas for potential improvement. The components are built to identify faults in a website’s compliance with Google’s Web Performance Best Practices, as well as automate the adjustment process.
In Chrome you can also use, the More Tools option in the main menu to see the memory and the CPU used by each tab. For even more advanced analysis, you can use the developer tools Performance view in either Firefox or Chrome to analyze different metrics, for example:
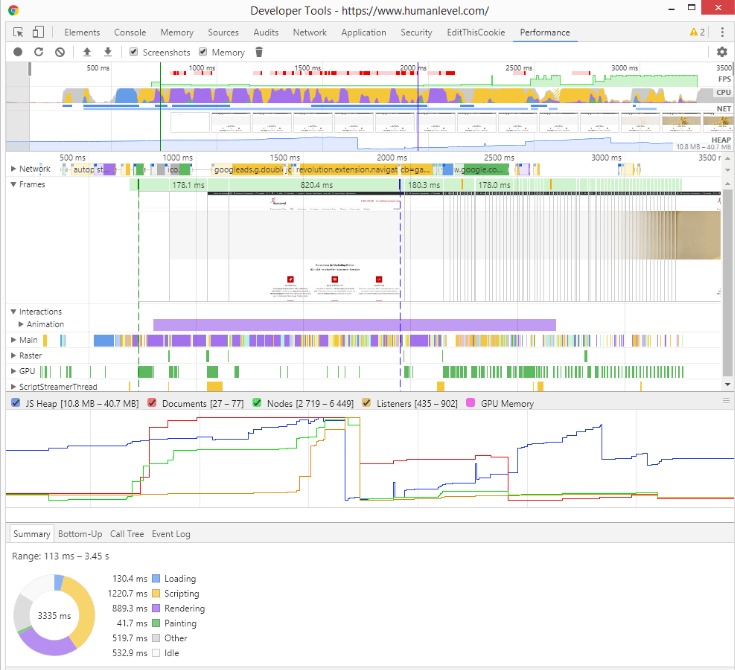
The performance analysis of devtools allows you to simulate CPU consumption, network, and other metrics while the page is being loaded, so you can identify and fix problems.
For a deeper look, it is advisable to use the JavaScript Navigation Timing API, which allows you to measure in detail what each part of your code takes from the programming itself.
For applications built on Node.js, the NodeSource Platform is also a great, low-impact way to explore application performance at a very granular level.
Comprehensive Node.js metrics help you identify the source of memory leaks or other performance issues and resolve these issues faster.
Final Notes
It’s important to maintain a balance between the readability of the code and its optimization. The code is interpreted by computers, but we need to make sure that can maintained in the future by ourselves or other people, so it needs to be understandable.
And remember: performance should always be taken into account, but should never be above the detecting errors and adding functionalities.
References
How to optimize your web page: JavaScript
14 Claves Para Optimizar Código JavaScript
30 tips to improve JavaScript Performance
Optimizing JavaScript Application Performance with Web Workers