How to solve your Node.js problems up to 4x faster
A bug on your Node.js application can mean many things:
- Something small that you can solve in a matter of minutes, and nothing serious happened.
- A medium-sized issue; like your application crashed, but it was back to normal in a few hours, even days, without a significant impact on your business.
- Or, your application crashed, but a few minutes or hours down (let alone days) means a massive impact to the business, be it monetary or customer satisfaction, or likely both. Financial services companies, eCommerce businesses, even different industries like travel, customer service, or medical care companies, can't take this risk.
In other words, a bug on your Node.js application can mean a lot of different things depending on the industry you are working in. Some industries can't afford 5 minutes down; others can afford weeks down. Even more important, the software - correctly working - can impact lives. As we move into a more interconnected world depending heavily on technology, even trusting our own lives with technology, a bug in your Node.js application can mean a plane or a spaceship crash, malfunction in government programs, or an explosion of some kind. As you can see in this post, there are some expensive software errors you probably want to avoid.
So keeping your Node.js application healthy should be one of your top priorities, whether you focus on selling cookies, manufacturing parts, or launching space rockets.
In this blog post, you will find the best way of solving your Node.js problems 400% faster and save time, money, frustration, and possibly lives.
Where to Start Solving Node.js Problems?
To solve a problem fast, you first have to find it. Sometimes the issues are "unknown unknowns," which are problems that you don't know what they are, and even worse, you don't know how to find them, or risks that come from situations that are so unexpected that they would not be considered.
In these situations, a regular engineer can take hours or days to identify the root problem and even more time to solve it. BUT if you use specialized tools like N|Solid, DataDog, Dynatrace, New Relic, Instana, and others, they can help identify where the problem is, helping you to solve it faster. So, having an APM (Application Performance Management) can dramatically improve the development process.
But it is important to notice that trying to solve these problems can come with a cost; most Monitoring tools come with a performance cost or overhead, traditional APMs have between 5% and 20% of performance overhead. They can help you find where the problem is, but they can also make your application slower. It's like when you have a transportation problem and buy a car. The car takes you from point A to point B but it takes twice as long as the train and costs more. Is it worth it? Additionally, the level of detail might not be enough to clearly identify the issue, since not all Node.js APM’s are created equal.
So the first step is to find which tool will help you best, find the problem quickly, and fix it.
Choosing the Right Tool
There are dozens of tools that can help you to find a Node.js problem. Here is a list of the most common and popular ones:
A. New Relic:
New Relic One is an observability platform built to help engineers create better software. From monoliths to serverless, it helps you instrument everything, analyze, troubleshoot, and optimize your entire software stack, all from one place.
It also provides different solutions, from cloud adoption to Digital Customer Experience in various industries: E-commerce, media, and the Public Sector, to name a few.
This is how New Relic insights look like:
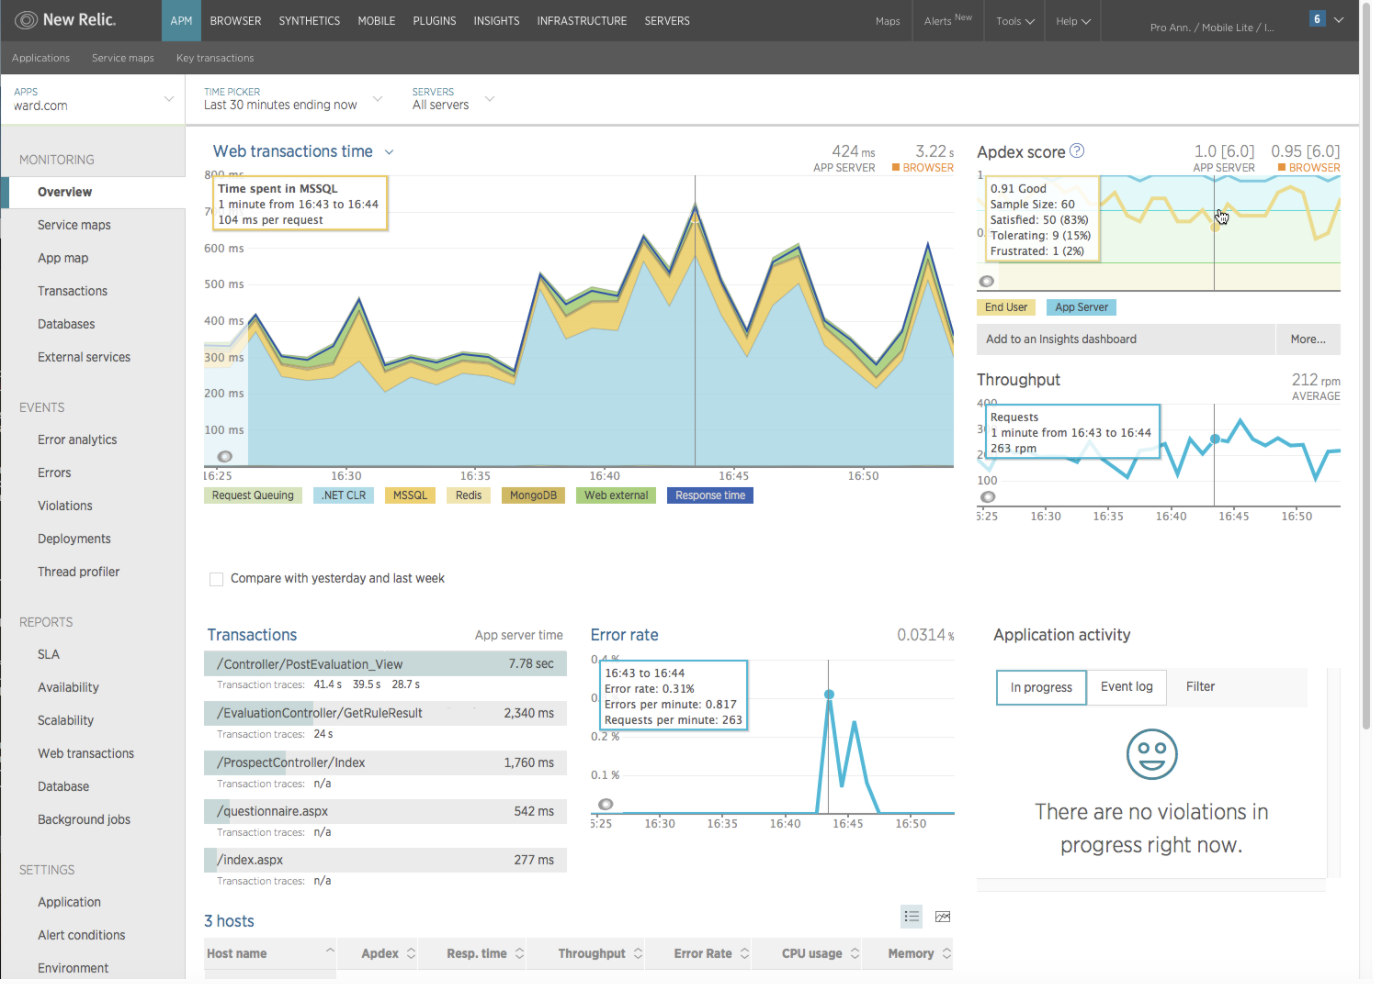
You can see web transactions time, the application activity, error rate, host, and others.
B. Datadog:
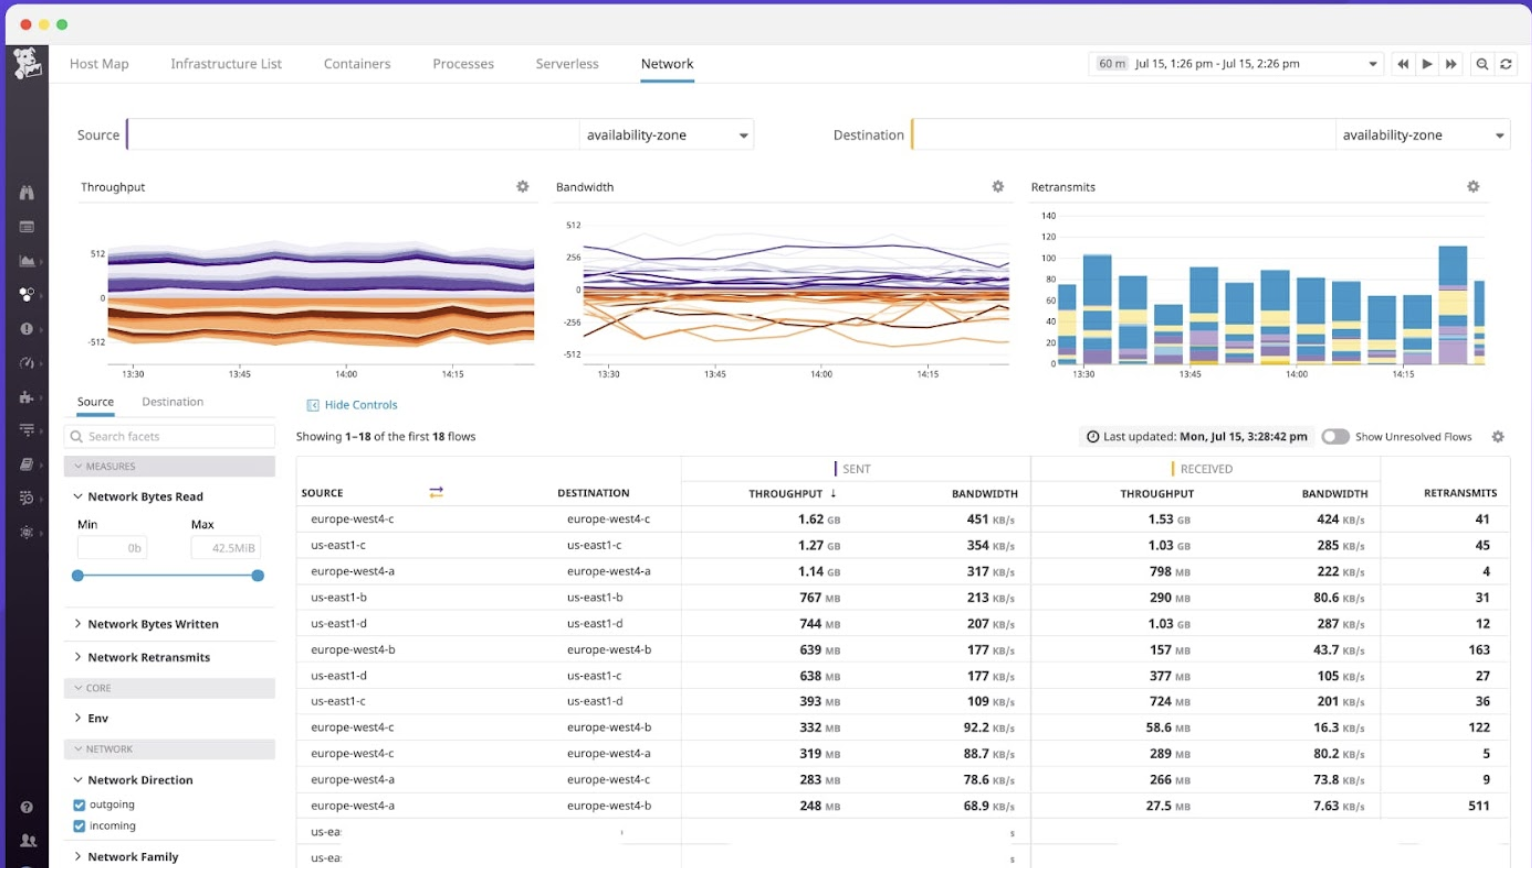
Datadog is a monitoring service for cloud-scale applications, providing monitoring of servers, databases, tools, and services through a SaaS-based data analytics platform.
- With Datadog, you can check request, latency, latency distribution, errors, percentage of time spent, and other metrics of your Node.js application, as we can see here.
C. Instana:
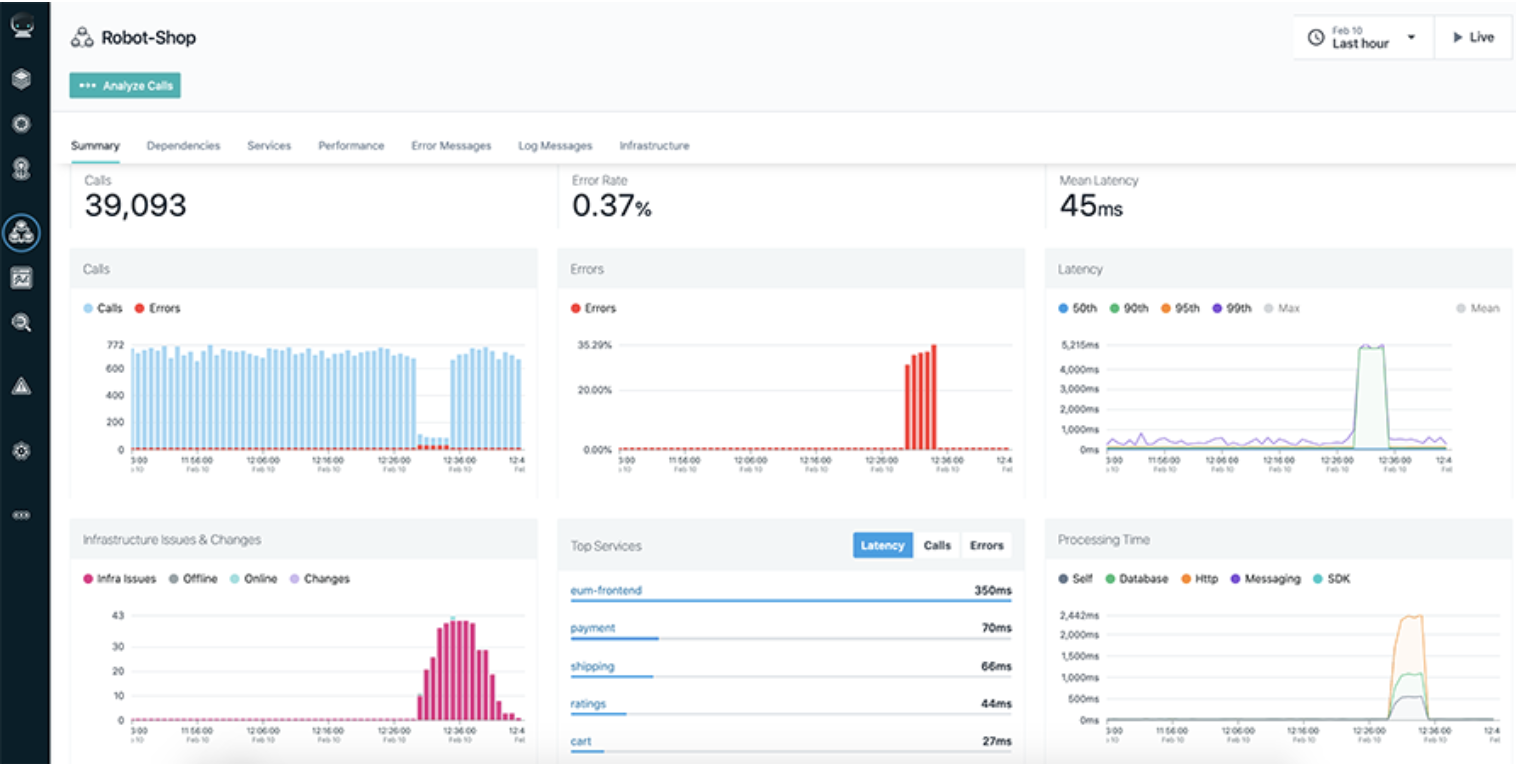
Instana is an application performance monitoring - APM - for microservices. It lets you manage the performance of your applications in real-time and see every detail about the inner workings and inter-dependencies of your application services. With it you can:
- Trace every distributed request.
- Map all service dependencies.
- Profile every production process.
You can see some metrics like calls, error rate, mean latency, top services, processing time, and others, here:
D. Dynatrace:
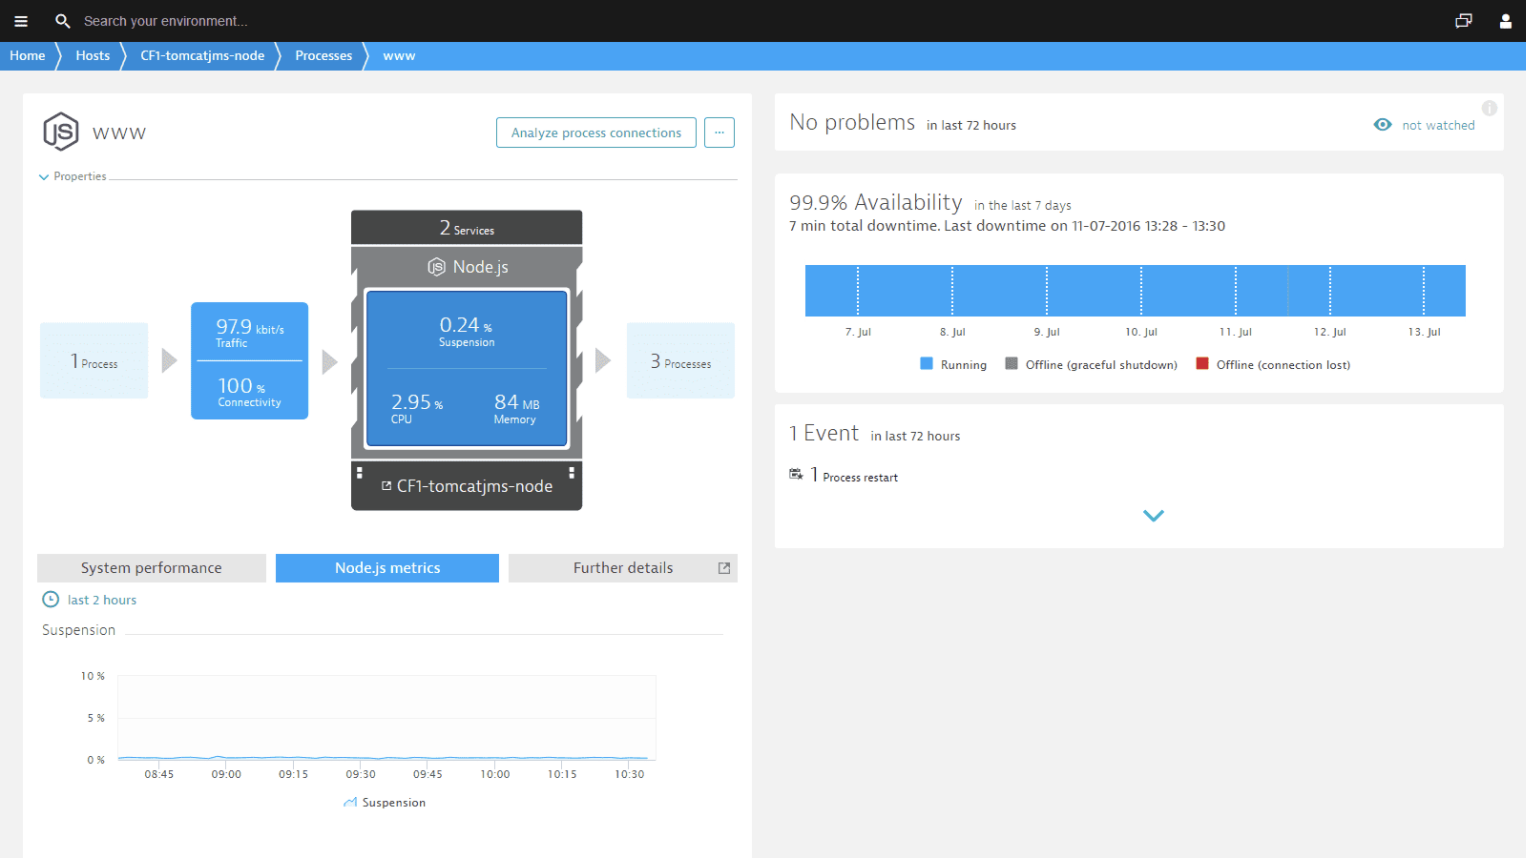
Dynatrace produces a software intelligence platform based on artificial intelligence to monitor and optimize application performance and development, IT infrastructure, and user experience.
- Node.js monitoring can tell you the number of processes, CPU and memory usage, the percentage of connectivity and availability, traffic, the most time-consuming requests, and other Node.js metrics.
But there is a problem with all these solutions
APM works through "Agents," which are intermediaries between your application and the Node.js runtime.
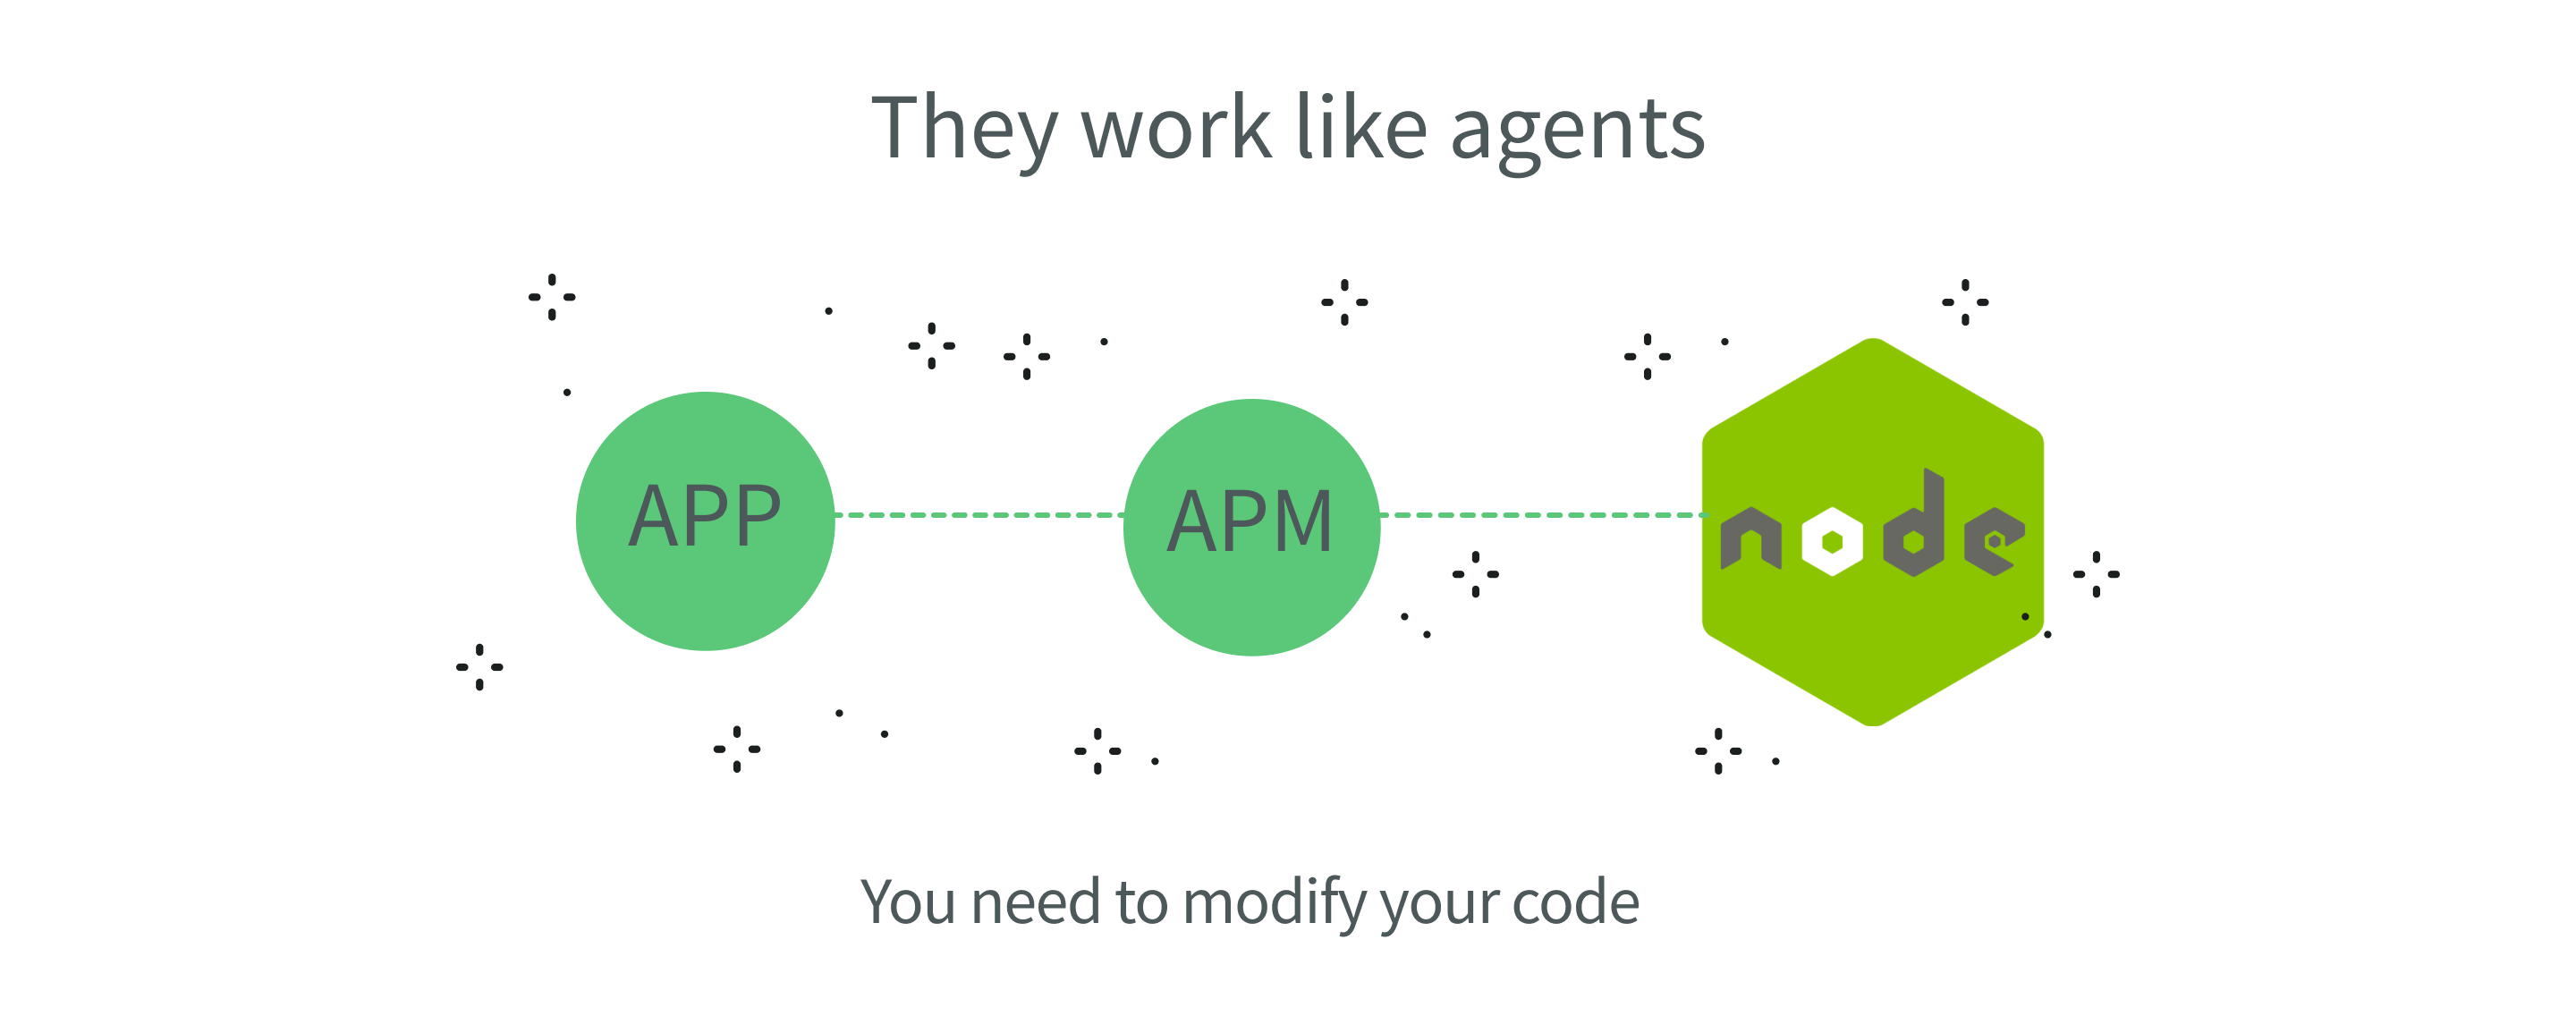
The APM is injected into your code, and it encapsulates your application so they can extract the information, which has a high cost, also known as overhead. Sometimes the APM itself is the one that creates the performance problem, and you can see APM code and overhead in the metrics provided.
Another problem is that sometimes you have to modify your code to implement the APM, also known as code instrumentation, which creates extra work and a layer of complexity oftentimes quite difficult to deal with. Also, accuracy is questionable.
But they can be handy tools that provide you with additional insight and extensive data and insight.
Now, let's see one tool that doesn't have this problem because it's an enterprise runtime for Node.js, and it adds minimum overhead, and you don't have to modify your code at all.
Is There a Better Tool?
N|Solid
N|Solid is a drop-in alternative to the Node.js runtime, enhanced to deliver low-impact performance insights and greater security for mission-critical Node.js applications. It has faster time resolution, more robust infrastructure, hardened security, and zero code instrumentation, which means that you don't have to change your code to implement it.
-
Tradicional APM tools sit on top of the Node.js runtime layer; performance overhead may vary from one application to the next, depending on the architecture and stack used. Some tools sacrifice more detailed stack trace information to minimize overhead, and none are explicitly built with Node.js in mind. N|Solid was constructed expressly for Node.js. It's Node.js runtime itself, not an agent.
-
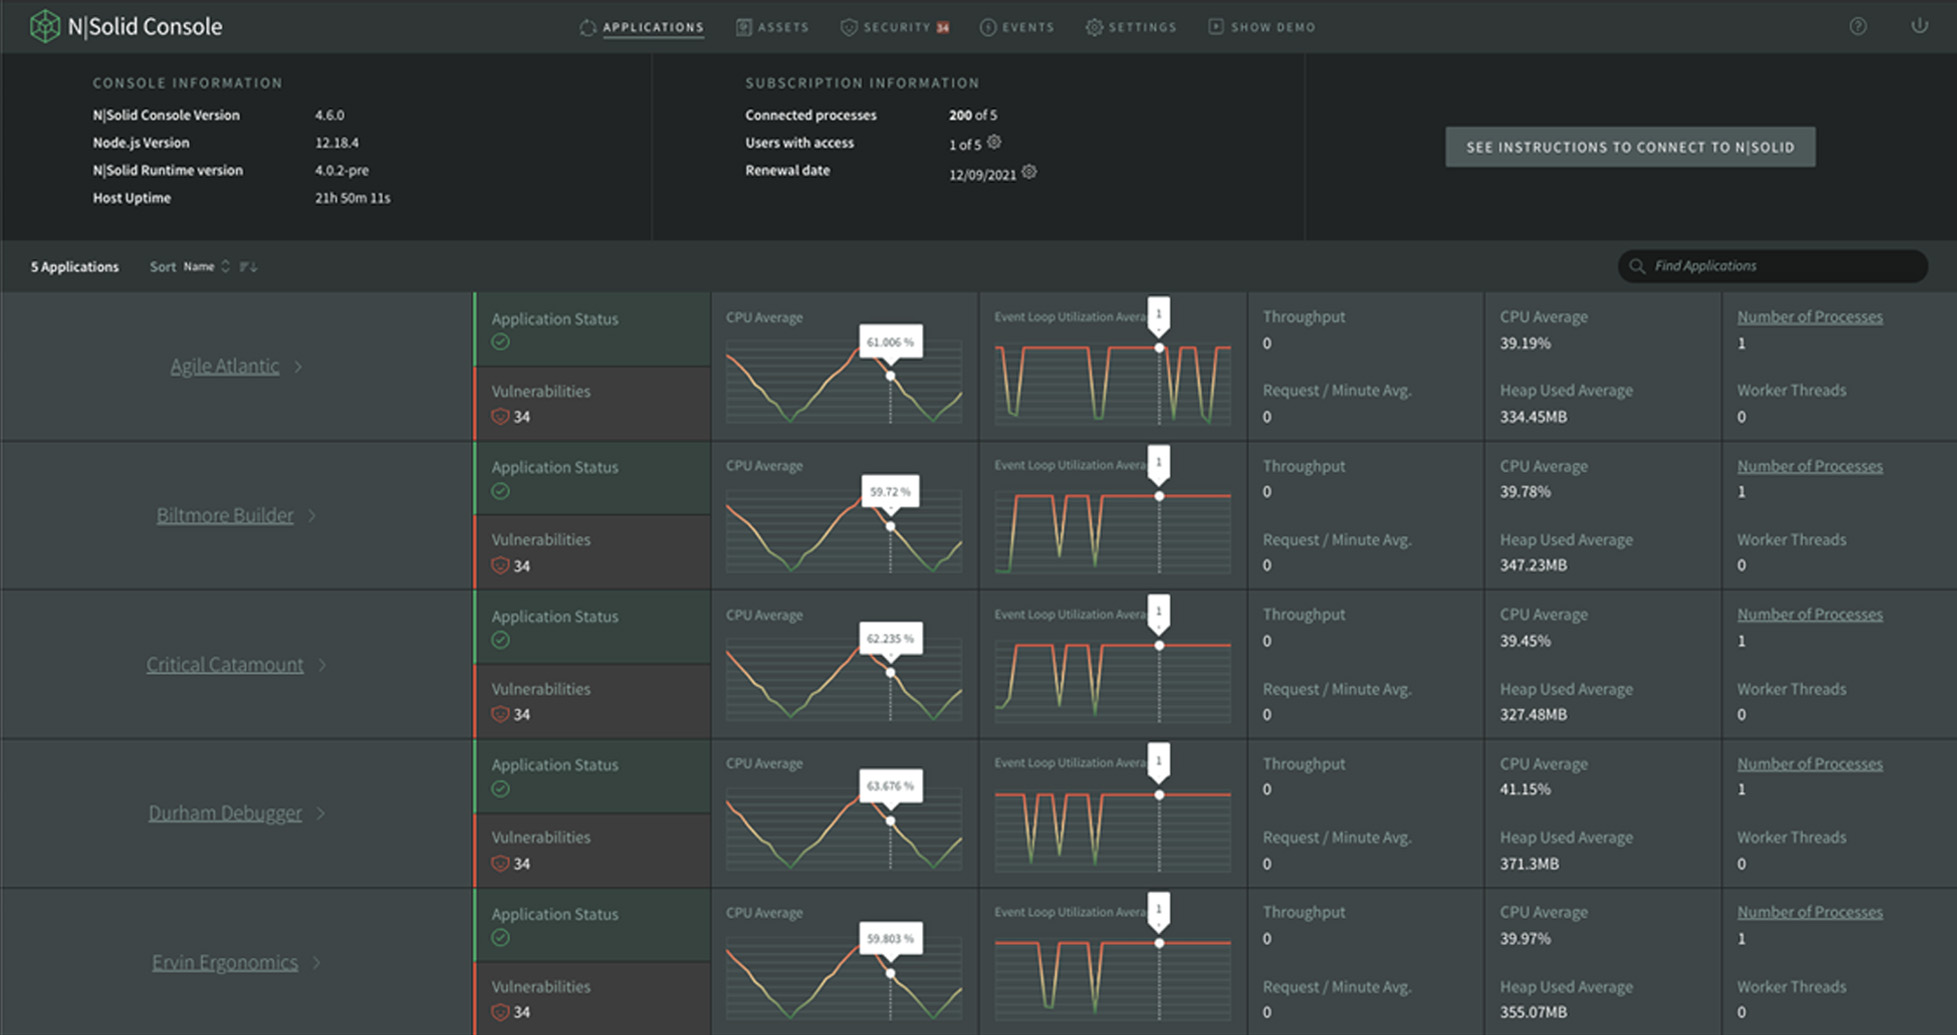
This console overview provides valuable insight into clusters of N|Solid processes running in various configurations.

- You can see the number of applications, processes, vulnerabilities, hosts, and even the number of worker threads.
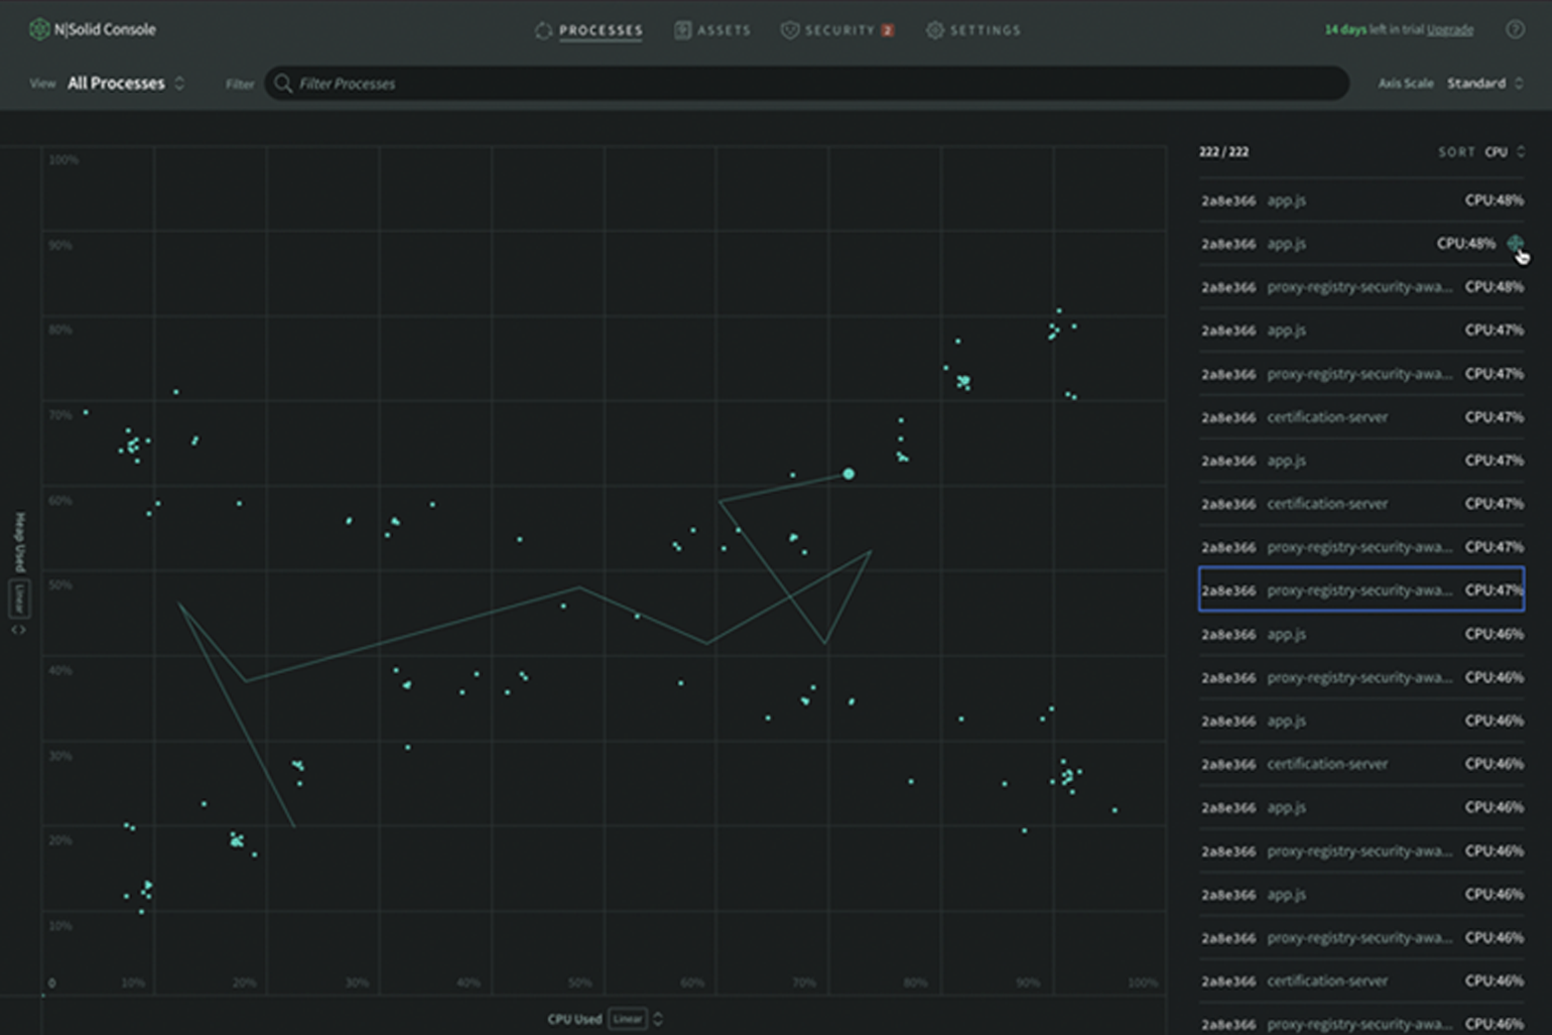
- And a cluster view where you can see each process, heap used, CPU %, Garbage Collector count, and others.
It's important to clarify that the previous tools presented contain libraries that help expose data, but their primary function is a monitor. For example, you can't export data using the New Relic API and consume it via AWS.
Here is where N|Solid has an advantage. Any monitoring solution can consume the additional metrics NSolid provides and without any additional overhead. It's the best of both worlds. The best of all worlds!
Benchmarking of Node.js Monitoring Tools
Now that we know some tools, let's look at the data. We learned that having a Node.js APM is generally better than not having one since you can use it to find issues faster. But, from all the APMs, which one is the fastest, with greater security, faster load and startup times, and lower overhead? Let's check it out!
Graph #1 Reqs/sec
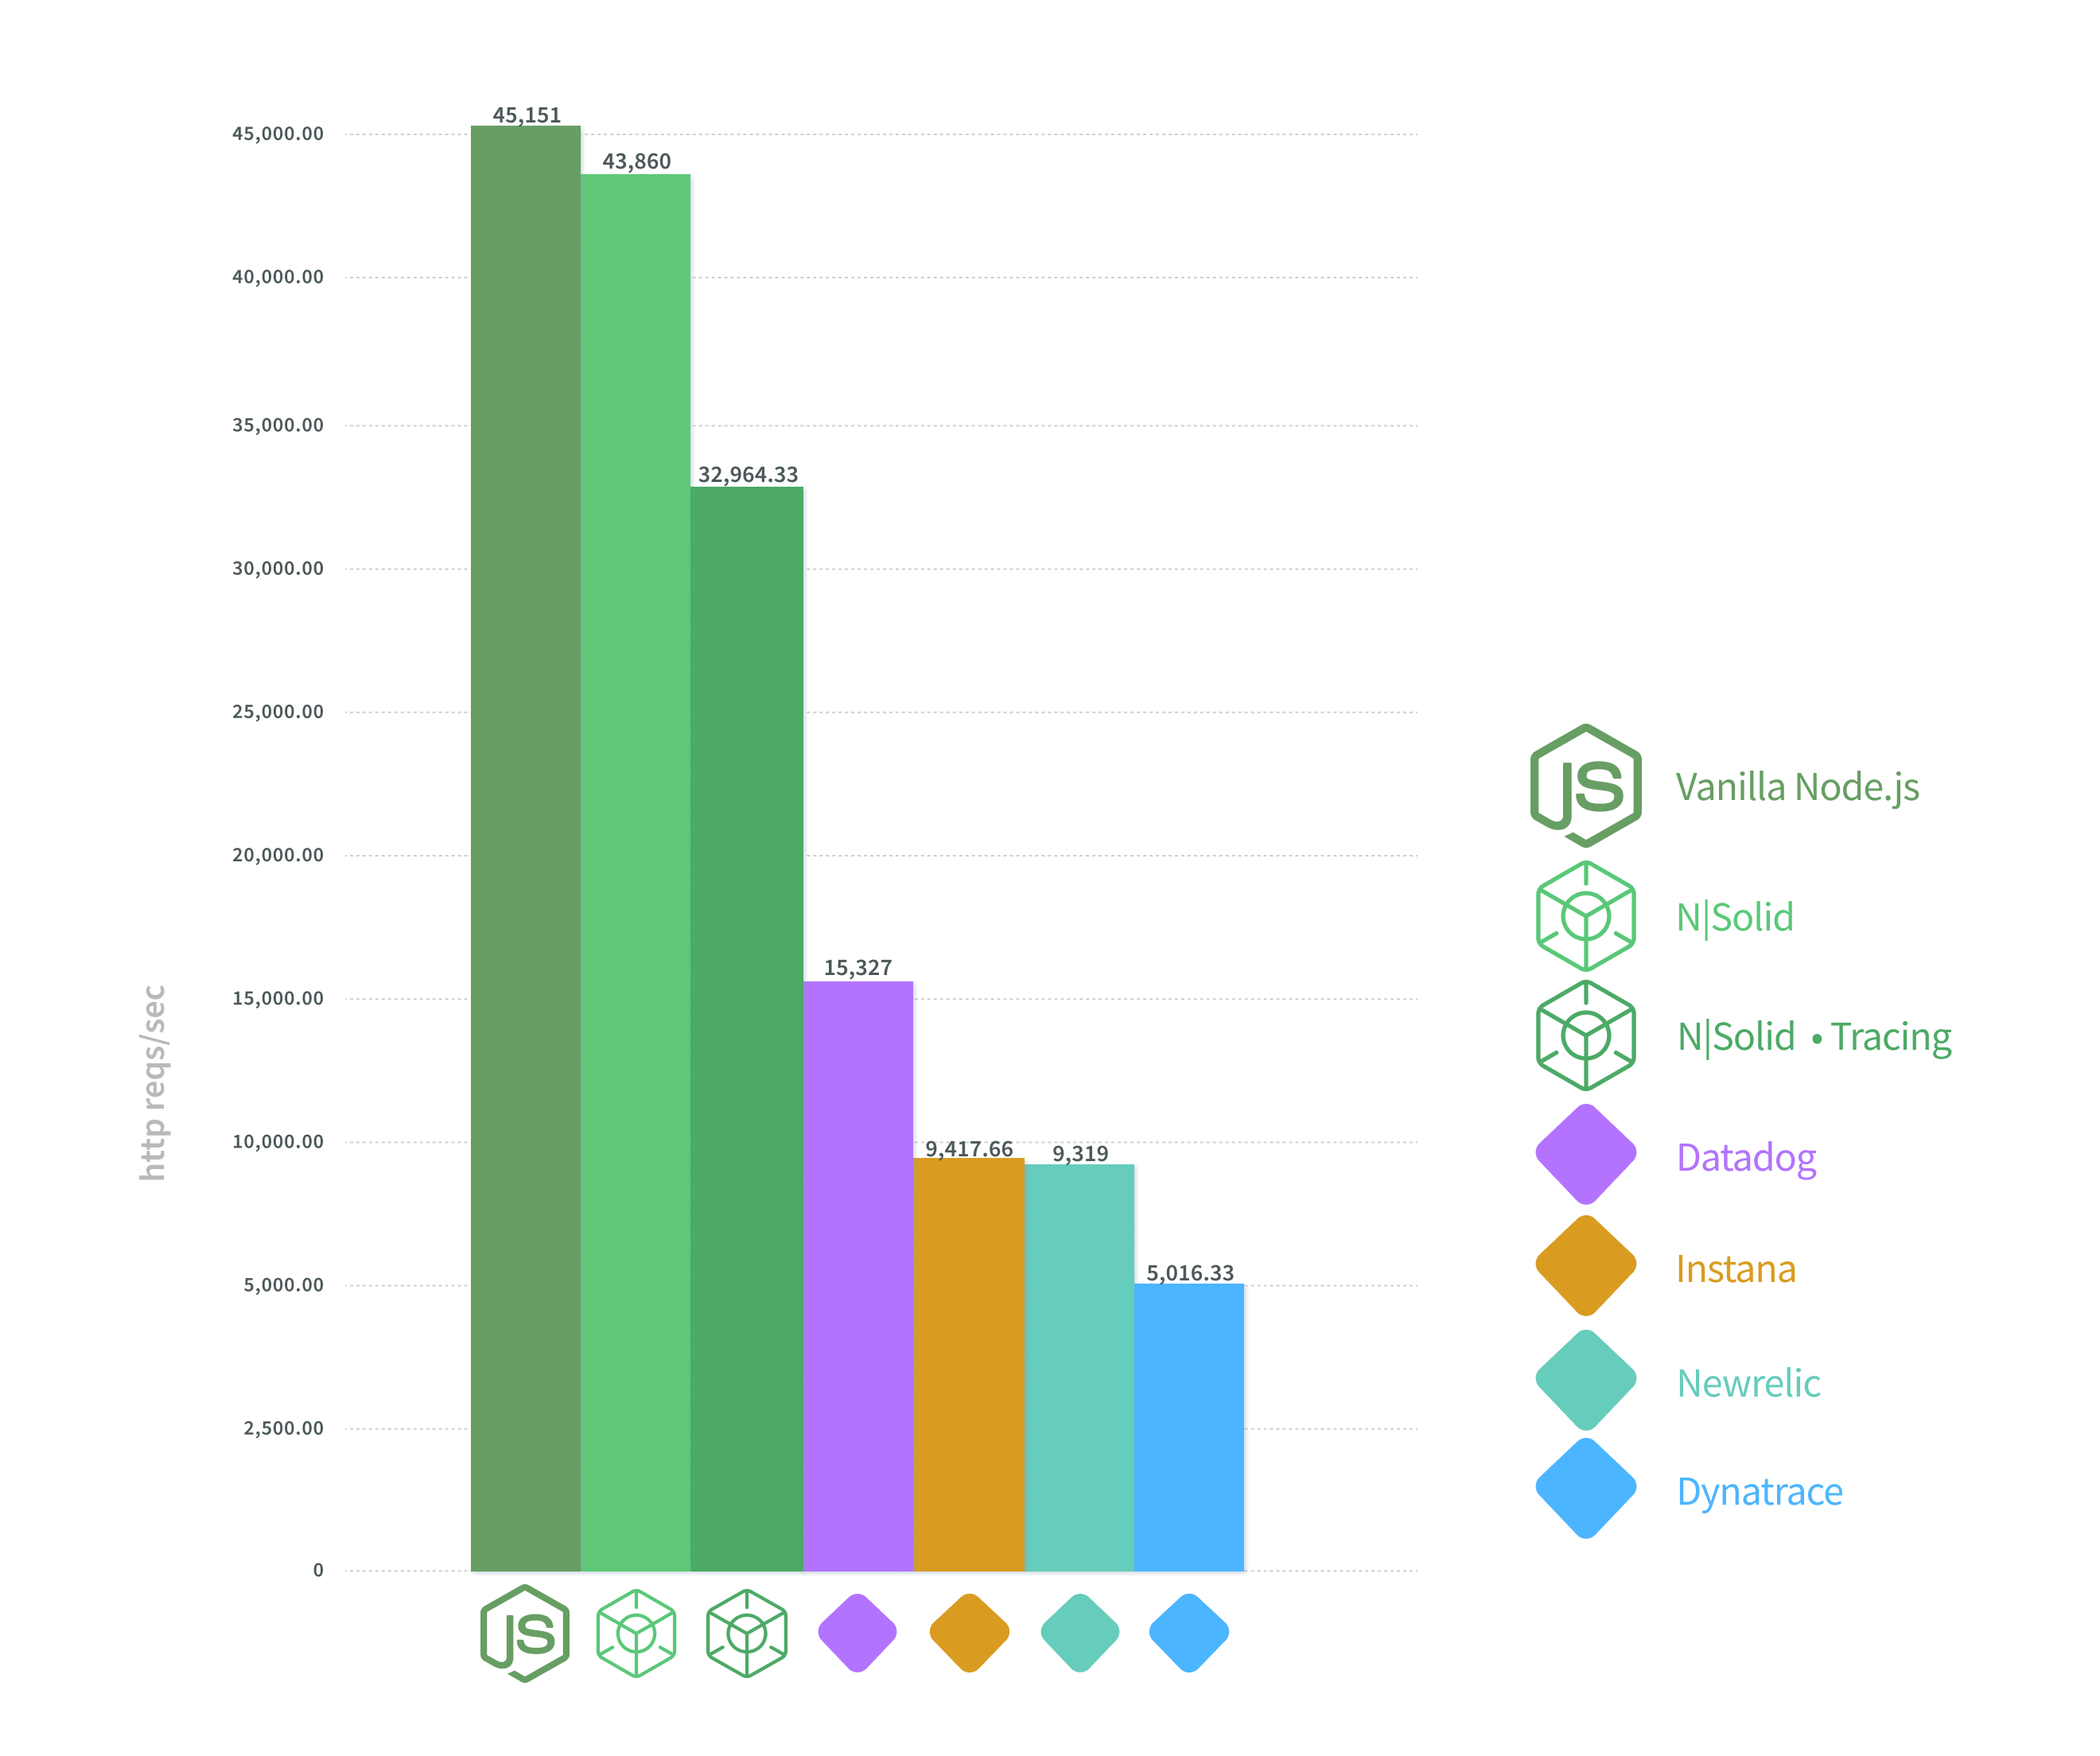
We can compare the performance of these APMs by looking at different metrics. As we can see on Graph #1, the maximum number of requests per second that a Node.js HTTP server can serve, we obtain the following results: As expected, Vanilla Node.js is the fastest, followed by N|Solid with a slight difference of less than 3% serving over 43K reqs/sec. In third position also stands N|Solid with automatic HTTP and DNS tracing enabled around a solid 30K reqs/sec, which positions it well on top of the rest. Datadog comes fourth with 15K, Instana with something around 10K, followed closely by Newrelic, and finally Dynatrace with around 5K reqs / sec.
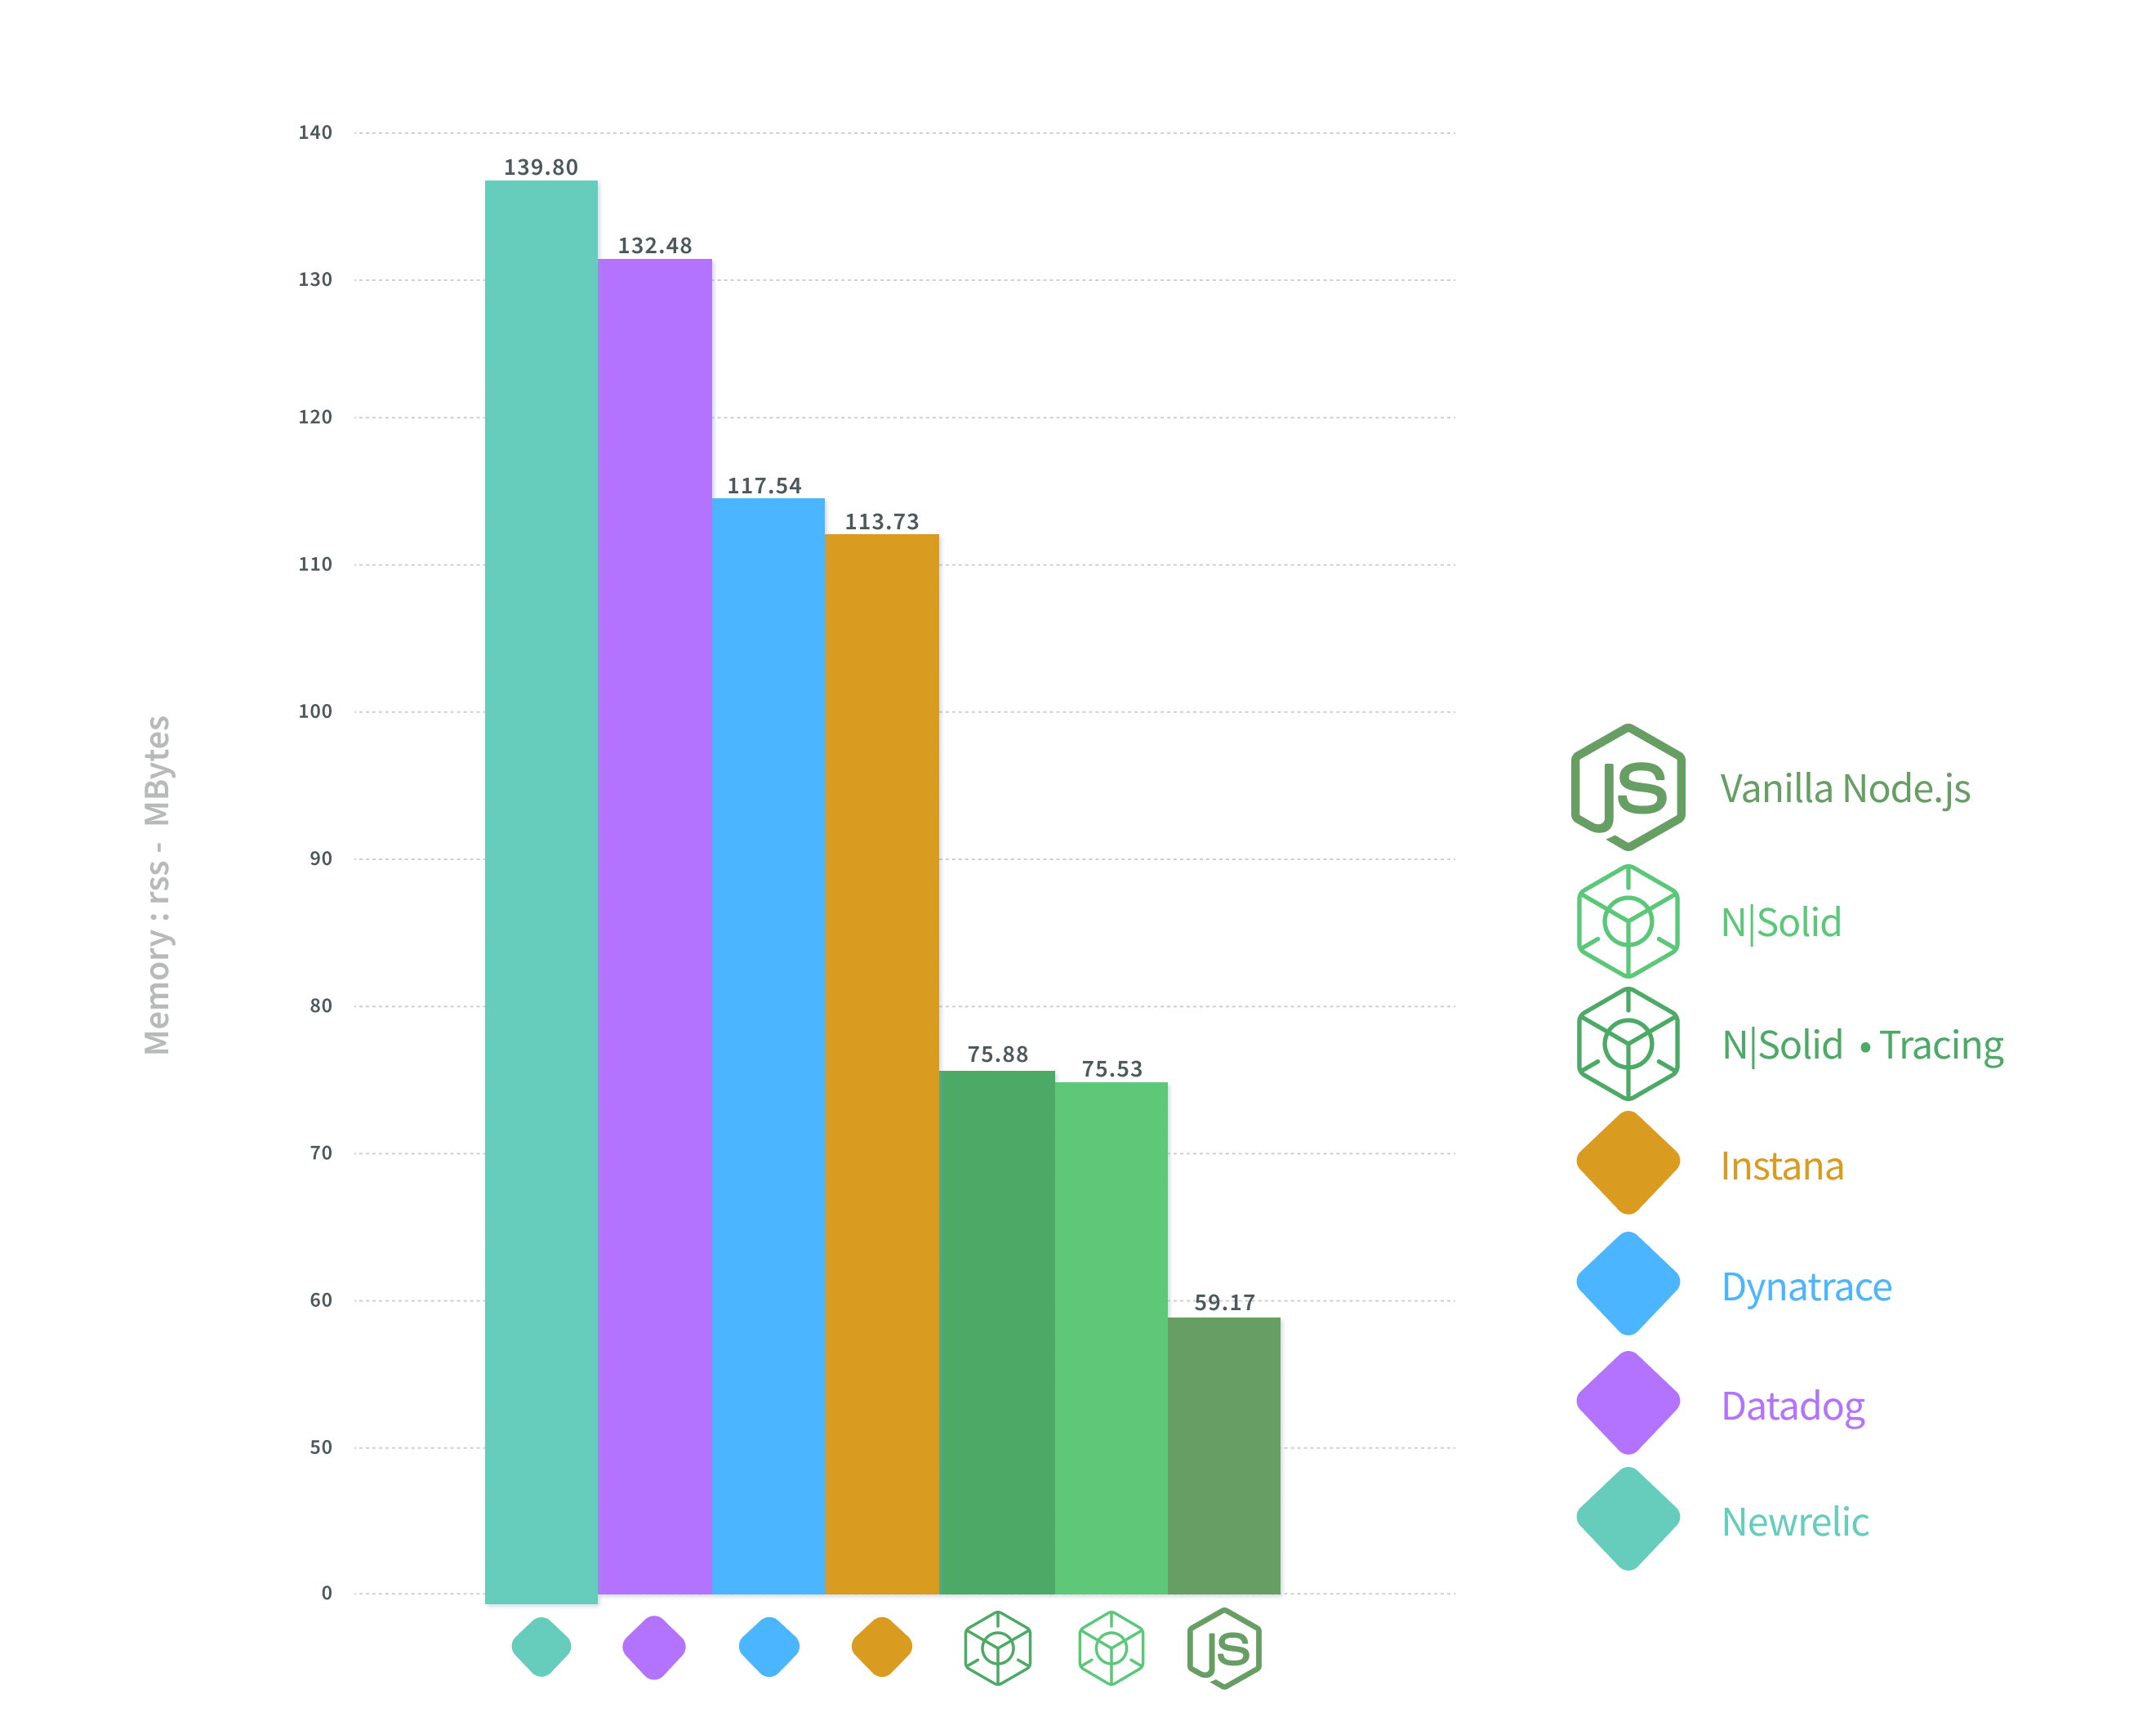
Graph #2 RSS Memory in MB
If we check the memory consumed by the Node.js process using different APMs (Graph #2) we can also notice that N|Solid is the closest to Vanilla Node.js: 75.35 MB in N|Solid vs. 59.17 MB in Vanilla Node.
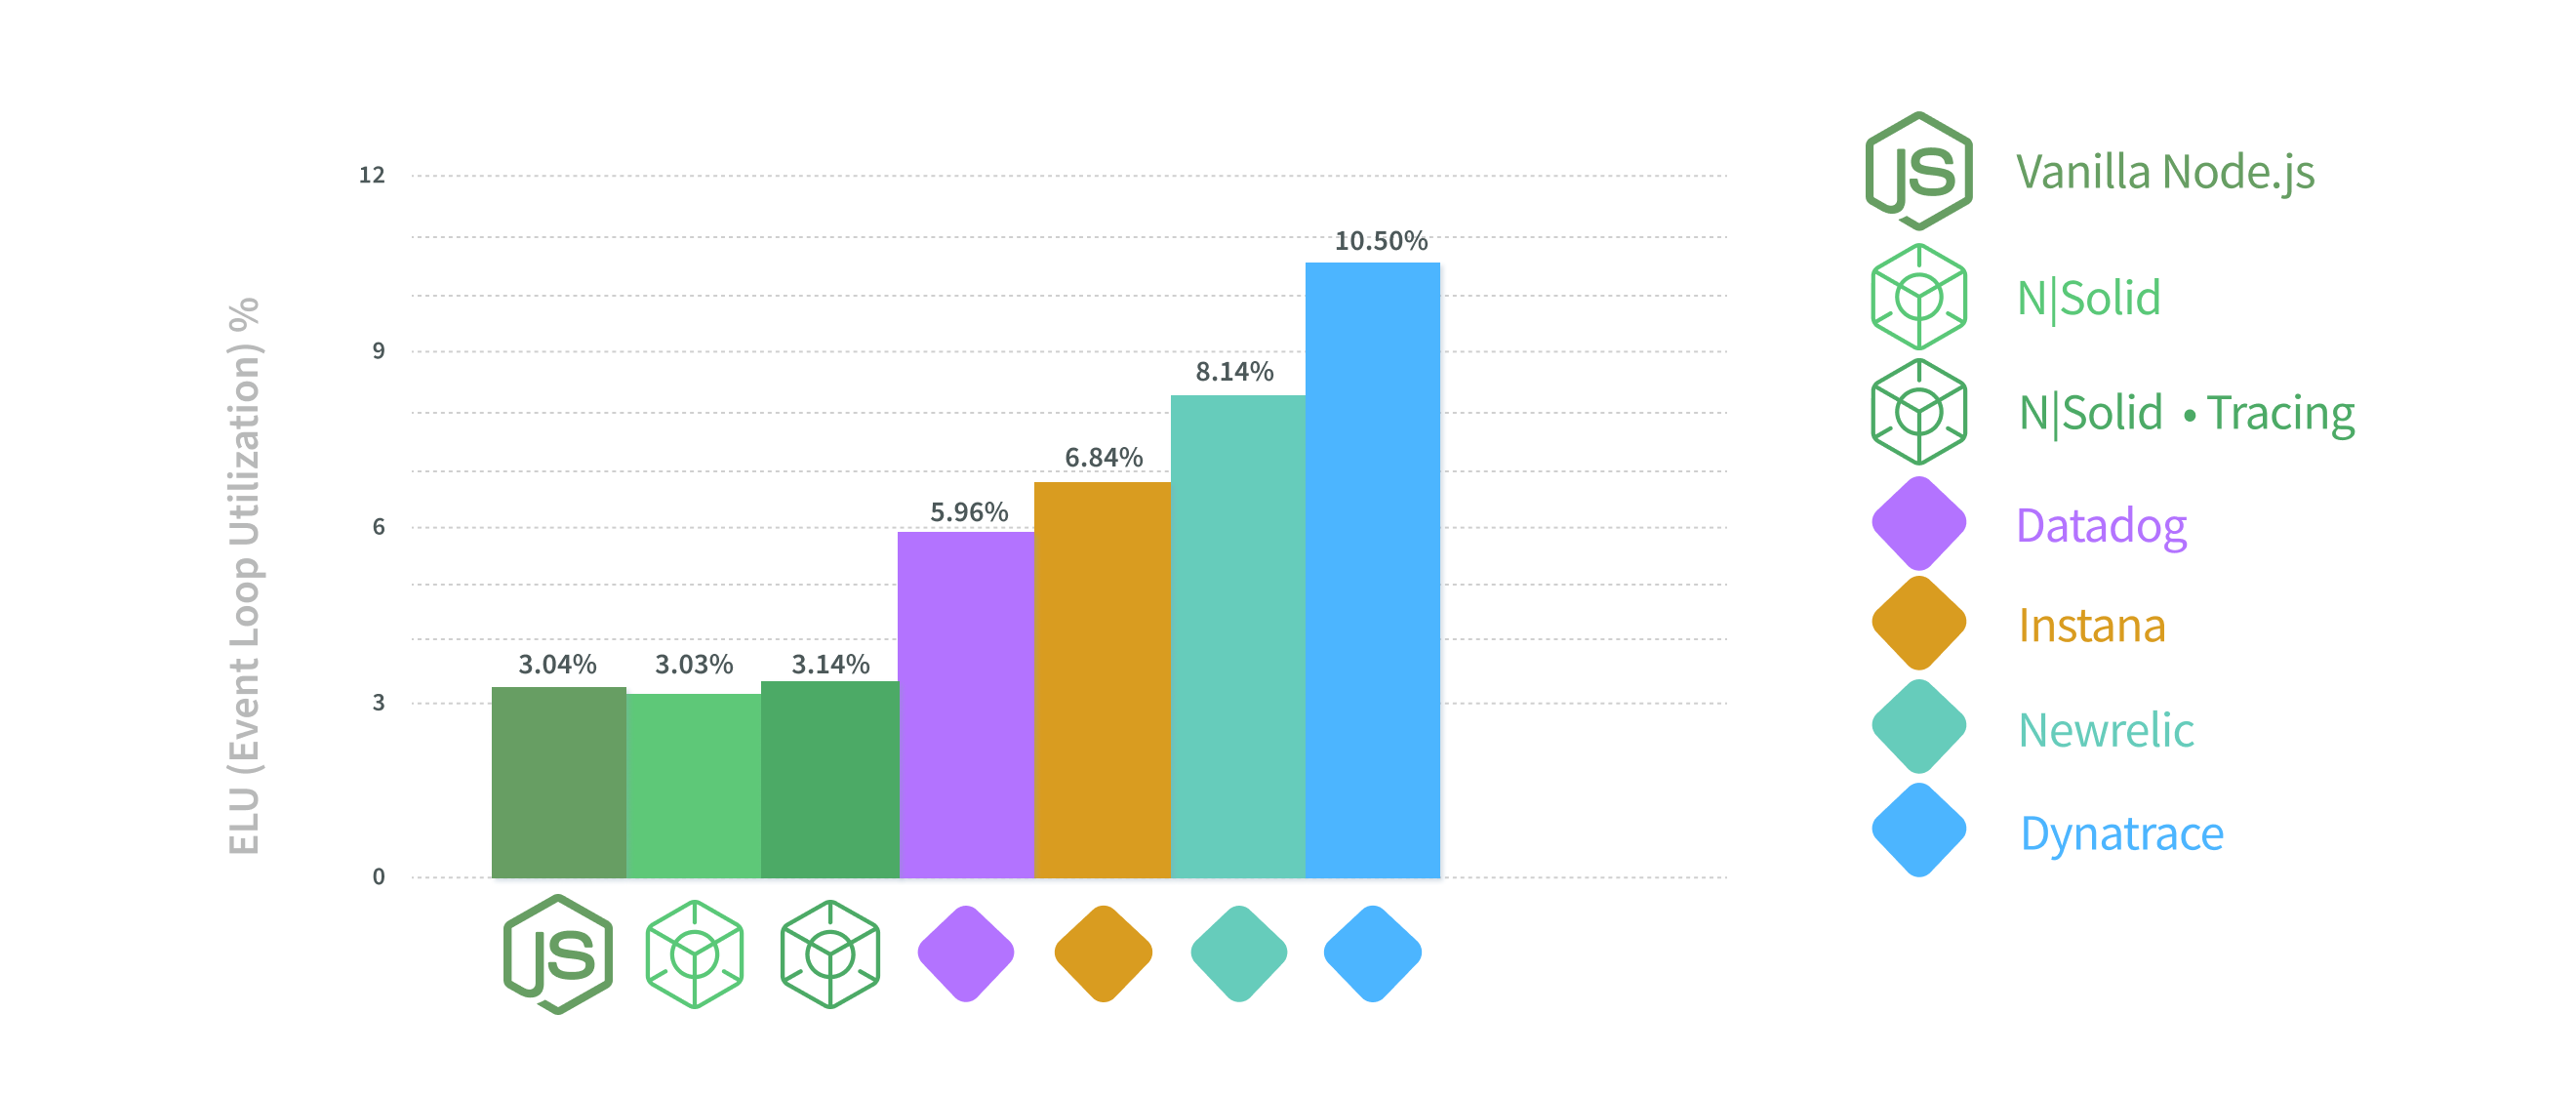
Finally, in terms of process consumption, if we look to the Event Loop Utilization (ELU) metric, N|Solid also performs much better than the rest. N|Solid numbers are pretty much on par with Vanilla Node.js even with tracing activated ~3%. As for the other APMs, the next one is Datadog with 5.16% in the ELU (Event Loop Utilization) percentage.
Graph #3 ELU % (Event Loop Utilization)
In conclusion, having an APM for Node.js can positively impact your development process and production environment. The best Node.js APM in the market is N|Solid backed by data, and supported by a great engineering team.
Our responsibility with the ecosystem also invites us to carry out a reasonable exercise where we adopt the best practices and build the best possible product out in the market. We also analyze the main metrics that have become the industry standard concerning the leading competitors to avoid losing perspective with N|Solid.
APM's Performance Dashboard
We are proud to introduce —APM's Performance Dashboard— An Open Source project created in NodeSource, but released for use by the Node.js Community.
In this tool, you will be able to visualize the real performance cost of using a solution like an APM to monitor Node.JS.
In this tool you will be able to select and compare the main performance monitoring tools in the market in an open way. We don't want the —APM's Performance Dashboard— to be manipulated by any specific company; for this reason, we release it to the community so that together we can continuously improve it.
Check out our new release to the community:
- Use the tool here: APM's Performance Dashboard
- Contribute here: Github Repo APMs benchmark
Try N|Solid now!
If you have any questions, please feel free to contact us at info@nodesource.com or in this form.
To get the best out of Node.js, start a free trial of N|Solid, an augmented version of the Node.js runtime, enhanced to deliver low-impact performance insights and greater security for mission-critical Node.js applications. #KnowyourNode