Announcing N|Solid 3.0
Today, we’re excited to announce that N|Solid 3.0, the latest major release of N|Solid, is generally available!
What’s new in N|Solid 3.0?
Single-view monitoring at scale: The completely redesigned cluster view can efficiently render thousands of processes. Teams managing large-scale Node.js deployments hence get a single unified view across all processes using a single N|Solid console. The new Selection Box feature (figure 1) enables users to easily focus on a subset of processes for further analysis.
Figure 1: New cluster View with Selection Box
Customizable views and process tracing: Both axes in the new cluster view are fully configurable (figure 2a), allowing users to pick any two metrics from a wide selection of N|Solid metrics, and correlate them in the same view. This custom view can then be saved for easy access. Process tracing (figure 2b) enables users to observe the behavior of specific processes over time.
Figure 2a: Configurable axes
Figure 2b: Process tracing
Enhanced thresholds and alerts: Thresholds can now be set on any N|Solid metric that is numeric, along with corresponding alerts. Thresholds are now more granular and can be set at Application level (figure 3a), filter-based (figure 3b), or even for a single process. This enables coarse-grained as well as fine-grained performance monitoring and notification.
Figure 3a: Application-level (global) threshold and alert
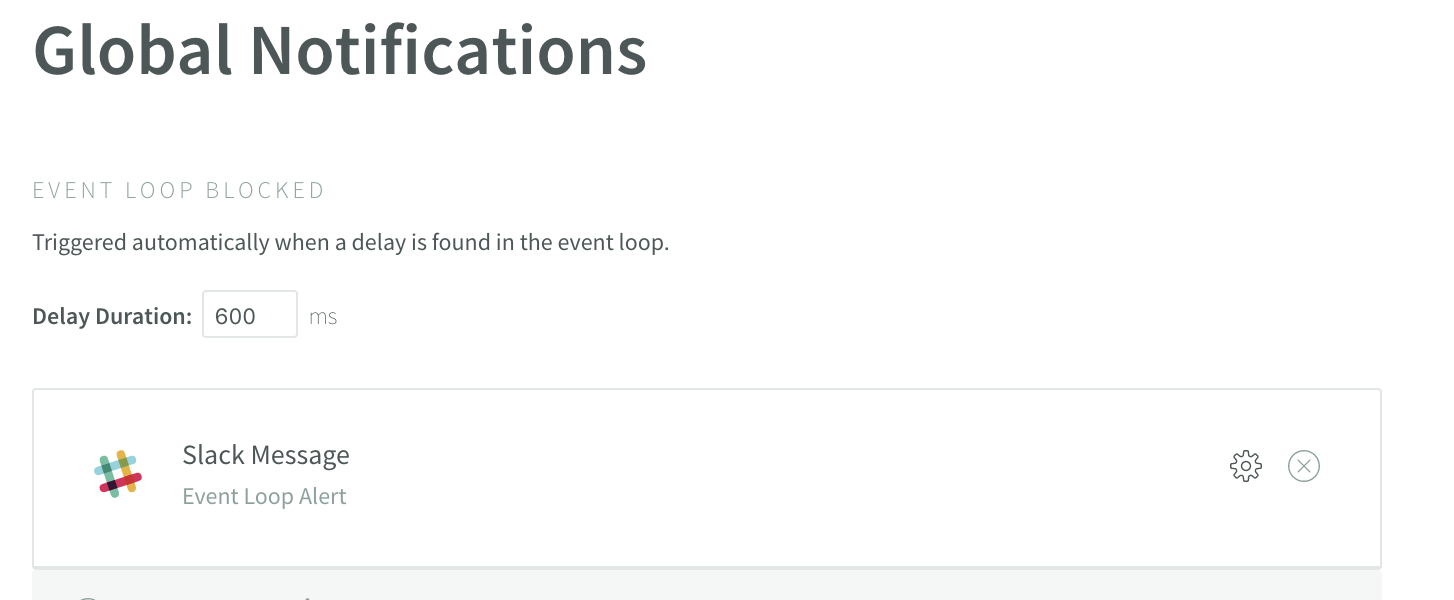
Figure 3b: Filter-based threshold and alert
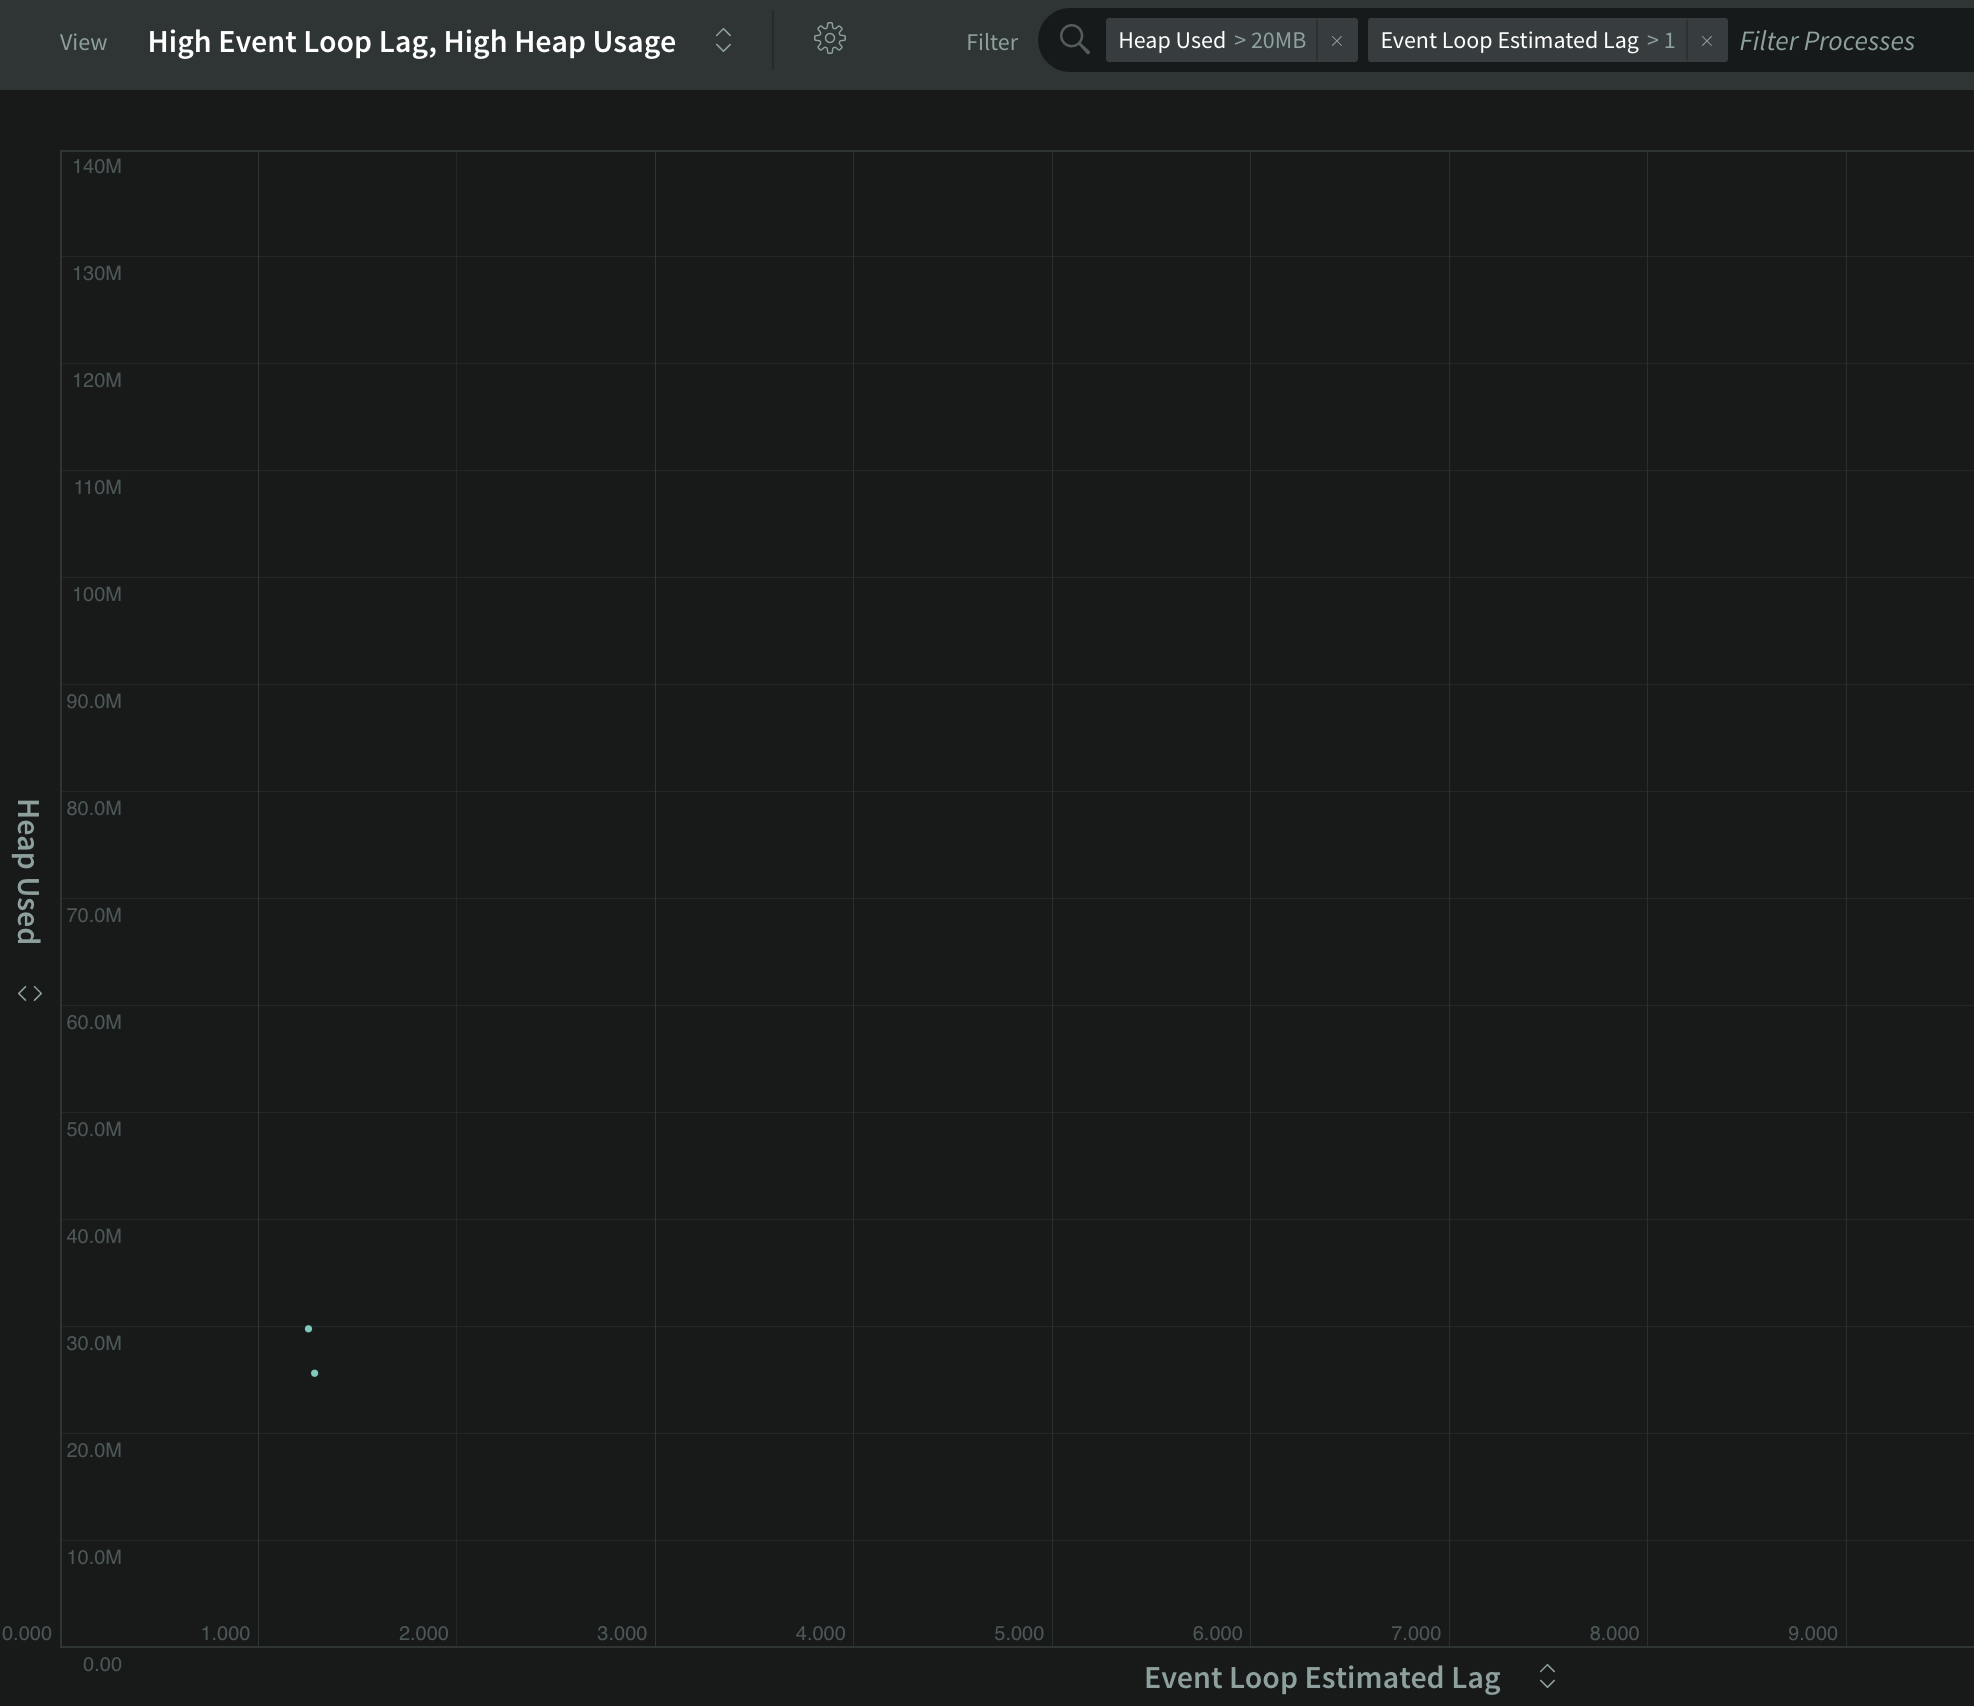
Improved filtering: In addition to filtering by tag, process name, and hostname, filters can now be defined based on any of the N|Solid metrics (figure 4), enabling faster trouble-shooting for users.
Figure 4: Custom filter based on Event Loop Lag and % Heap Used
Flexible process detail view: The process detail view is now configurable so users can pick and choose the metrics they want to analyze (Figure 5). Metrics can be viewed in raw mode, or as one-minute or one-hour aggregates,
Figure 5: Configuring Process Detail View graphs via drop-down menu
Richer security reporting: Dependency chains are shown for every module that has one or more known vulnerabilities, enabling users to locate all the dependent modules in their application that are impacted by a particular vulnerability (figure 6). Users can use dependency chains as data-points for impact analysis and improved oversight.
Figure 6: Dependency chain for a package with a known vulnerability
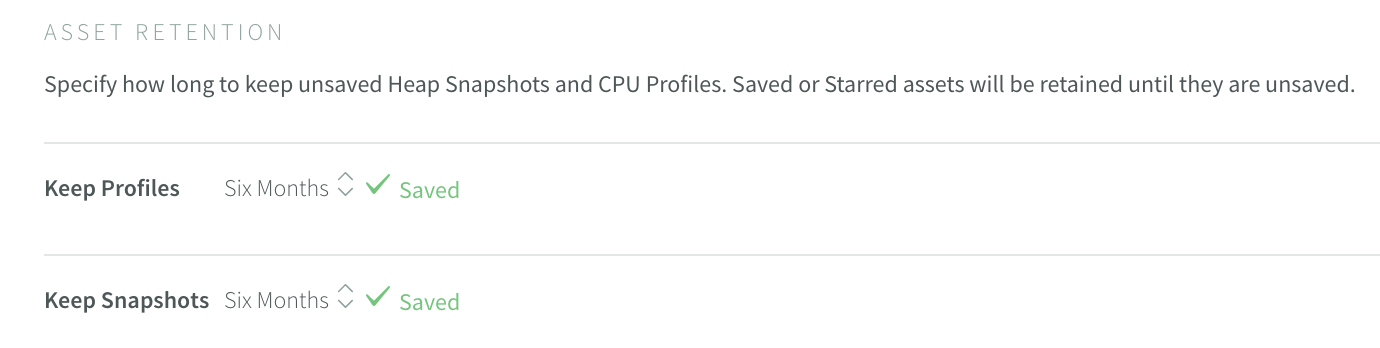
Better asset management: All assets can now be downloaded, manually deleted, sorted and marked as favorites (figure 7a). Old assets will automatically be purged based on user defined asset retention policies (figure 7b).
Figure 7a: Asset (CPU profile) sorted by date
Figure 7b: Configurable Asset Retention Policy
New to N|Solid?
If you’ve never tried N|Solid, this is a great time to do so. N|Solid is a fully compatible Node.js runtime that has been enhanced to address the needs of the Enterprise. N|Solid provides meaningful insights into the runtime process and the underlying systems.
As always, we’re happy to hear your thoughts - feel free to get in touch with our team or reach out to us on Twitter at @nodesource.