Serverless Observability in N|Solid for AWS Lambda
We are excited to release Serverless Observability for N|Solid with support for AWS Lambda. With the growth of organizations leveraging serverless increasing as they realize the performance and cost benefits, we're excited to provide customers with this new visibility into the health and performance of their Node.js apps utilizing Serverless Functions utilizing serverless architectures.
 Img 1. Serverless Cloud Providers
Observability has become a critical part of software development; understanding performance issues and why they occur is incredibly valuable. Leveraging Serverless introduces challenges for observability based on how the technology works due to added complexity and challenges in data collection and analysis. Some key observability issues include:
-
Cold starts: When a serverless function is first invoked, it takes time for the underlying infrastructure to spin up. This can lead to latency issues, especially for applications that require a high degree of responsiveness. In other words, Lambda must initialize a new container to execute the code, and that initialization takes time.
-
Debugging: Debugging serverless applications can be challenging due to the event-driven nature of the platform. This is because it can be difficult to track the flow of execution through an application comprising multiple functions invoked in response to events.
-
Visibility: Serverless providers typically provide limited visibility into the underlying infrastructure. This can make it difficult to troubleshoot performance issues and identify security vulnerabilities.
N|Solid now makes it easy to implement distributed tracing based on OpenTelemetry, providing better insights into these microservices-based systems.
What is Serverless?
Serverless computing is a cloud computing model that allows developers to run code without provisioning or managing servers. Instead, developers pay for the resources they use, such as the time their code runs and the amount of data it stores.
Some key benefits of Serverless Computing include:
- Accelerated app development,
- Reduced costs and improved scalability,
- Increased agility
Serverless computing has become increasingly popular in recent years, offering several advantages over traditional server-based architectures. However, serverless computing can also be complex, and observability, monitoring, and debugging can be particularly challenging.
Key concepts to understand the importance of extending observability to serverless architectures:
-
Observability: The ability to understand the state of a system by collecting and analyzing telemetry data. This data can include logs, metrics, and traces. Traces are a particularly important type of telemetry data, as they can be used to track the flow of requests through a system.
-
OpenTelemetry: An open-source observability framework that can collect and analyze telemetry data from various sources. It includes support for Distributed Tracing, which can be used to track the flow of requests through a serverless environment.
At NodeSource, we have been at the forefront of supporting developers to solve these challenges in their Node.js applications, so we have extended this series of features and content since last year:
- Distributed Tracing Support in N|Solid - https://nsrc.io/DistributedTracingNS
- Enhance Observability with Opentelemetry Tracing - Part 1 - https://nsrc.io/NodeJS_OTel1
- Instrument your Node.js Applications with Open Source Tools - Part 2 - https://nsrc.io/NodeJS_OTel2
- AIOps Observability: Going Beyond Traditional APM - https://nsrc.io/AIOpsNSolid
In a serverless environment, applications are typically composed of several different services, each responsible for a specific task. This can make it difficult to track the flow of requests through the system and identify performance problems, but not with N|Solid:
With this release, you can now have traces of when a microservices system calls a serverless function.
Now, with N|Solid, you can:
- Track the flow of requests across your microservices architecture, from the Frontend to the Backend.
- Identify performance bottlenecks and errors.
- Correlate traces across multiple services.
- Visualize your traces in a timeline graph.
N|Solid is a lightweight and performance-oriented tracing solution that can be used with any Node.js application. It is easy to install and configure, and it does not require any changes to your code.
Introducing Serverless Support for AWS Lambda
NodeSource has introduced a new observability feature to gather information throughout a request in a serverless environment. The collected information can be used for debugging latency issues, service monitoring, and more. This is valuable for users interested in debugging request latency in a serverless environment.
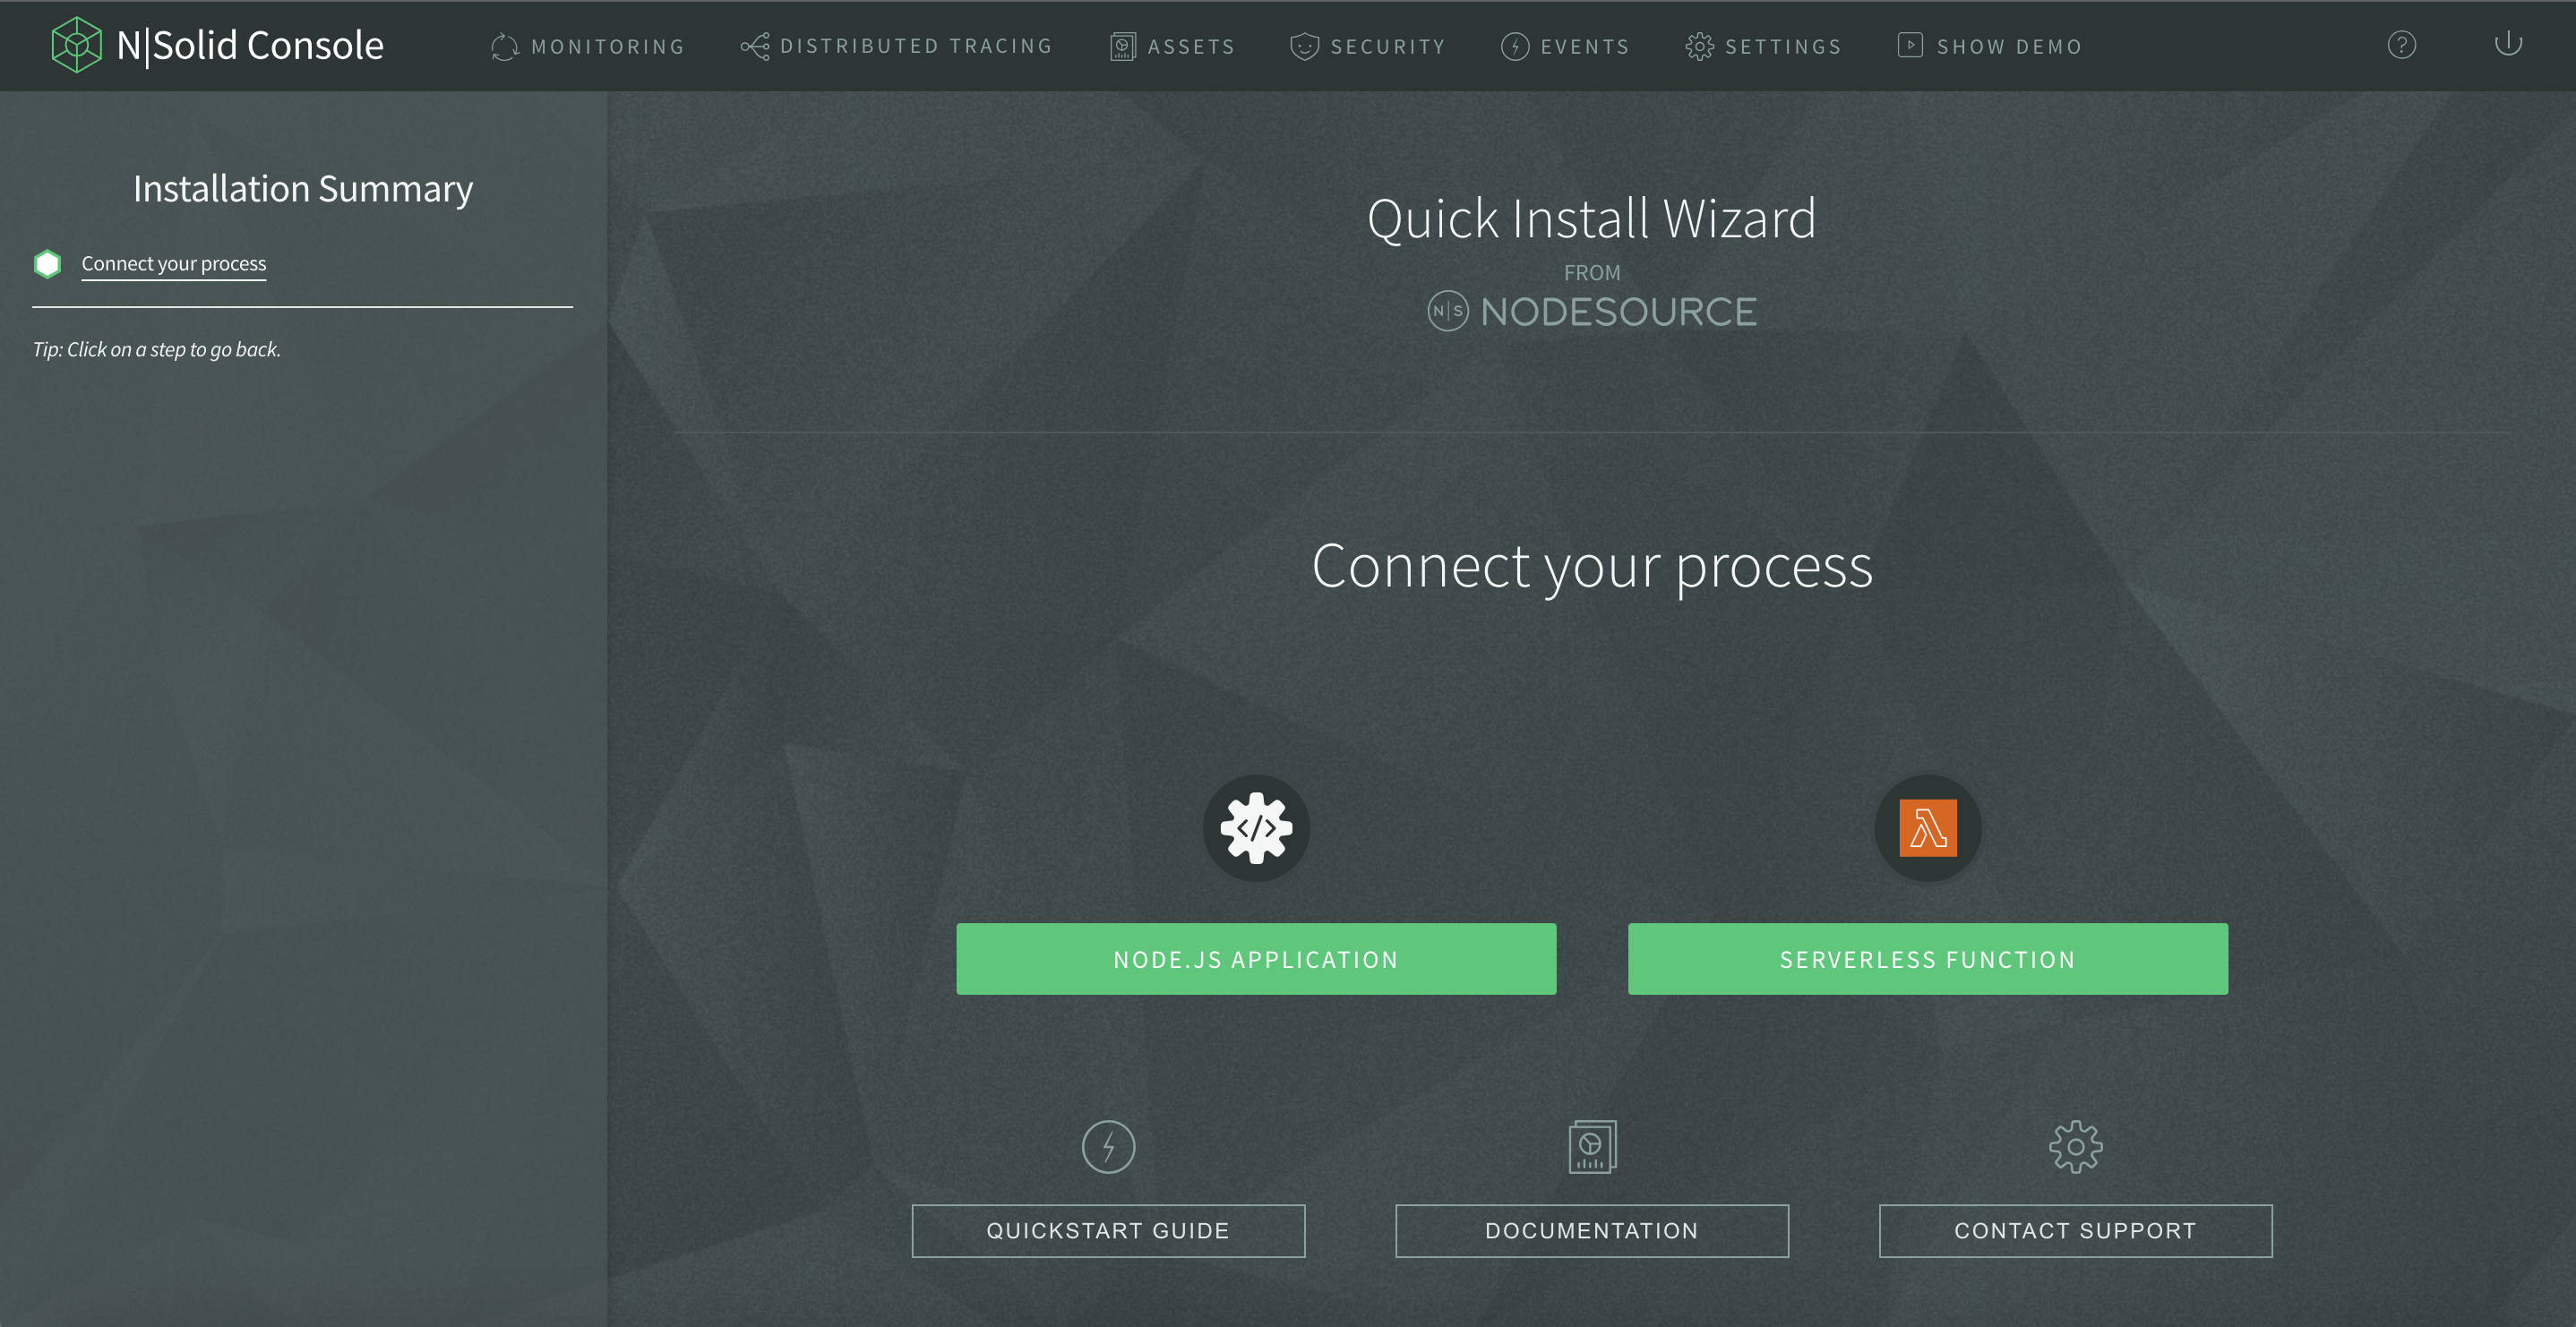
Img 2. N|Solid Serverless Installation Process
With this announcement, we are enabling the opportunity to connect a process following the indications of our Wizard. You will be able to connect the traces of your Node application through requests or connected functions, by connecting the data, you will be able to find the cause of latency issues, errors, and other problems in serverless environments.
How to apply Serverless Observability through N|Solid:
Key practices include leveraging distributed tracing to understand end-to-end request flows, instrumenting functions with custom metrics, analyzing logs for debugging and troubleshooting, and employing centralized observability platforms for comprehensive visibility.
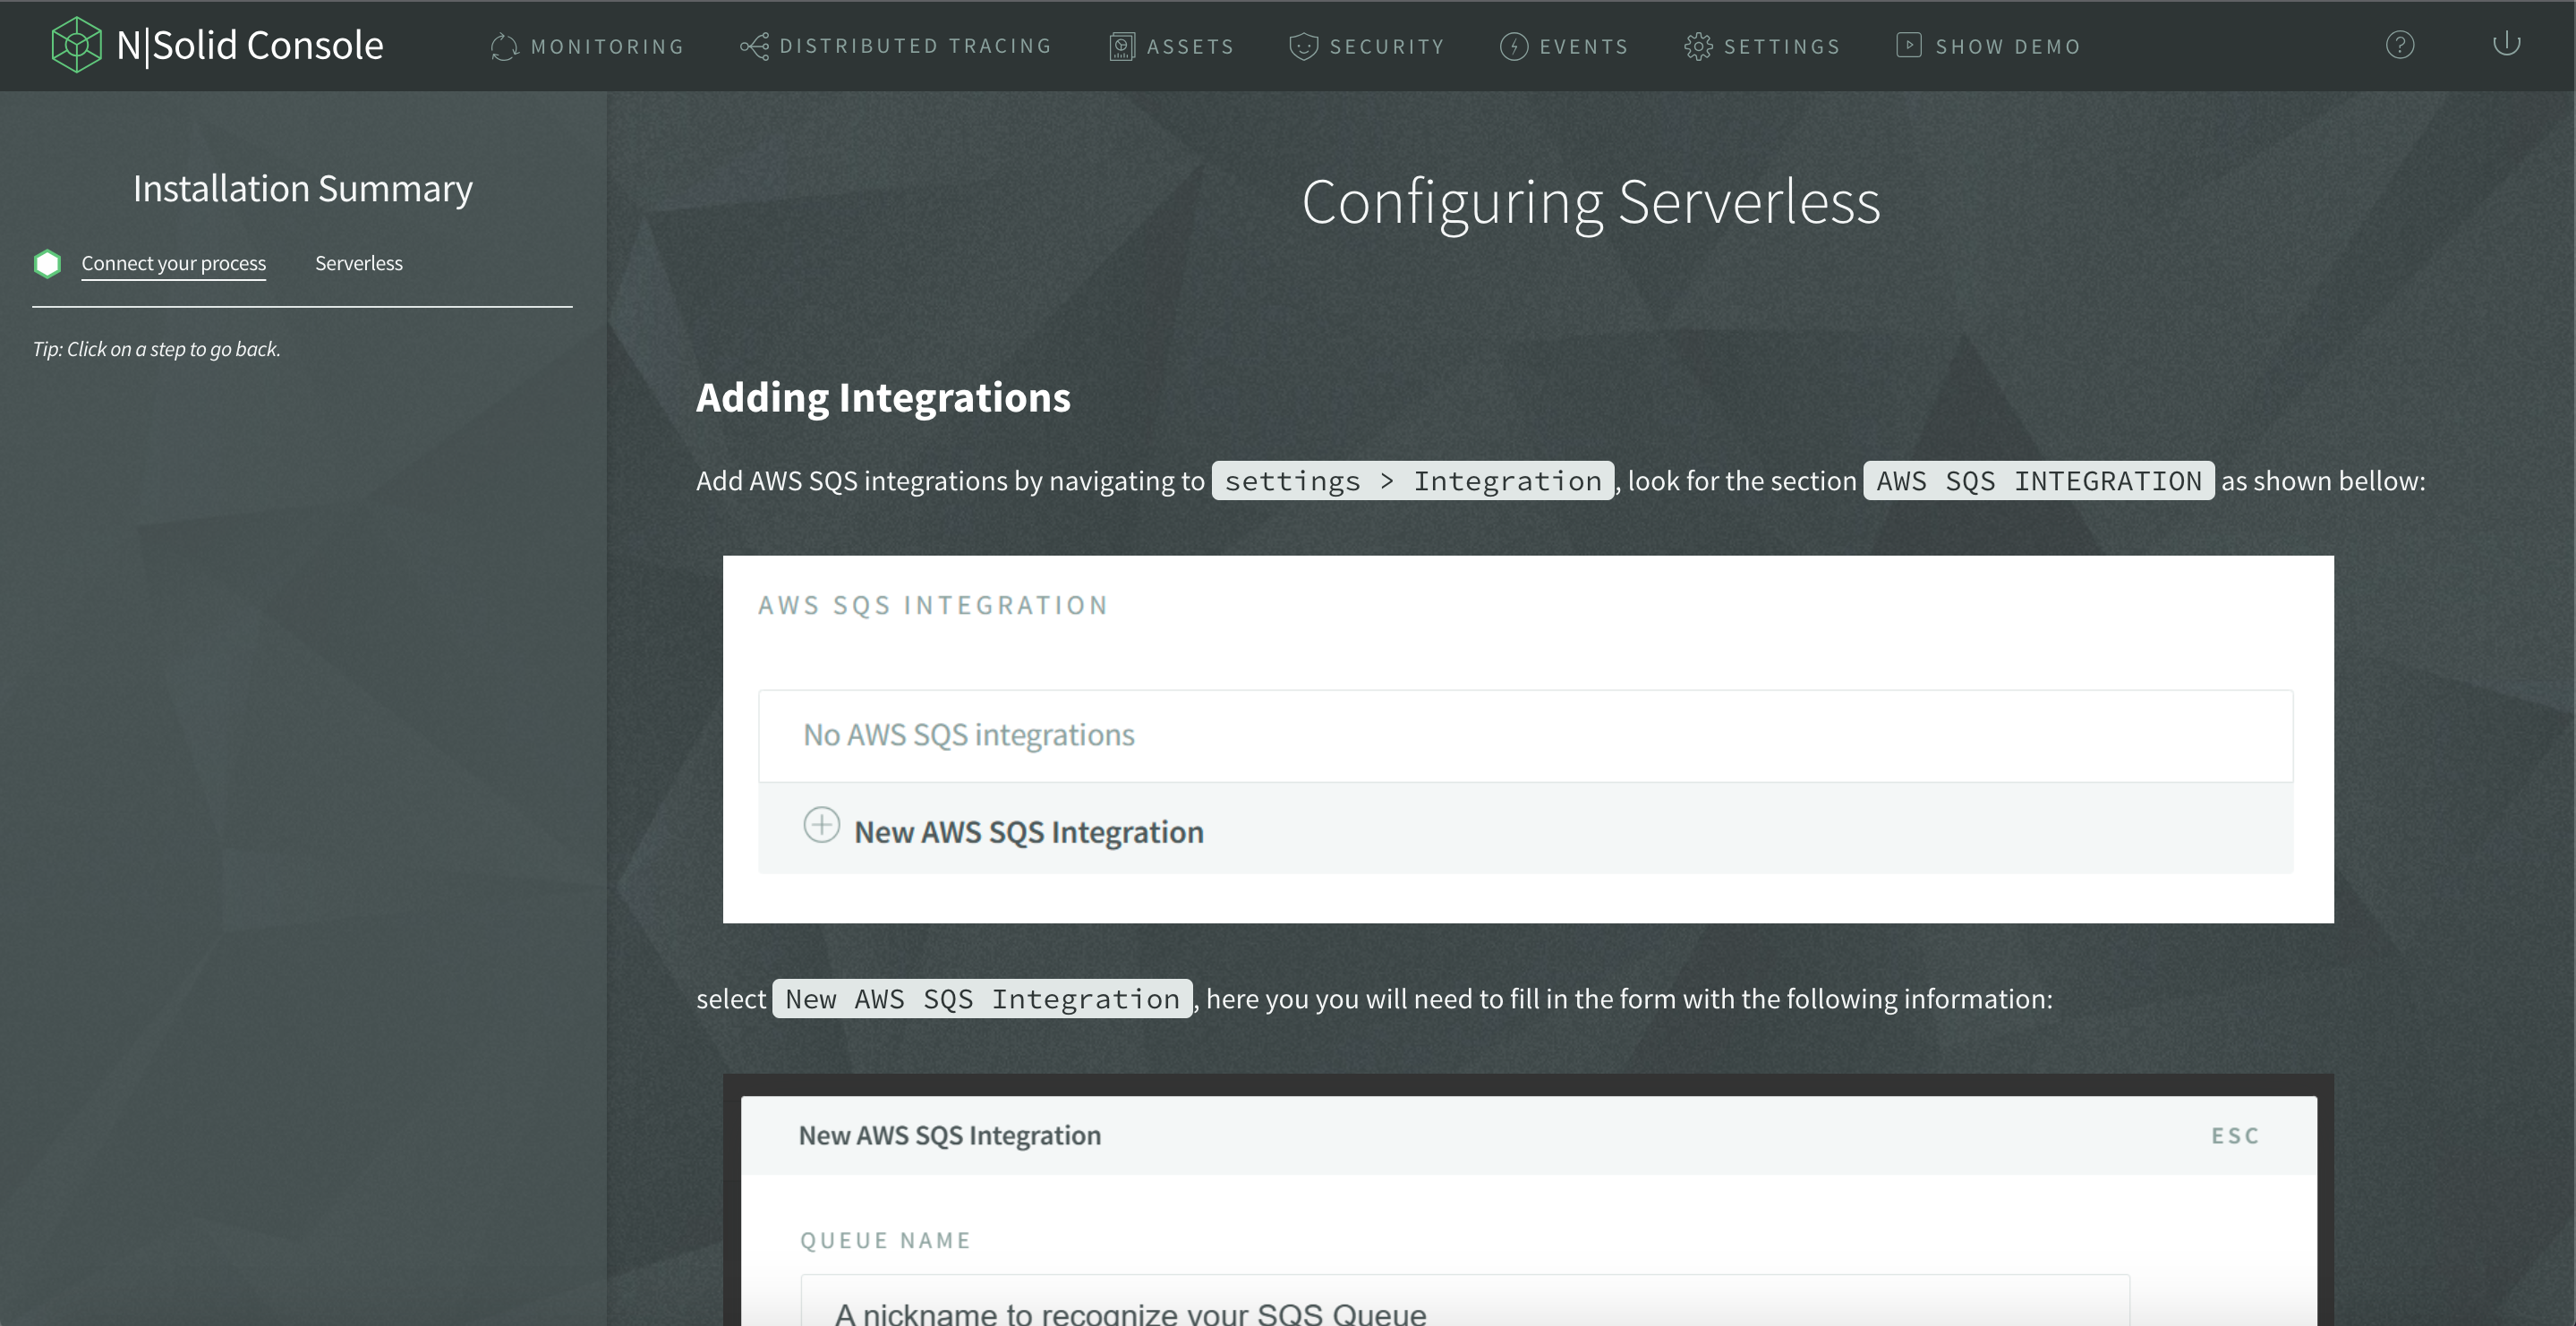
Img 3. N|Solid Serverless Configuration
To use loading Opentelemetry Instrumentation Modules, first, use the NSOLID_INSTRUMENTATION environment variable to specify and load the Opentelemetry instrumentation modules you want to utilize within your application. To enable instrumentation for specific modules, follow these steps:
-
For HTTP requests using the
httpmodule, set theNSOLID_INSTRUMENTATIONenvironment variable tohttp. -
If you're also performing PostgreSQL queries using the pg module, include it in the
NSOLID_INSTRUMENTATIONenvironment variable like this:http,pg. -
List all the relevant instrumentation modules required for your application. This will enable the tracing and monitoring of the specified modules, providing valuable insights into their performance and behavior.
-
Connect through integration the serverless functions; select and configure the environment variable you require. For more advanced settings, visit our NodeSource documentation.
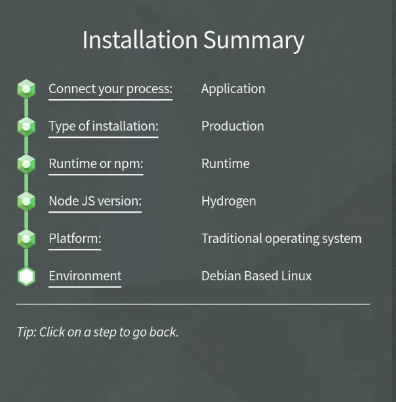
Img 4. N|Solid Wizard Installation Summary
In our NodeSource documentation, you will find CLI - Implementation and Instructions or directly follow the instructions of our Wizard:
- Install
- Usage
- Interactive Shell
- Inline Inputs
- Interactive Inputs
- Help
- Uninstall
Benefits of N|Solid Implementing Serverless
Serverless monitoring collects and analyzes serverless application data to identify and fix performance problems. This can be done using a variety of tools and techniques, including:
- Metrics: Metrics are data points that measure the performance of an application, such as the number of requests per second, the average response time, and the amount of memory used.
- Logs: Logs are records of events in an application, such as errors, warnings, and informational messages.
- Traces: Traces are records of a request's path through an application, including the time it spends in each function.
By collecting and analyzing this data, serverless monitoring tools can identify performance problems, such as:
- Cold starts: Cold starts is when a serverless function is invoked for the first time. This can cause a delay in the response time.
- Overcrowding: Overcrowding occurs when too many requests are sent to a serverless function simultaneously. This can cause the function to slow down or crash.
- Bottlenecks: Bottlenecks occur when a particular part of an application is slow. Some factors, such as inefficient code, a lack of resources, or a bug, can cause this.
Once a performance problem has been identified, serverless monitoring tools can help developers fix the problem. This can be done by:
- Tuning the application: Developers can tune the application by changing the code, configuration, or resources used.
- Evolving the application: Developers can evolve it by adding new features or changing how it works.
- Monitoring the application: Developers can continue monitoring the application to ensure that the problem has been fixed and the application performs as expected.
Benefits of N|Solid Implementing Serverless
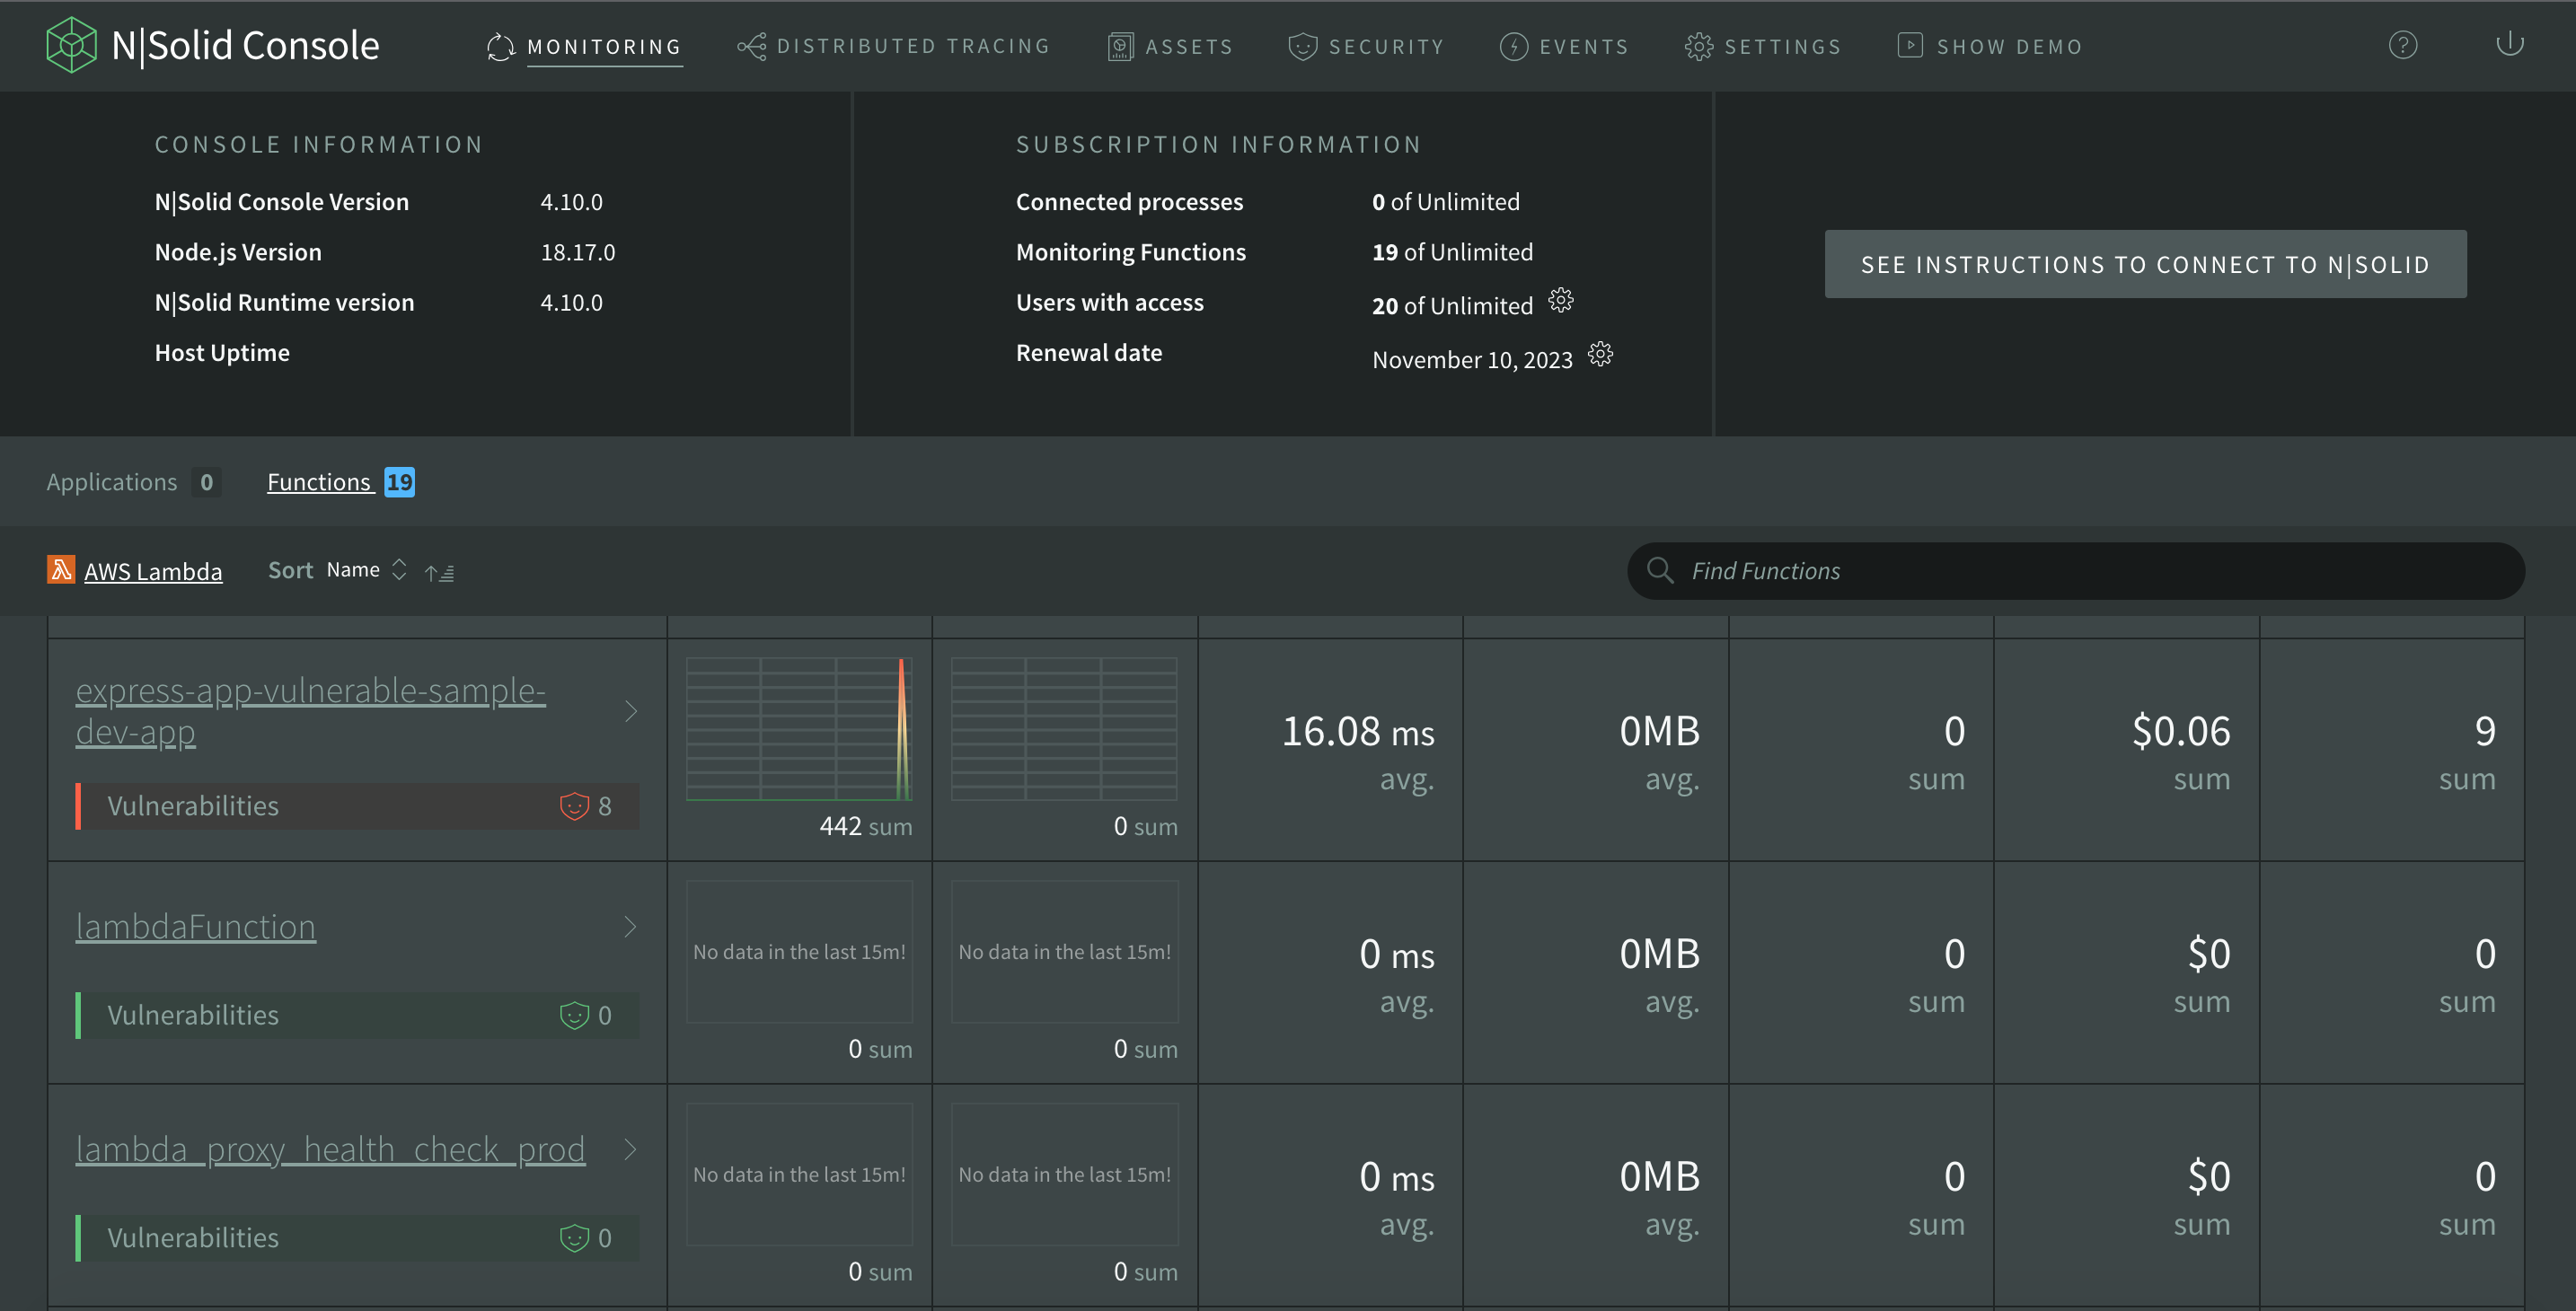
Img 5. N|Solid Functions Dashboard
Now, directly in your N|Solid Console, you’ll have the Function Dashboard, which will allow you to review in-depth and detail all the functions you have connected.
By selecting the functions, you can access the Function Detail View.
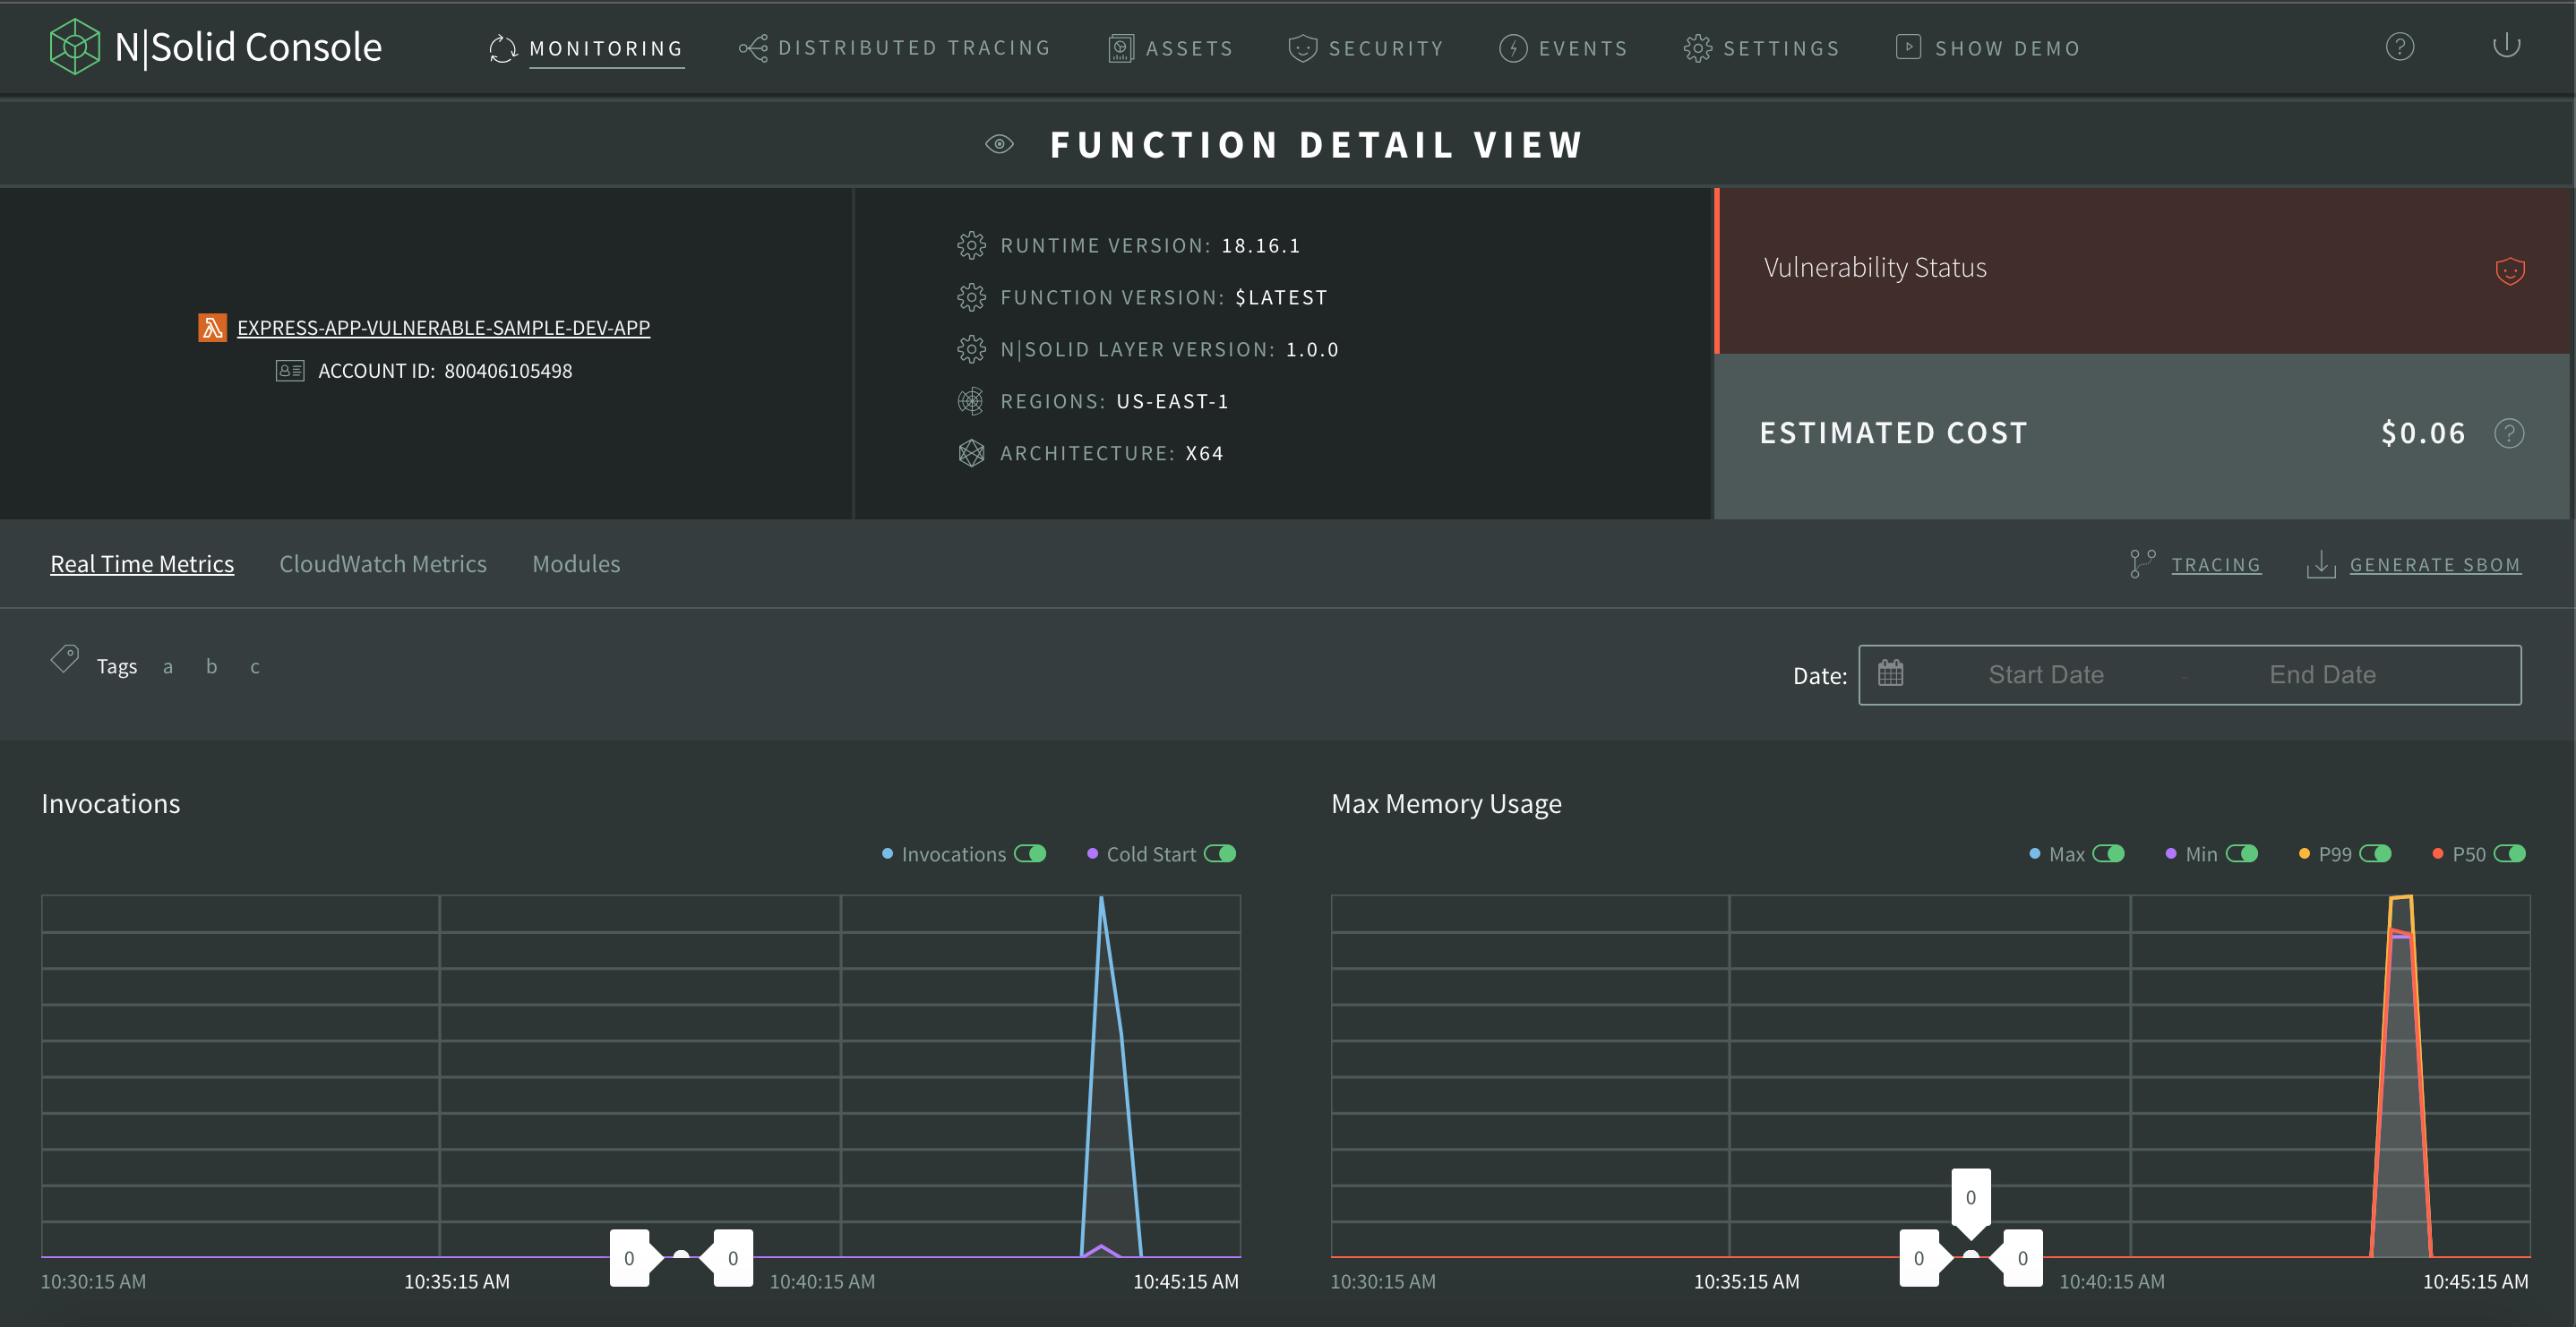 Img 6. N|Solid Function Detail View
In the first content block, you will have the following:
The function's name and the provider's icon. Note: If you click on the function itself, it will open the function itself in a new tab directly in AWS.
On the other hand, in the central box, you will have:
- RUNTIME VERSION
- FUNCTION VERSION
- ACCOUNT ID
- N|Solid LAYER: (It is versioned, which is what allows us to see the AWS info)
- REGIONS: The zone of the function. Where it is running that specific version.
- ARCHITECTURE: Lambda can have several Linux architectures. This info comes directly from AWS.
And finally, on the right corner of our console, we will have Vulnerability Status, and below this, Estimated Cost: How much are you spending on this function? For more information, please review our documentation.
About N|Solid Layer
In an AWS Lambda, you can have information about hundreds of instances, AWS does it for you, but you don't have information on each invocation. They show you by default the last 5 minutes through the median, the 99th percentile, etc., but they can't give us invocation by invocation individually; they simply group them.
There are two types of data we have from AWS Lambda:
- Real-Time Metrics or Telemetry API Metrics
- Cloudwatch Metrics
The metrics that CloudWatch reports are not real-time. They are extracted from the CloudWatch API by the Lambda Metrics Forwarder and displayed as AWS Lambda delivers them directly. This means there may be a delay of up to a few minutes between recording and displaying a metric.
The Telemetry API Metrics, which we extract, through Lambda layers, through modules that we install to your function to be executed.
We distributed this information as a layer,N|Solid Layer, injecting code inside. An AWS extension for N|Solid provides information about the life cycle of each Lambda function providing data to the console:
- Generate the Timeline Graph
- Span: Span Details, Path of the Span, and filter the results by attributes of the Span.
- Changing Time Range
- Generate SBOM reports
Our method tracks where the function is frozen to optimize Lambda resources within certain limits, allowing access to the information even after the function has been frozen.🤯In real-time, the registration is detected, providing the key information on each invocation in each instance.
In Closing,
We've been working on serverless observability for our customers for a while because we believe in the value of leveraging the technology approach. Serverless provides many benefits for developers and teams, but it can be difficult to provide quality observability without adding a lot of expensive overhead.
N|Solid can now help teams develop and maintain better software, resolve issues faster, and provide security for both traditional and serverless Node.js Applications. Try it for free, or connect with us to learn more.
It's exciting to share this new release, our first in a series of serverless cloud platforms. Look for Azure and GCP to be released soon. Thanks for reading all about it.promising future ahead. Our heartfelt gratitude goes to our exceptional team for their unwavering dedication and hard work in bringing this vision to life.
Related Links
- AWS Lambda Documentation - https://docs.aws.amazon.com/lambda/latest/dg/welcome.html
- Layer Concept - https://docs.aws.amazon.com/lambda/latest/dg/gettingstarted-concepts.html#gettingstarted-concepts-layer
- Cloudwatch Metrics - https://docs.aws.amazon.com/lambda/latest/dg/monitoring-metrics.html#monitoring-metrics-types
- Lambda Extensions - https://docs.aws.amazon.com/lambda/latest/dg/lambda-extensions.html
- CloudFlare Serverless Computing - https://www.cloudflare.com/learning/serverless/what-is-serverless/
- IBM - What is serverless? - https://www.ibm.com/topics/serverless
- GCP Serverless - https://cloud.google.com/serverless?hl=es-419