Node.js Performance Monitoring - Part 2: Monitoring the Metrics
Of all the features your Node.js application could (or should) have, great performance is one of the most important. This is especially true if you work on applications that are public-facing or even internal apps that are essential for day-to-day business functions. For any of these "mission-critical" applications, performant behavior should include:
- Minimal or no downtime due to preventable outages
- Predictable resource usage within a normal range (what is "normal" may be different from one application to the next)
- Effective scaling to meet peak usage demands
Understanding Application Health
In Part 1, we talked about which metrics are key to understanding the health of your application. While "normal" and “abnormal” ranges for each of these data points—CPU usage, heap usage, and event loop lag—will naturally vary a bit between applications, the more important factor is that you can identify when one or more of these stats is outside the expected normal range for the individual application you’re working on. Ultimately, this means you need to decide what is the definition of “normal” for your apps.
For existing applications in production, you can usually start to determine what that baseline looks like by collecting data for a week or two. Specific patterns of behavior will emerge over this period, some faster than others, driven by what your application does and how it is used. Most applications see a daily trend of peak data usage during the day followed by a lower points during the night, or off-hours.
For instance, if your application is used mostly in a business context, you may see a drop in activity over the weekend. On the other hand, an online gaming or video streaming application might experience higher load in the evenings and during the weekends than during normal business hours. In some cases, internal applications may deviate from this common weekly cyclical pattern if, for instance, a backup or report is configured to run on a monthly or a quarterly basis. The more familiar you are with the application itself, the easier it’ll be to determine what an acceptable range of normal behavior is.
CPU Profiles
CPU Profiles, as discussed in Part 1, are a key tool to digging down and investigating issues around Node.js applications that are using too much CPU time. With N|Solid, CPU Profiles can be triggered automatically and remotely across any of your Node.js applications and processes. These profiles can then be examined within the N|Solid Console to begin to gain some insight into the surrounding issues causing high CPU usage.
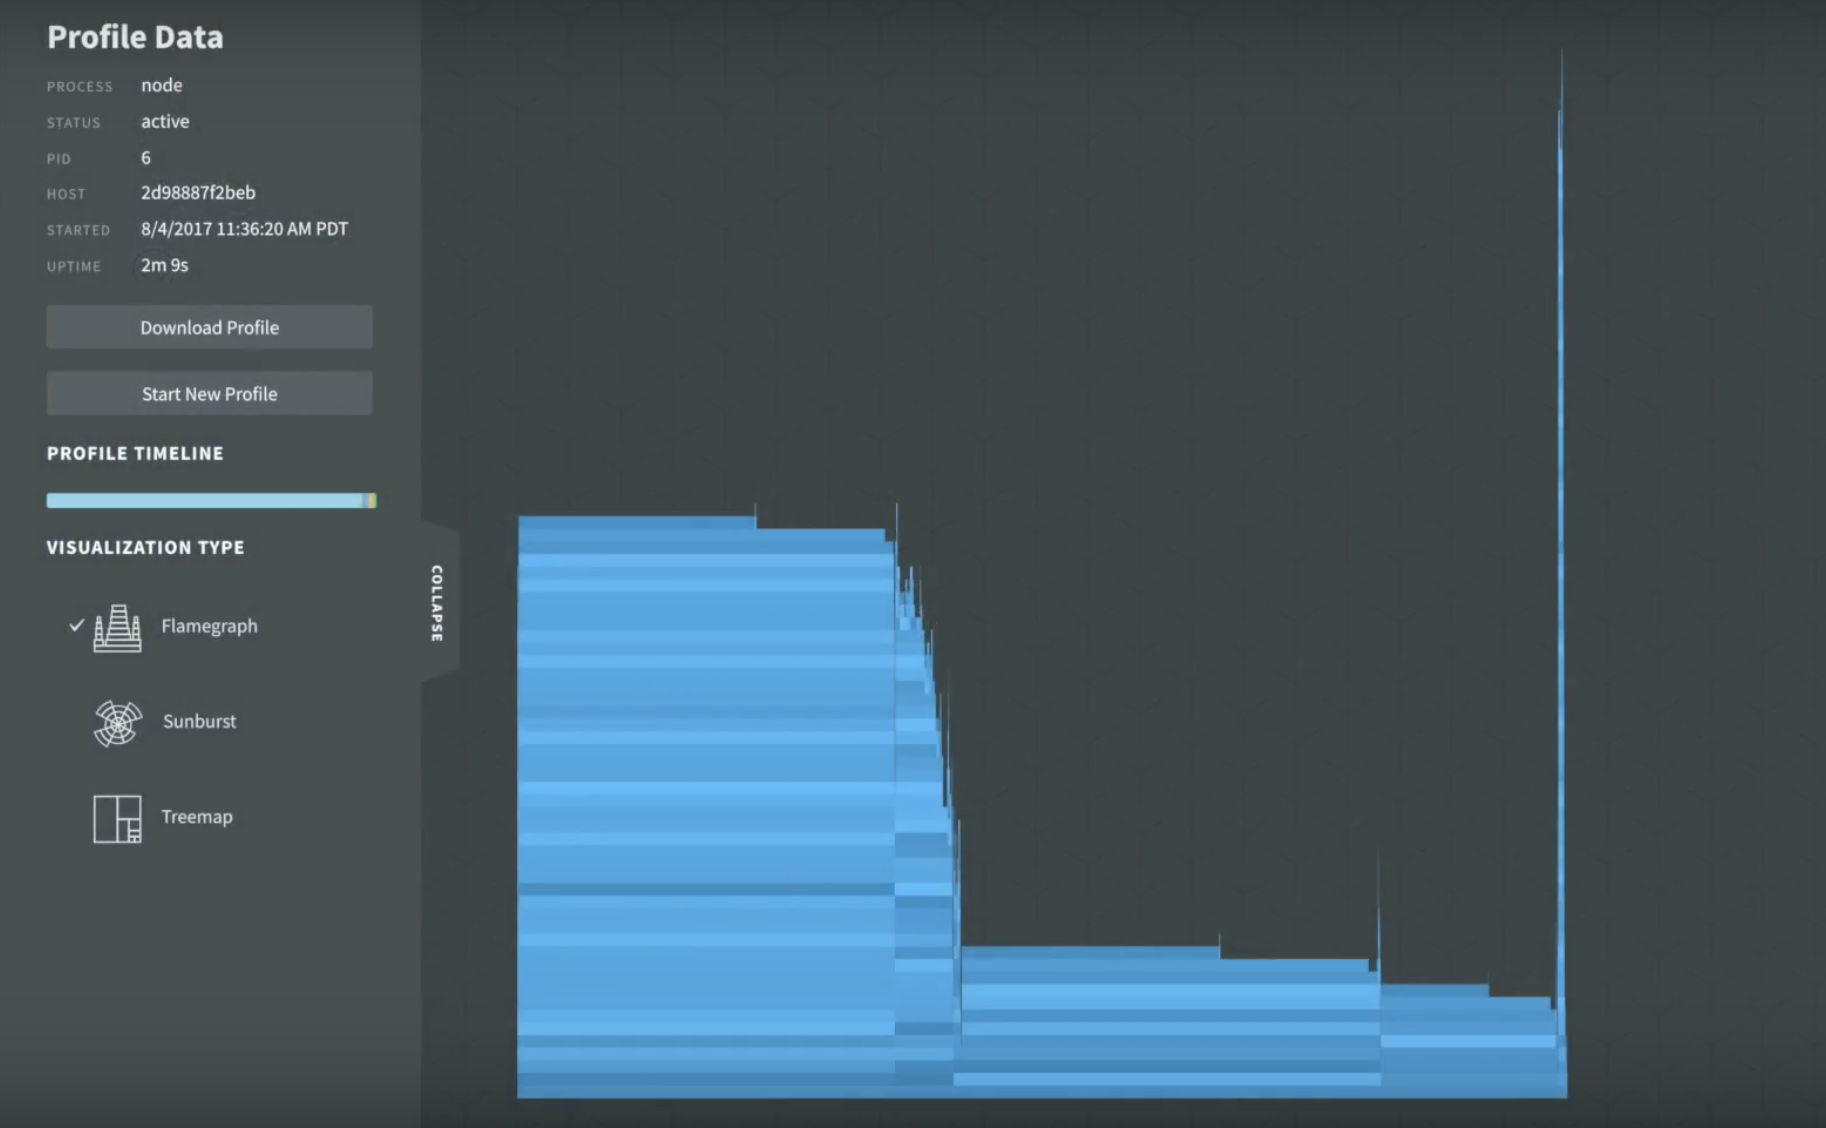
In the above screenshot, we’re examining a CPU profile for an application as a flame graph. Vertically, we’re seeing a stacking of function calls, where each block in this graph is a function, and horizontally we’re seeing how much time elapsed in the execution of each function.
From this, we can identify two obvious patterns: the large spike on the right seems significant, but the width of the block shows that even though there is a very deep call depth, it is consuming a minor percentage of the overall CPU time. There are two much wider blocks, however, one on the left and one in the center, that don’t have the same call depth but are taking up considerably more of our CPU time.
To discover the most costly parts of our application, we identify the blocks that are taking up the most horizontal space without anything stacked on top of them. So we would begin by inspecting the two blocks that sit on top of the two widest stacks, then we would consider the blocks they are stacked directly on top of as there is also some additional CPU time being used by those. By simply investigating those four functions we can account for roughly 75% of the CPU time occupied by execution sampling. Depending on the optimizations that we may be able to discover, there is scope to be able to decrease the CPU usage here by up to that amount. Of course, it’s possible that our code is optimized as we can make it given current constraints, but it’s always worth finding low-hanging fruit given the business benefits that applications with leaner CPU consumption can provide..
Heap Snapshots
Heap usage is another common gotcha in Node.js applications. A memory leak can eventually cause a Node.js process to crash. Heap snapshots help us to understand where memory is being used, and to provide us a starting point for debugging issues around heap usage in Node.js applications.
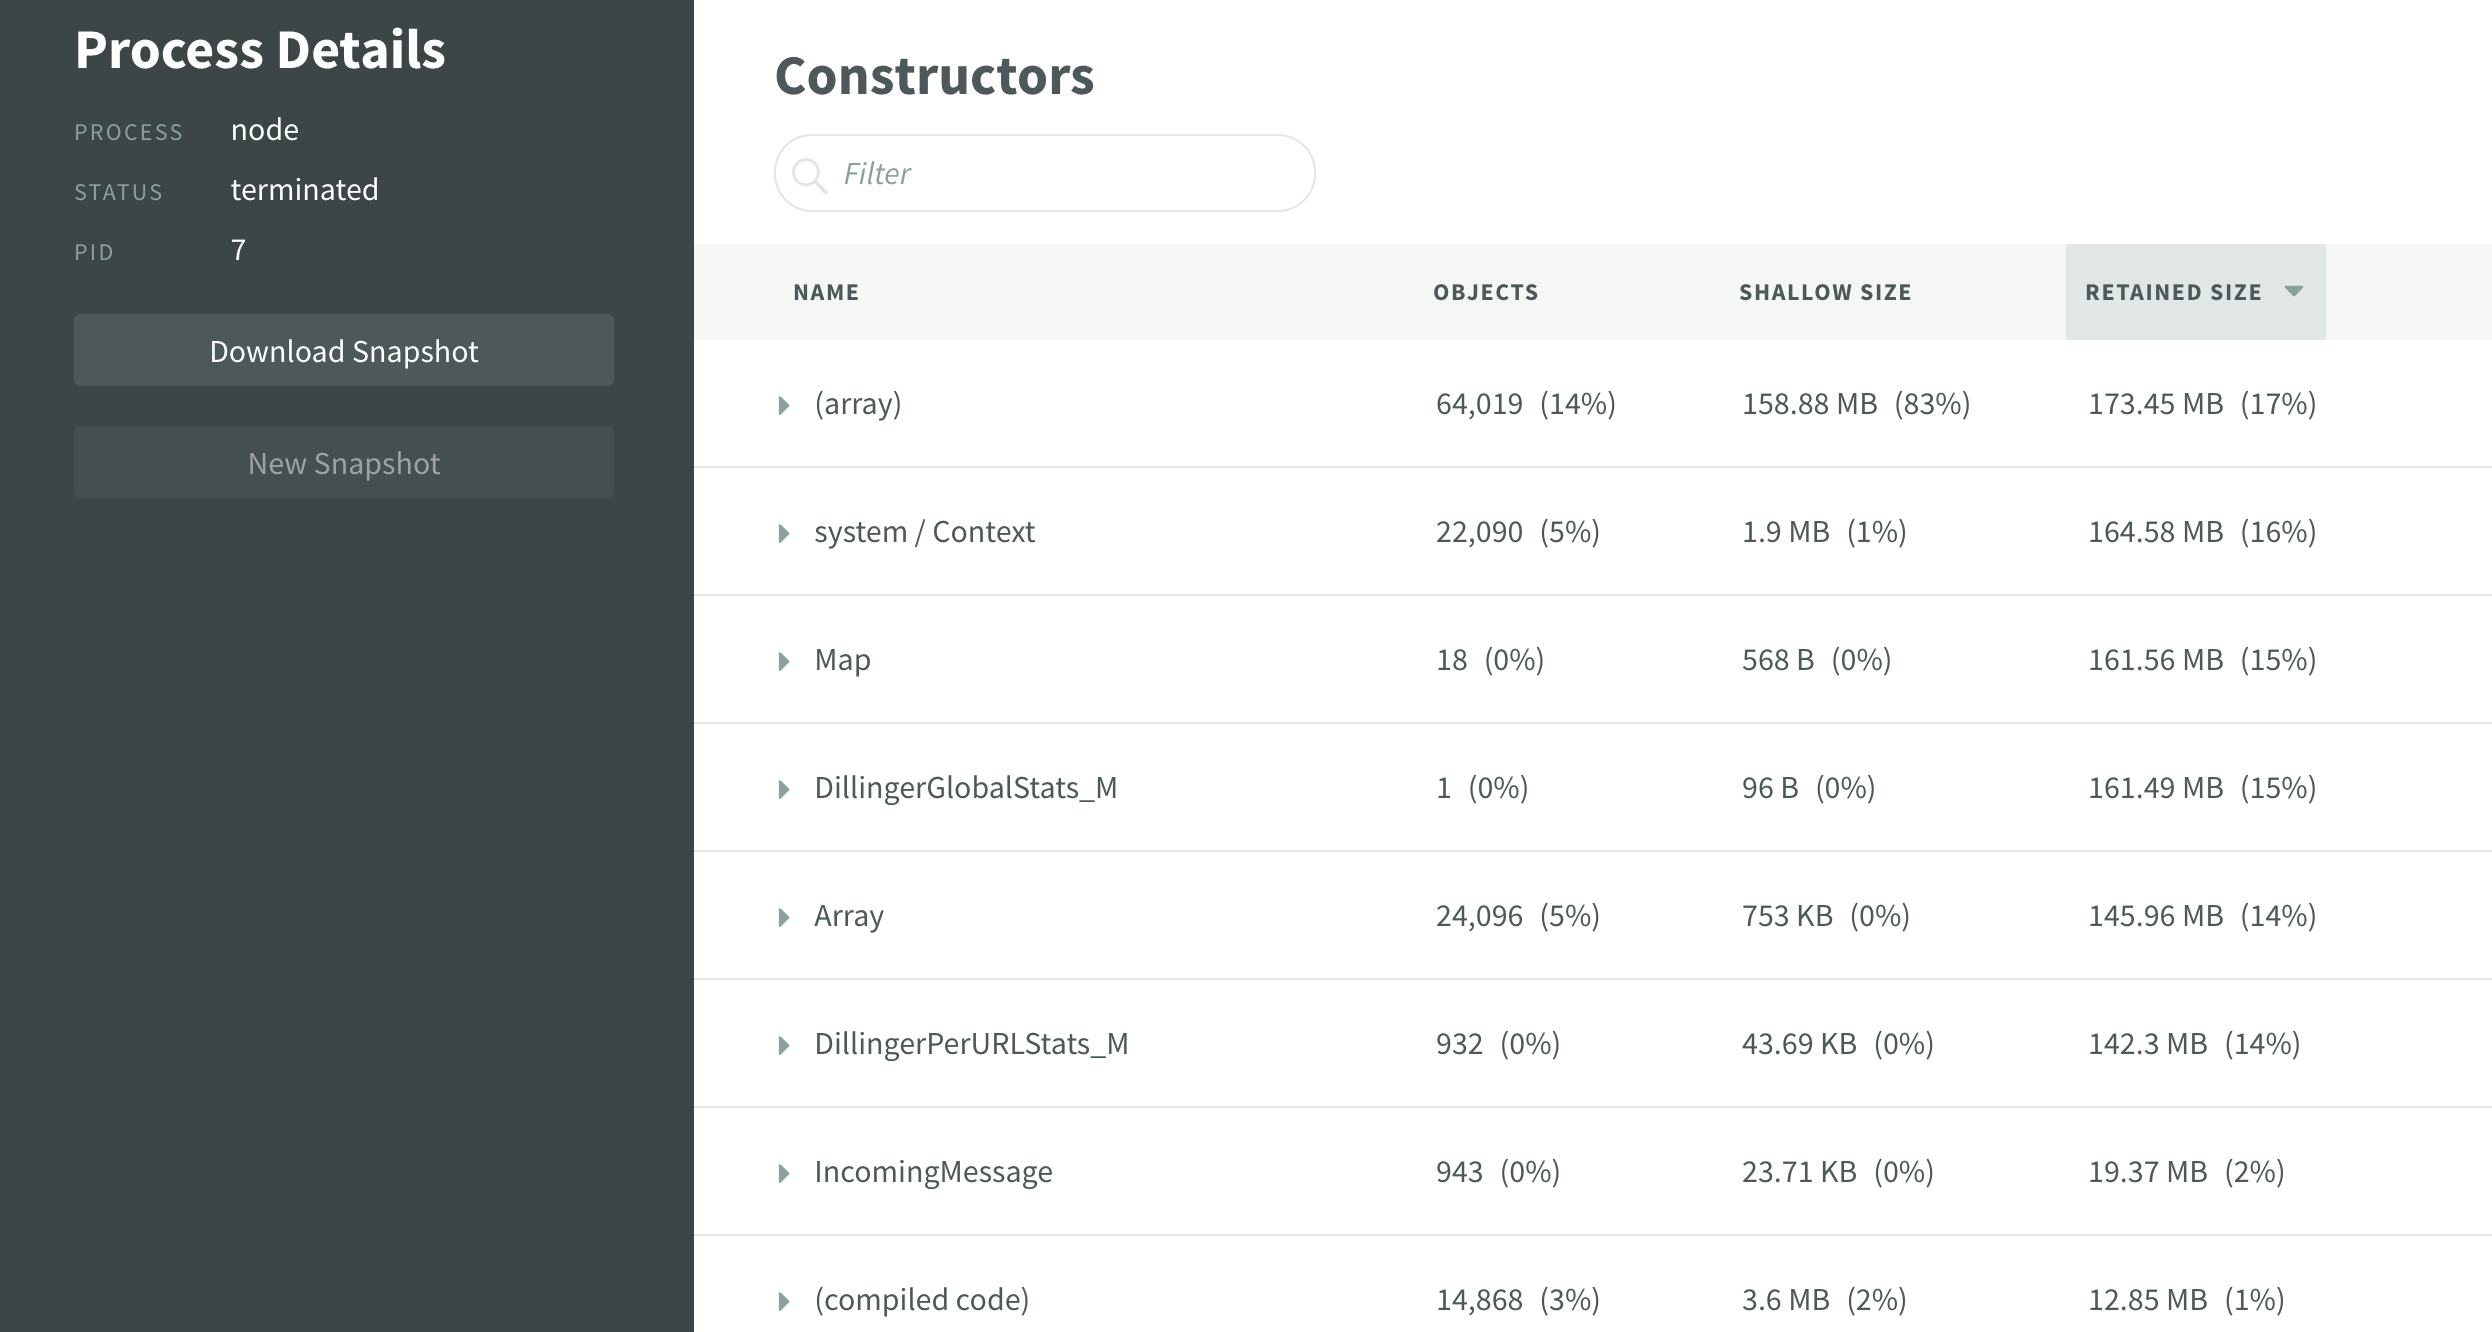
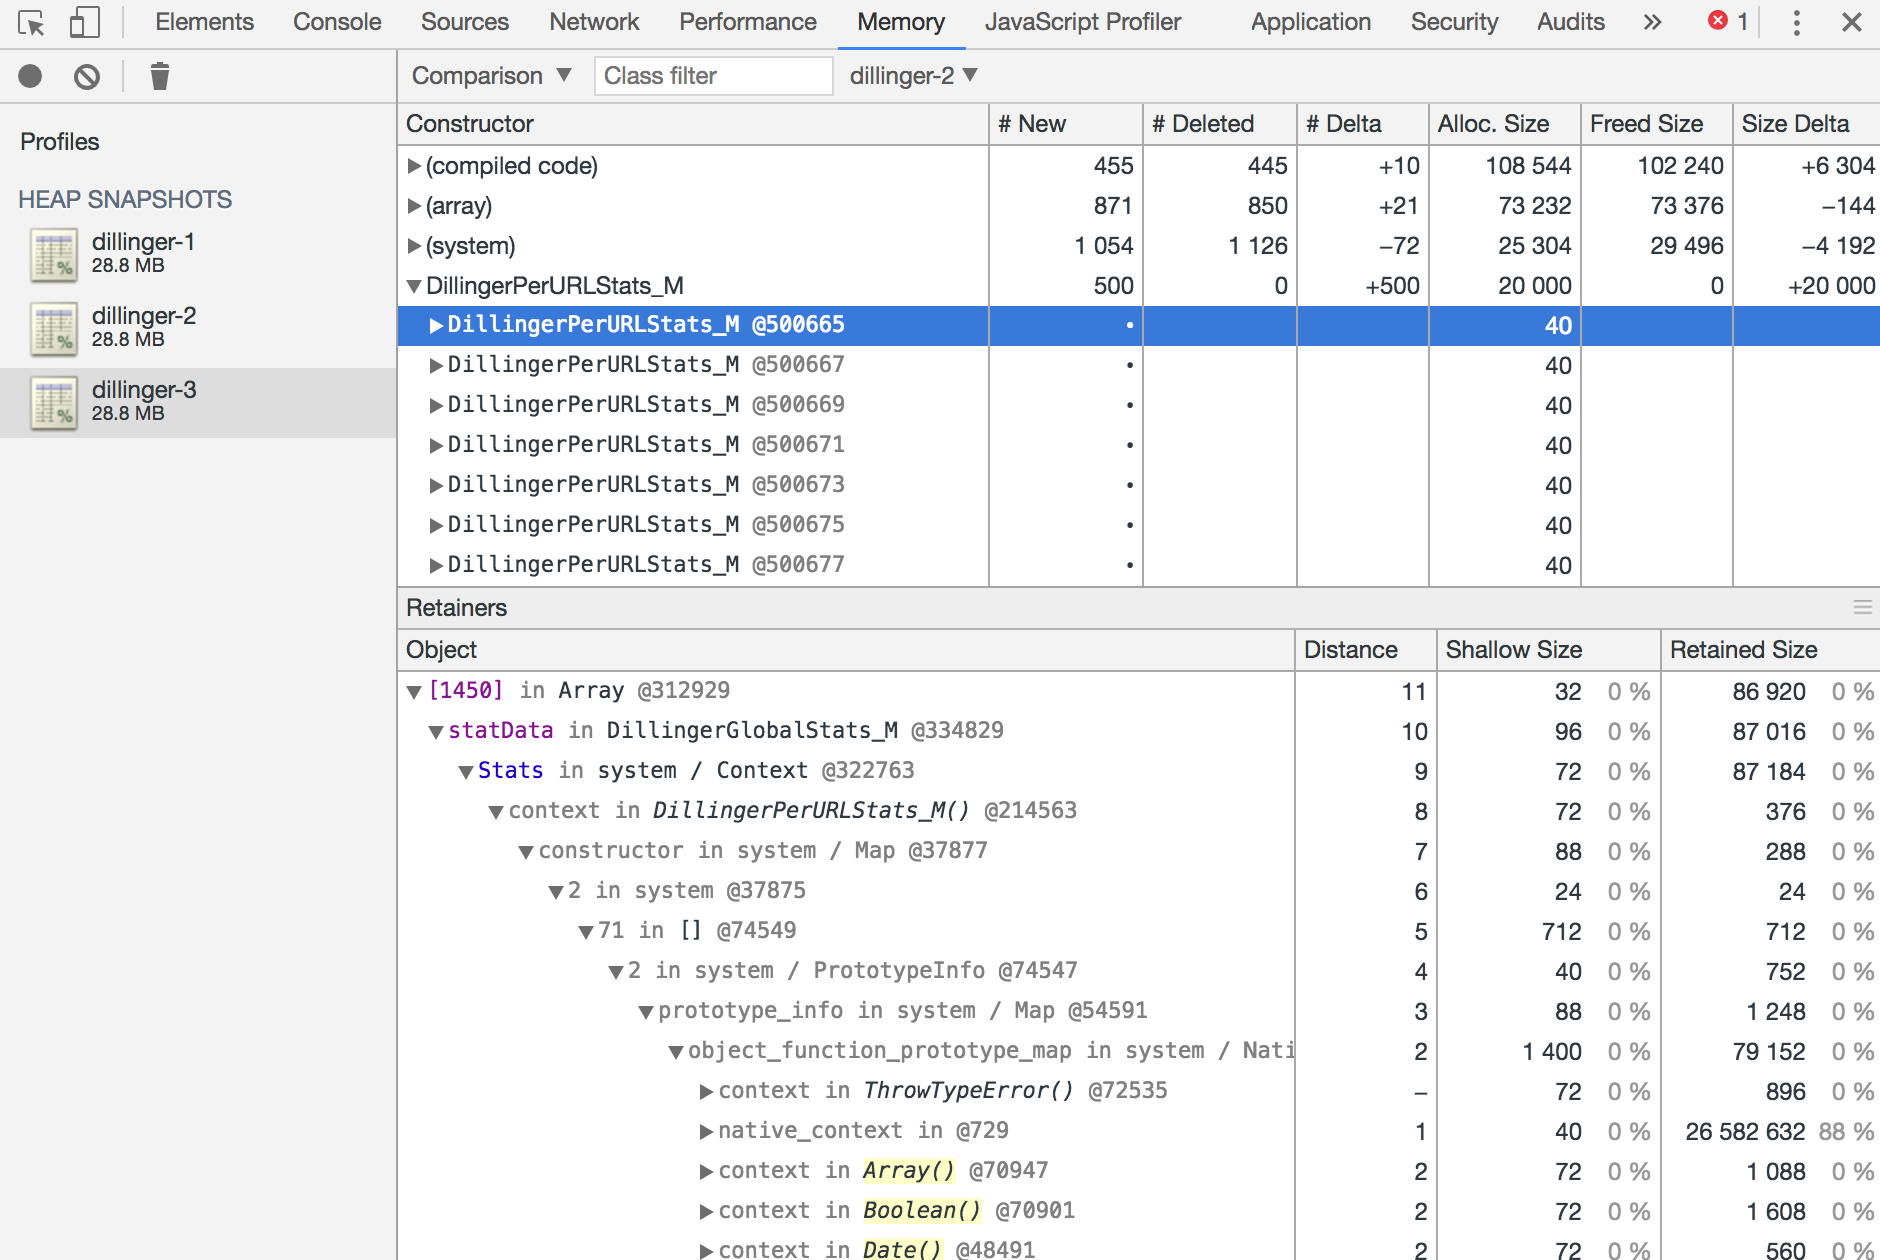 Above you can see both a quick examination of a heap snapshot inside of N|Solid, and a deeper dive into the downloaded snapshot inside of Chrome DevTools thanks to the export functionality provided by the N|Solid Console. N|Solid can really help out here with automatic snapshots being triggered by application thresholds and enabling you to collect them over time and eventually dig a bit deeper by loading the snapshots in DevTools to compare and contrast any issues present.
Sane Defaults for N|Solid Thresholds and Alerts
Let’s walk through some common cases where you’d want to set a threshold with N|Solid and trigger actions based on severity.
It’s important to understand that every application will have its own needs and requirements. Some processes may need to broken out to perform CPU-intensive, synchronous tasks. Heap usage is a bit more tricky. Memory usage varies from application to application depending on the workflows and data sets, so there’s not a single right answer.
Exceeded Heap Usage Threshold
Common Triggers:
- Memory Leaks
Common Settings:
- Limit: 65% Memory Threshold
- Action: Trigger heap snapshot
- Action: Ops team alerts (Slack, Webhooks, Email)
Heap usage varies greatly from app to app, so take this number with a grain of salt - if your applications typically perform near or above 65% memory, you’ll want to adjust to a higher memory threshold.
Exceeded CPU Usage Threshold
Common Triggers:
- Blocking Synchronous Tasks
- CPU intensive computation
Common Threshold Settings:
- Limit: 65% CPU Threshold
- Action: Trigger CPU Snapshot
- Action: Ops team alerts (Slack, Webhooks, Email)
What is the Impact of Monitoring Node.js Application Performance?
When you’re looking to collect these kind of metrics, you do need to be aware of a common gotcha. Certain tooling, like some third-party APMs, take an approach that can have quite an impact on the performance of Node.js applications themselves.
While these tools are usually great in polyglot environments, they can have a pretty severe impact on performance at scale. In some cases we’ve witnessed, they can have up to a 40% impact on performance. With Node.js, that’s not really acceptable because one of the key benefits is its performance.
Thankfully, N|Solid can help you decrease this APM overhead in certain circumstances. If you're using AppDynamics, it will automatically utilize the N|Solid API to avoid some of the more costly monitoring of its own. Likewise, if your APM provider can consume data from StatsD, you can set up a StatsD integration from the N|Solid agent on each Node.js process. Otherwise, performant and reliable production tooling around perf monitoring can be a bit of a pain.
N|Solid affords a unique approach to performance monitoring in Node.js. N|Solid collects performance data at the runtime-level from its agent, meaning you drop in the N|Solid binary as a direct replacement for the plain Node.js binary, and you’re good to go. The benefit of this is that there’s relatively little performance overhead for consumed by N|Solid in a running application—around 1%—which is going to be within an acceptable range for just about any Node.js application that needs this level of monitoring.