Solving Memory Leaks in Node.js has Never Been Easier, Introducing the Latest Version of N|Solid

We are thrilled to announce the release of a new feature in N|Solid that includes sample heap profiling and heap objects observability for main processes and worker threads.
N|Solid is known for its Node.js performance and security observability and diagnostic tools and best-in-class low overhead has completed a new innovation to hunt memory leaks in development and production environments.
Memory is a precious resource in computing. Memory leaks can cause persistent application crashes, increased billing costs, and wasted valuable server resources. Tracking down memory leaks is a real challenge, especially in Node. Now, with N|Solid, we have made it easy thanks to “heap sampling”.
With N|Solid's heap sampling, you can now trace memory leaks in your production applications on-demand. Using the actionable metrics from N|Solid, including heap usage, your application can trigger profiling automatically. The powerful flame graph visualization shows exactly where the problem lies by displaying the allocation stack trace and heap size. This allows you to quickly pinpoint and fix memory issues without constantly monitoring dashboards for anomalies.
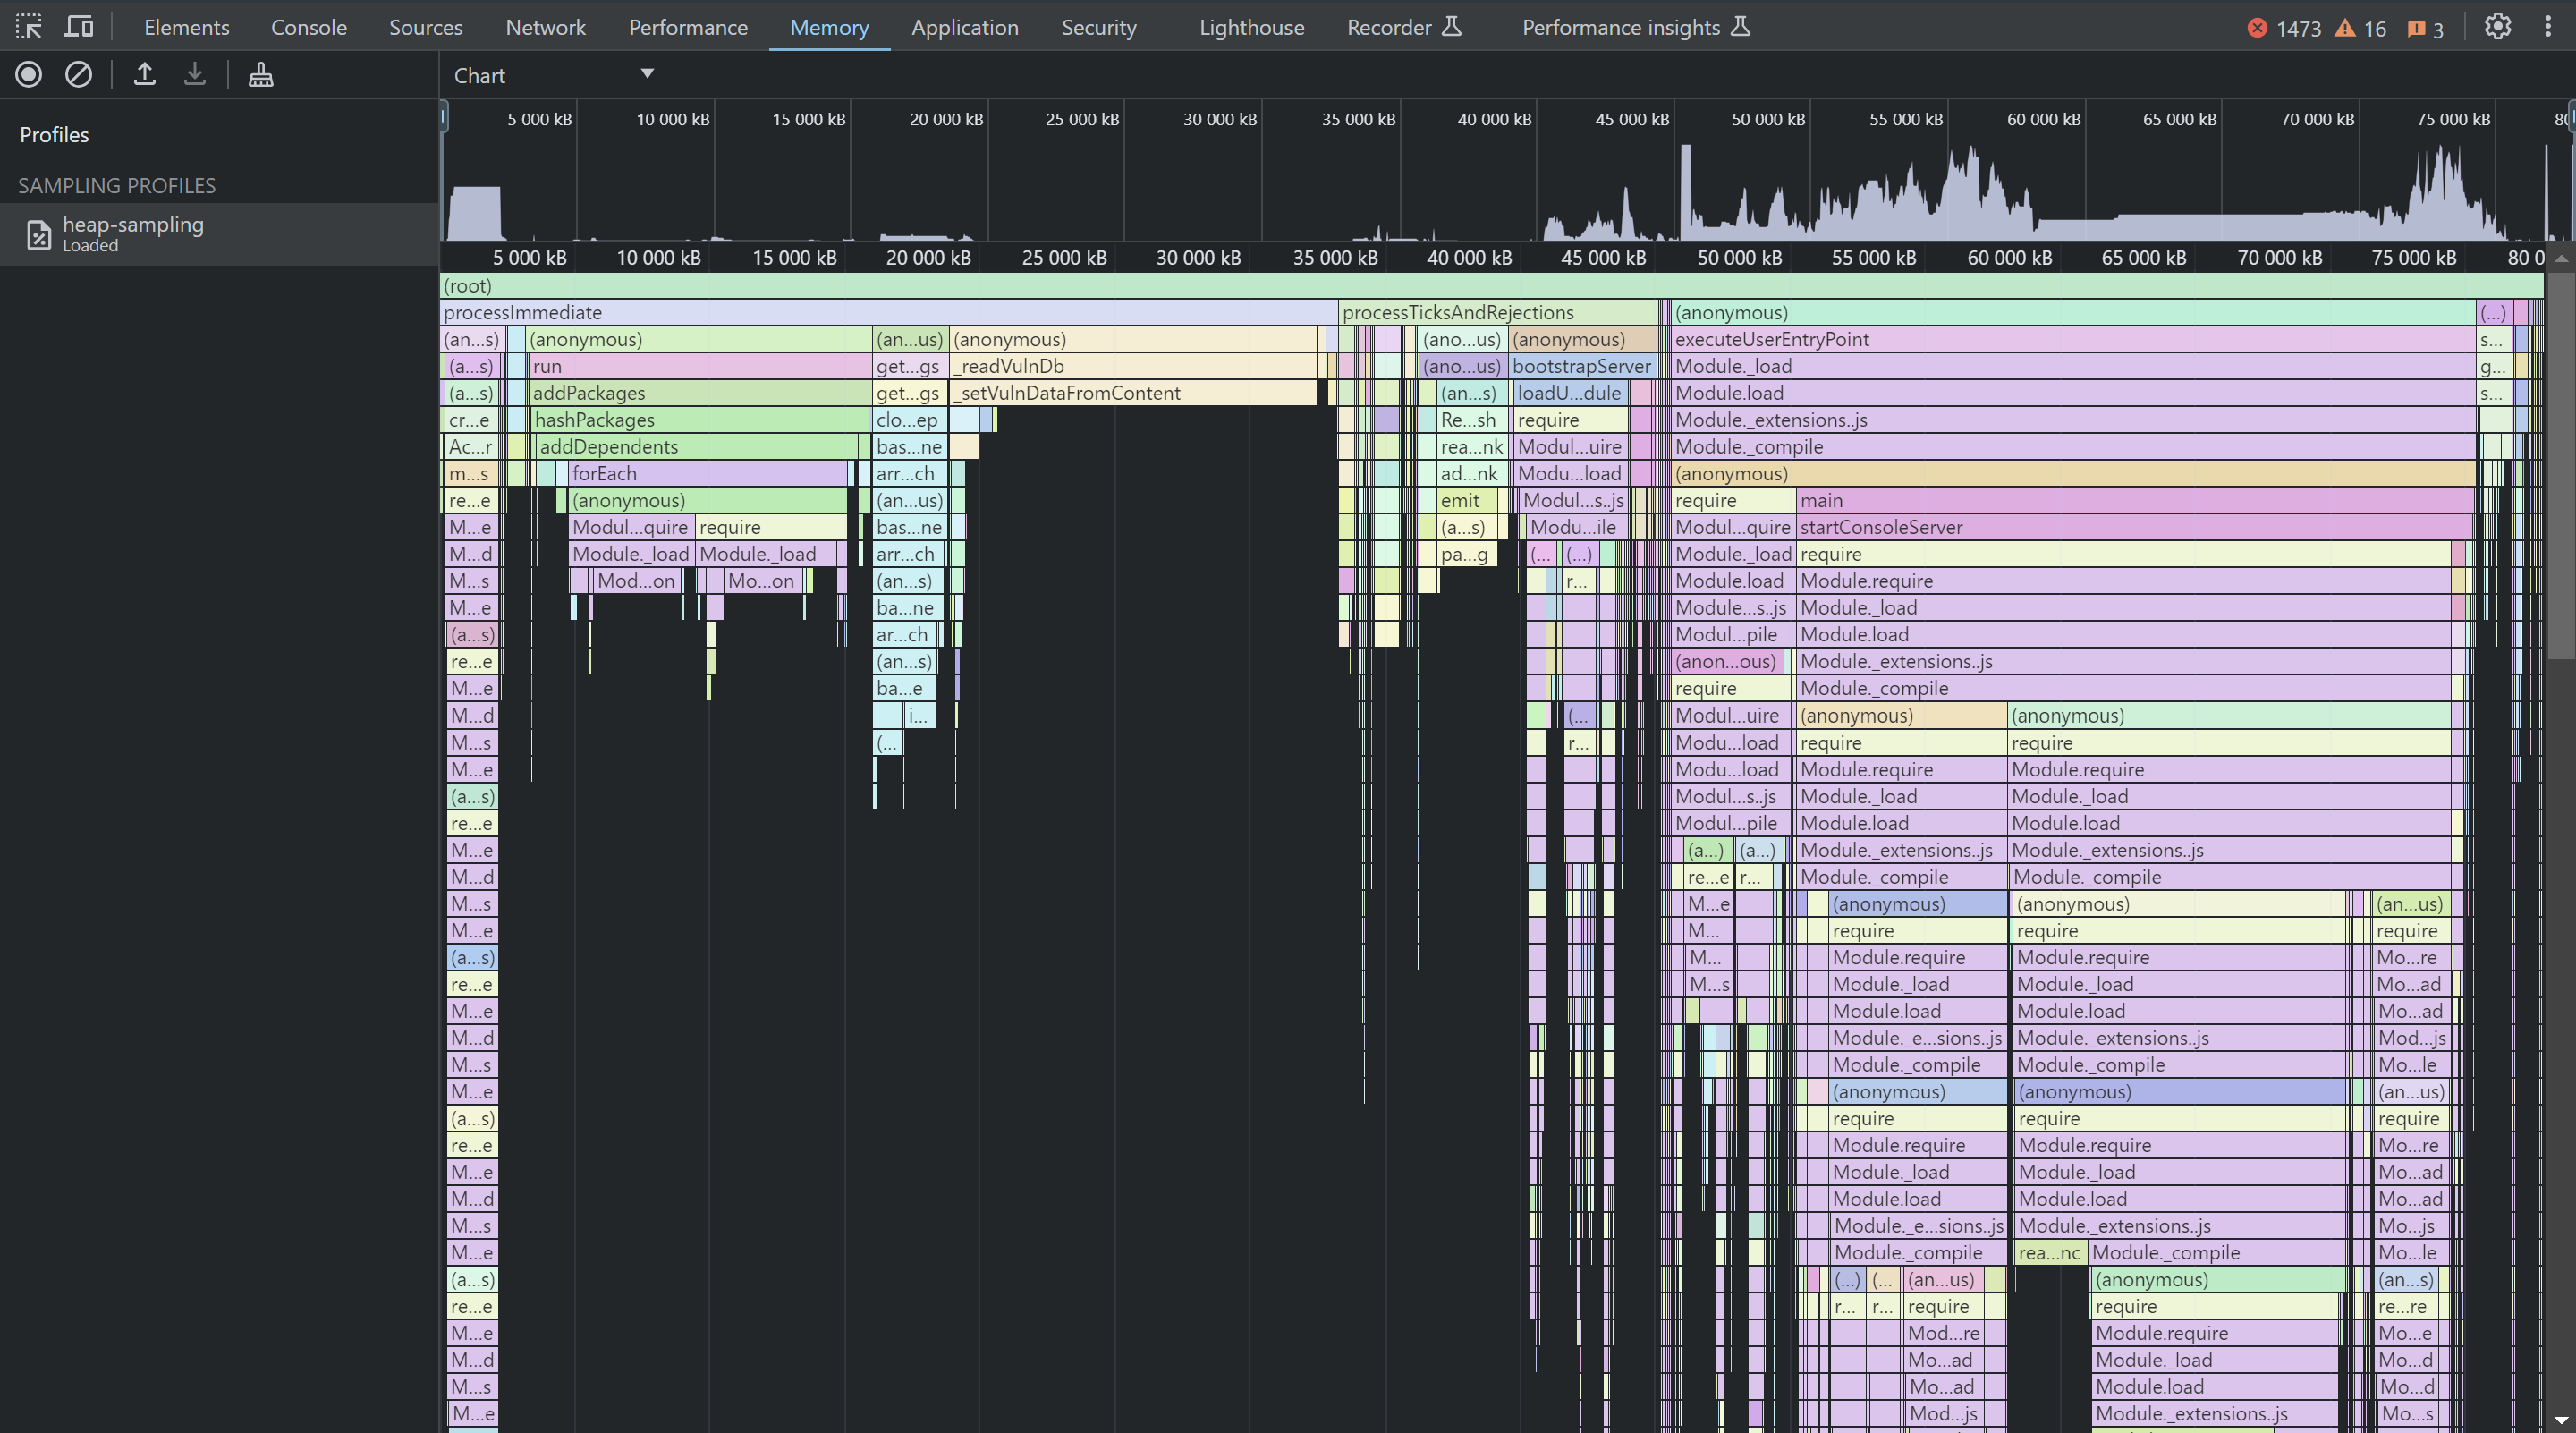 This screenshot is the memory profiler view in chrome devtools.
Without this new capability in N|Solid, developers relied on heap snapshots or to debug memory issues. However, these snapshots captured every single detail of the heap contents and structure, making them gigantic, risking out-of-memory crashes. Comparing multiple snapshots to identify differences was a complex and slow process that didn't pinpoint the root cause efficiently.
With heap sampling, you can avoid the overhead and high memory requirements of snapshots. By providing granular allocation details mapped to function names in your codebase, heap sampling tracks incremental changes over time, allowing you to quickly identify the most memory-intensive areas of your application.
Now, let’s talk about those new profilers more deeply.
Heap Sampling
Heap Sampling differs from Heap Snapshots in meaningful ways that enable use in production environments with minimal performance overhead. The fundamental difference is how it captures the data required to find memory leaks without a ton of unnecessary data. This has two key benefits; first, you will save a ton of cycles reviewing heap samples and you won’t have to leverage massive computational requirements for processing heap snapshots.
N|Solid has incorporated V8's sampling heap profiler, which samples object allocations and builds an online 'sampling' log that represents a snapshot of currently live objects in the system at any given time.
Each sampled allocation includes the stack trace at the time of allocation, making it extremely useful for detecting and diagnosing memory leaks. This sampling mechanism is lightweight ensuring it does not impact production performance.
Under the hood, N|Solid leverages the statistical properties of the Poisson sampling process to approximate the true allocation distribution from the collected samples. This allows it to provide an accurate representation of memory usage while minimizing overhead.
By integrating V8's sampling heap profiler, N|Solid delivers production-ready memory leak detection and diagnosis capabilities with low-friction instrumentation and performance impact that will help teams diagnose and solve issues faster.
How to trigger a heap sample from the N|Solid console
From your N|Solid console process details view, click on “New Heap Profile”, select for how long you want to run the sample, choose the “Heap sample” option and then click on the “START PROFILE” button.
Note: You can also monitor the memory allocation in your worker threads by choosing any thread from the profiler modal.
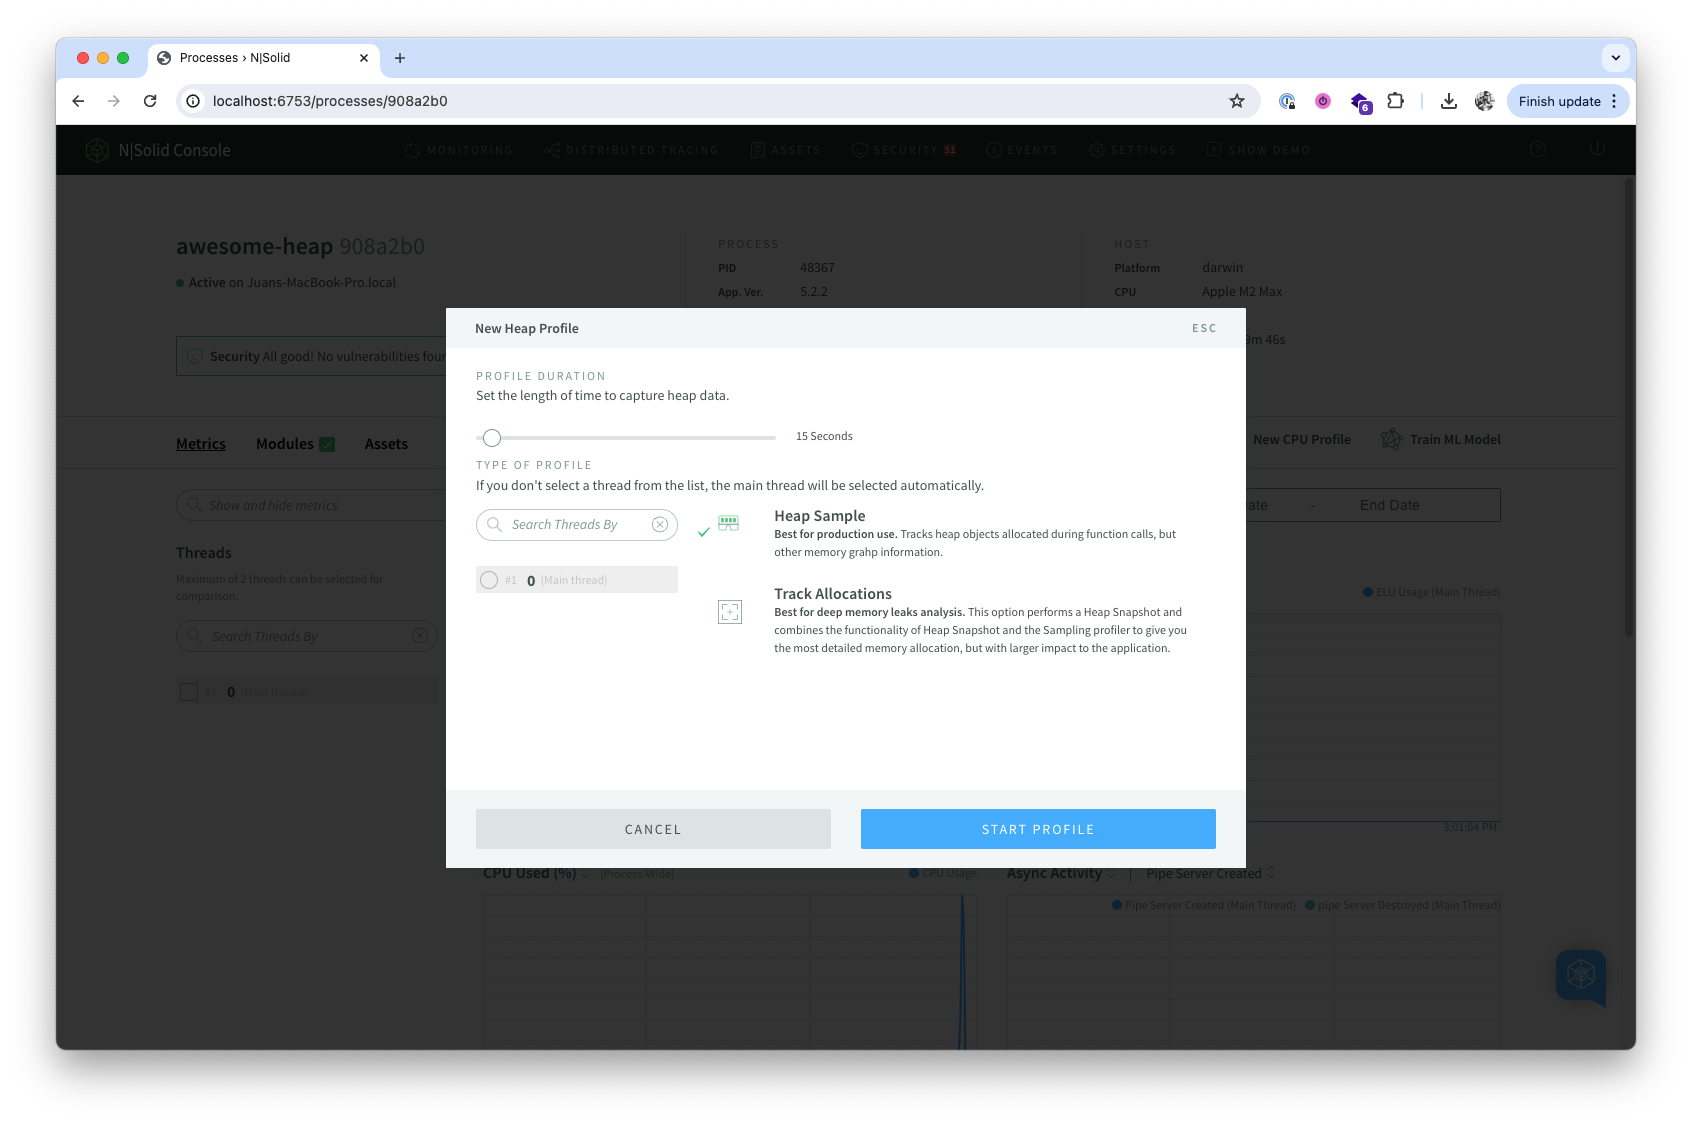 This screenshot is the memory profiler modal view in N|Solid console.
How to trigger a heap sample from the N|Solid JS API
It is as simple as run this for get a Node.js stream-based sampling profile.
const fs = require('fs');
const nsolid = require('nsolid');

// The signature is threadId and time in ms to run the profile.
const stream = nsolid.heapSamplingStream(0, 1200);
  .pipe(fs.createWriteStream('profile.heapprofile'));
Heap track objects
There’s a second mode of sampling available as well that combines the full graph context of the heap snapshot with the sampled allocations over time, combining the insights of both methods. It tracks the heap objects population statistics; heap objects relocations done by the garbage collector are recorded and added as an appendix to a heap snapshot.
How to start tracking heap objects from the N|Solid console
Heap Profiles are captured in nearly the same way as Heap Samples. From your N|Solid console process details view, click on “New Heap Profile”, select for how long you want to run the sample, choose the “Track Allocations” option and then click on the “START PROFILE” button.
Note: You could also monitor your worker threads by choosing any thread from the profiler modal.
 This screenshot is the memory profiler modal view in N|Solid console.
How to start tracking heap objects from the N|Solid JS API
With this simple snippet, you can have a Node.js stream-based profile.
const fs = require('fs');
const nsolid = require('nsolid');

// The signature is threadId and time in ms to run the profile.
const stream = nsolid.heapProfileStream(0, 1200)
    .pipe(fs.createWriteStream('profile.snapshot'));
You can try this new feature today along with all of the other valuable features in N|Solid with a Free account. We would love to hear from you about how you like the new feature, send us your thoughts contact@nodesource.com. To learn more about N|Solid visit nodesource.com.
Here at NodeSource we build low overhead monitoring for all your Node.js apps; happy hacking and safe heaps!